

Abstract
Architecture and microstructure of type I collagen fibers constitute central regulators of tumor invasion with aligned fibers providing a route for migration of stromal and cancer cells. Several different aspects of fibrillar collagen, such as stiffness, density, thickness, and pore size, may regulate migration of cancer cells, but determining effects of any one parameter requires clear decoupling of physical properties of collagen networks. The objective of this work is to develop and apply an in vitro three-dimensional (3D) tumor-extra cellular matrix (ECM) model with tunable physical parameters to define how stromal fibroblasts modulate collagen microstructure to control migration of breast cancer cells. We incorporated two different types of polyhedral oligomeric silsesquioxane (POSS) nano-molecules into a collagen/alginate matrix to induce different mechanisms of gelling. The resultant biomimetic, nanocomposite hydrogels show different collagen fibrillar microstructures while maintaining constant overall matrix stiffness, density, and porosimetry. Spheroids of human mammary fibroblasts embedded in these 3D matrices remodel the collagen network to varying extents based on differences in underlying matrix microstructures. The remodeled collagen matrix shows oriented, thicker fibrillar tracks, facilitating invasion of tumor cells. By decoupling effects of matrix stiffness and architecture, our nanocomposite hydrogels serve as robust platforms to investigate how biophysical properties of tumor environments control key processes regulating tumor progression in breast cancer and other malignancies.
Keywords: collagen, cancer associated fibroblast, POSS, nanocomposite hydrogel, tumor invasion
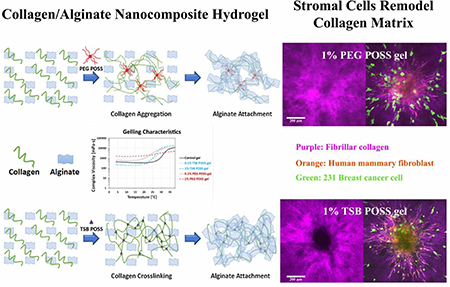
Graphical Abstract.
1. Introduction
Fibrillar collagen, the major component of the extracellular matrix (ECM) in breast cancer and many other malignancies, increasingly is recognized as a central regulator of tumor initiation and progression. Increased density of breast tissue on mammograms due to deposition of fibrillar collagen significantly increases risk for breast cancer with aggressive features.[1] During tumor progression, breast cancer associated fibroblasts and cancer cells remodel architecture and alignment of collagen at the tumor margin, which investigators have classified as tumor-associated collagen signatures (TACS).[2] The most advanced form of remodeling, characterized by straightened collagen fibers aligned perpendicular to the tumor margin, correlates with greater local invasion, local recurrence, metastasis, and death from breast cancer.[3–5] Adverse outcomes occur at least in part because breast cancer cells preferentially migrate along radially aligned collagen fibers at the interface of the primary tumor to invade adjacent normal tissue.[6]
To elucidate effects of collagen structure and alignment on tumor progression, investigators have designed a large number of 3D culture systems to model effects on invasion of cancer cells. Studies have focused on several biophysical parameters of collagen, including stiffness,[7] density,[8] fiber thickness,[5] and pore size.[3] Identifying effects of any one parameter on invasion poses substantial challenges because of close interrelationships among these physical properties. Increased density of collagen usually leads to alterations in fiber thickness, pore size, and stiffness. Identifying how specific biophysical properties of ECM controls tumor initiation and progression has potential therapeutic benefits, as interventions targeting ECM properties reduce invasion of cancer cells in pre-clinical models.[9–11]
Cancer-associated fibroblasts (CAFs), a major component of tumor stroma, remodel ECM as one mechanism to drive local invasion and metastasis.[12] CAFs not only secrete and align fibronectin but also exert traction forces on collagen fibers to promote directional migration of cancer cells.[13, 14] We have previously shown that human mammary fibroblasts (HMFs) lead migration of cancer cells out of multicellular tumor spheroids into a surrounding hydrogel, following a migration path perpendicular to the spheroid surface.[15] However, analyzing how interactions between fibroblasts and different collagen structures control ECM remodeling and tumor invasion remains challenging because existing methods restrict the ability to precisely control microstructure of collagen hydrogels.
To overcome limitations of existing hydrogel technologies, we investigated effects of incorporating polyhedral oligomeric silsesquioxanes (POSS) nano-molecules into a collagen-alginate hydrogel. This approach builds on recent successes combining hydrogels with a variety of different nanomaterials, generating nanocomposite materials with enhanced physical properties and functionalities.[16] POSS molecules have been widely used as a nanofiller in the polymer industry. A POSS cage (1.5 nm) is comparable to the dimensions of the linear polymer.[17] This feature enables POSS to control motions of polymer chains at the molecular level, enhancing physical properties such as temperature and oxidation resistance, dimensional stability, reduction in flammability, and mechanical properties of the reinforced polymer.[18] POSS-based materials are non-toxic and biocompatible.[19] Nevertheless, applications of POSS-based materials as hydrogels for 3D cell culture have not been reported previously. In this study, we employed two different POSS nano-molecules, trisilanolisobutyl-POSS (TSB POSS), and PEGylated-POSS (PEG POSS), to create well-controlled collagen network architectures without altering overall gel stiffness, collagen density, or macro-pore structure. Rheological tests demonstrated that TSB POSS acted as a cross linker to enhance collagen gelation, while PEG POSS functioned as a physically dispersed filler preventing inherent agglomeration of collagen. The two different gelling mechanisms of these nanocomposite hydrogels provide an approach to decouple fibrillar architecture of collagen from confounding parameters such as stiffness and mass density. We used these hydrogel systems to investigate interactions of mammary fibroblasts with different collagen networks to regulate migration of breast cancer cells. This study demonstrates the potential to generate user-defined, biomimetic ECM environments to analyze how physical aspects of tumors control tumor migration and invasion.
2. Materials and Methods
2.1. POSS nanocomposite hydrogel preparation
We prepared hydrogels as previously described.[15] Briefly, we mixed collagen type I (Cat#50201, Ibidi) with an alginate stock solution (alginic acid sodium salt Cat#A1112, Sigma), in 10× DMEM. We adjusted to neutral pH and then mixed the solution with cell culture medium (with or without live cells and spheroids). We then added either POSS or CaCl2 solution to achieve a final concentration of 3 mg/ml collagen and 5 mg/ml alginate. For SEM, compression testing, and porosimetry characterization, we prepared gels with different concentrations of PEG POSS or TSB POSS (0, 0.1%, and 1%). We prepared gels with 1% POSS for culturing cells and tumor spheroids. After mixing with POSS, we cured gels in a humidified tissue culture incubator with 5% CO2 for 20 minutes at 37 °C and then added fresh cell culture medium on top.
2.2. Mechanical compression test
We measured compressive elastic moduli of POSS incorporated gels as previously described.[15] Briefly, we prepared cylindrical gel samples with a diameter of 3 mm and thickness of 1 mm and compressed the hydrogels with a MicroSquisher (CellScale, Waterloo, Canada) in a water bath. We determined the compressive modulus from the slope of the linear region on the stress-strain curve (n = 8 samples per condition).
2.3. Porosimetry characterization
We performed mercury intrusion tests, including both low pressure (0.5 – 30 psi) and high pressure (30 – 180 psi) analyses on lyophilized hydrogel samples using a MicroActive AutoPore V 9600 porosimeter (Micromeritics Instrument Corporation, Norcross, GA) as described previously. [15] All curves shown in Figure 2(a-b) are representative of 3 averaged tests.
Figure 2. Characterization of hydrogel porosimetry.


(a) Cumulative pore area distribution with pore size. (b) Pore size distribution of POSS nanocomposite hydrogels. (c) Graph shows average and median pore sizes, respectively, corresponding to volume and surface area. ^: > control gel, p < 0.05, *: > 1% PEG POSS gel, p < 0.05. (d) Porosity of POSS nanocomposite hydrogels. *: > 1% PEG POSS gel, p < 0.05, #: > 0.1% PEG POSS gel, p < 0.05. All the curves presented in (a) and (b) are representative of the conditions tested. Variations among each replicate were too small to be represented). All numbers shown in (c) and (d) are weighted means and weighted standard deviations.
2.4. Microstructure examination
We obtained SEM images of lyophilized hydrogel samples using an AMRAY 1910 field emission scanning electron microscope at 15 kV.
2.5. Fibrillar collagen characterization
We performed SHG imaging on Olympus FVMPE-RS two photon microscope with Insight-DS+ laser (Spectra-Physics, Irvine, CA) and 25× NIR corrected objective (XLPLN25XWMP, NA=1.05, Olympus, Tokyo, Japan). We used 880 nm for excitation and collected emitted light at 460 nm. We exported SHG images to Imaris software for image segmentation and data analysis. Briefly, we created a binary mask channel based on the original SHG image (Figure S5a) from which we created a 3D surface (Figure S5b). We then used the 3D surface to build filaments (Figure S5c) that reconstructed the original SHG channel. To quantify fragments of fibers, we segmented a 30 μm x 30 μm x 30 μm cubic ROI of hydrogel and plotted data for each collagen fiber by diameter (x-axis) and volume (y-axis). The color bar denotes fiber diameter. We quantified alignment of collagen fibers by segmenting 8 different 500 μm x 200 μm x 200 μm cubic ROIs by rotating the raw image 45° each time to quantify 4 ROIs on horizontal and vertical axes and 4 ROIs on diagonal lines (Figure S6a). We determined the orientation angle for each filament based on the x-y axis, where horizontal indicated 0 or 180° (Figure S6b). We plotted the orientation angle of each fiber versus volume the with color bar indicating fiber length. For each measurement we processed 3 images from 3 biological samples to perform statistical analysis. The supplement contains additional details for details image segmentation and quantification.
2.6. Rheology testing
We measured the rheological characteristics of POSS incorporated hydrogels by performing a temperature sweep using a Modular Compact Rheometer MCR-302 (Anton Paar, Ashland, VA) equipped with 25 mm parallel plate-plate geometry. We set the gap between two plates as 1 mm. Before starting a temperature ramp, we set the system to 0 °C and let each sample equilibrate for 20 minutes, followed by a pre-oscillation step while the temperature quickly elevated from 0 to 4 °C. We then started a temperature sweep from 4 to 38 °C at a ramp speed of 5 °C/min, shearing the sample at a frequency of 1 Hz and 5% strain. We tested 3 samples for each condition for statistical analysis and plotted the average in Figure 5.
Figure 5. Effect of temperature on nanocomposite hydrogel gelation with TSB POSS and PEG POSS.

(a) Graph shows a temperature sweep from 4 to 38 °C at a ramp speed of 5 °C/min with samples sheared at a frequency of 1 Hz and 5% strain. Each curve represents an average of three replicates as variations among each replicate were too small to be represented). (b) Schematic of gelling mechanism with TSB POSS and PEG POSS incorporation as compared with blank control.
2.7. Cell culture
We cultured all cells in DMEM with 10% fetal bovine serum and 1% added penicillin/streptomycin/glutamine in a humidified 37 °C tissue culture incubator with 5% CO2. MDA-MB-231 human breast cancer cells (obtained from the ATCC and verified by short tandem repeat profiling) with LifeAct-GFP protein or unfused GFP have been described previously.[20–23] We previously described HMFs (gift of Dr. Daniel Hayes, University of Michigan) stably immortalized with a viral vector co-expressing telomerase and GFP [24], we added mCherry to these HMFs to distinguish them by dual-color fluorescence (GFP and mCherry).
2.8. Preparation of HMF spheroids
We prepared spheroids with HMFs as previously described.[23] Briefly, we added 3×10³ cells in 20 μl culture medium to 384-well low volume, non-adhesive, round bottom plates (#3676; Corning Inc., Corning, NY) and cultured cells for 48 hours before embedding in gels.
2.9. Fluorescence microscopy
We captured all microscopic images of cells and spheroids with an upright Olympus FVMPE-RS two photon microscope with Insight-DS+ laser (Spectra-Physics, Irvine, CA) and 25× NIR corrected objective (XLPLN25XWMP, NA=1.05, Olympus, Tokyo, Japan). We used 920 nm excitation for GFP and 1040 nm excitation for red fluorescent proteins, collecting emitted light in green (495–540 nm) and red (575–630 nm) channels, respectively. To limit signal attenuation throughout 300 μm stacks (6 μm step size), we adjusted laser transmission to the sample and detector gain to maximize signal per slice. To capture invasion from spheroids, we stitched images with a resolution of 1024×1024 to show the entire field. We used the same acquisition parameters for all spheroids compared within a single experiment.
2.10. Quantification of spheroid invasion distance
We defined the margin of invasion as the circular outer edge of the radial migration of cells from spheroids. To quantify invasion in Figure 6(d), we took the invasive margin of HMFs in gels as a circle and then measured the diameter using CellSens software (Olympus, Tokyo, Japan). For each condition, we measured 6 spheroids and repeated experiments with 3 independent replicates of cells to achieve statistical significance.
Figure 6. HMF spheroids remodel collagen alignment to regulate cancer cell migration in POSS nanocomposite hydrogels.


We embedded HMF spheroids (shown as overlay of red and green fluorescence) into hydrogels with dissociated MDA-MB-231 cells (green fluorescence). Images show the z-intensity projection of HMF spheroids and cancer cells overlaid on second harmonic imaging of fibrillar collagen matrix (pseudocolor in purple) (top row). (a) On day 0 (2 hours after embedding), HMF spheroids showed no protrusions, and MDA-MB-231 cells retained round morphology without localization to spheroids. Bottom row displays measured orientations of fibrillary collagen, where 0° indicates fibers oriented perpendicular to the spheroid surface (radical alignment). Pseudocolor side bar depicts fiber length. (b) On day 2 (48 hours after embedding), HMFs migrated extensively out of spheroids in a sun-burst pattern. MDA-MB 231 cells showed elongated morphology and migrated towards spheroids (top row). HMFs remodeled the collagen matrix, evidenced by thicker bundles of fibers with alignment coincident with HMF migration pathways (middle row). Distribution of fibrillar collagen orientation angles showed a peak at 0°, indicating more fibers with perpendicular alignment (bottom row). (c) Graph compares alignment of collagen fibers perpendicular to spheroid surfaces in different hydrogels, on days 0 and 2. *: > 1% PEG POSS gel, p < 0.05. (d) Quantification of invasion distances of HMF spheroids in different gels on day 2. *: > 1% PEG POSS gel, p < 0.05; #: > 7.5 mM CaCl2 gel, p < 0.05.
2.11. Statistical analysis
We report all statistics as means ± standard deviation. We used ANOVA tests followed by the Tukey test for post-hoc pairwise comparisons.
3. Results and discussion
3.1. Mechanical properties of POSS nanocomposite hydrogels
We prepared five different pre-gel solutions including control, 0.1% TSB POSS, 1% TSB POSS, 0.1% PEG POSS, and 1% PEG POSS and incubated each at 37 °C for 2 hours to form hydrogels for compression testing. Figure 1 shows the compressive stiffness of nanocomposite hydrogels with TSB or PEG POSS with concentrations of 0.1% and 1%, respectively. Incorporation of POSS reinforces the matrix by increasing gel stiffness, and gel stiffness increases with POSS concentration. The compression modulus of the hydrogel increased approximately 45% even with addition of only 0.1% TSB POSS. With 1% POSS, the TSB and PEG POSS gels showed increases of 75% and 60%, respectively, relative to control.
Figure 1. Mechanical compressive modulus of POSS nanocomposite hydrogel.

Data represent mean values with standard deviation (n=6). *: > control, p < 0.05. #: > 0.1% PEG POSS gel, p < 0.05. $: > 0.1% TSB POSS gel, p < 0.05.
Measurement of hydrogel stiffness is complex, and several approaches and mathematic models have been developed.[25, 26] All hydrogels in our compression tests exhibited full elastic recovery at a strain up to 30%. Although POSS nano-molecules have been widely applied as nanofillers in the polymer industry, the use of POSS-based nanocages for reinforcement of collagen/alginate hydrogels has never been explored in the literature. From Figure 1, both 1% PEG POSS and 1% TSB POSS nanocomposite hydrogels possess a similar compressive stiffness around 4 kPa present in tumors, similar to the hydrogel cross-linked with 7.5 mM CaCl2 as we reported previously.[15]
3.2. Porosimetry of POSS enhanced hydrogel
Figure 2(a) shows the cumulative pore area of POSS nanocomposite gels. As compared with the control gel, POSS nanocomposite hydrogels showed reduced cumulative pore area in the small pore size region (less than 10 μm). Pore size distribution in Figure 2(b) further confirmed this finding, where the control gel showed higher intrusion volume in the region of 3 – 10 μm than other curves. For all POSS gels, the majority of pores ranged from 100 to 130 μm with the PEG POSS gel showing a wider peak than the TSB POSS gel.
We detected no significant difference in pore size distribution and cumulative pore area between 0.1% and 1% TSB POSS gel samples. Conversely, increasing concentration of PEG POSS from 0.1% to 1% significantly affected porosimetry of the hydrogel matrix. The cumulative pore area of the 1% PEG POSS gel showed a nearly linear curve versus pore size diameter, indicating homogeneous dispersion of PEG side chains along with collagen fibers. The 0.1% PEG POSS gel showed reduced slope and reached plateau at a small pore size region (pore size < 10 μm), consistent with the lack of small pores.
Figure 2 (c) summarizes average pore sizes, median pore sizes according to pore area, and pore volume. We identified no significant difference in all three parameters between 0.1% and 1% TSB POSS gels, while the 0.1% PEG POSS hydrogel showed significantly higher values for all three parameters than the 1% PEG POSS gel. In addition, the 1% TSB POSS hydrogel had higher average and median pore size according to pore area than the 1% PEG POSS hydrogel. This result agreed with the cumulative pore area curves shown in Figure 2(a), where the 1% TSB POSS gel had higher cumulative pore area in a large pore size range. The median pore size according to volume of 1% TSB POSS, however, did not differ significantly from that of 1% PEG POSS. These data were consistent with the pore size distribution curve shown in Figure 2(b), as both gels showed similar peaks. Porosities of POSS nanocomposite hydrogels are shown in Figure 2(d), where 1% TSB POSS gel showed significantly higher porosity than the 1% PEG POSS gel. Note incorporation of either 0.1% TSB or PEG POSS into the hydrogel matrix did not significantly alter porosity, and the large error bars indicate variation due to the small amount of POSS addition.
We have published the porosimetry of calcium cross-linked collagen/alginate hydrogels using the same MIP approaches.[15] The median pore size according to volume, average pore size, and median pore size according to area of the 7.5 mM CaCl2 hydrogel were 100 μm, 50 μm, and 30 μm, respectively. These values were slightly smaller than the 1% TSB POSS hydrogel and larger than the 1% PEG POSS hydrogel. The porosity of 7.5 mM CaCl2 gel was 92.6±6.12%, which did not differ significantly from the 1% TSB POSS gel (92.1±1.78%) but was significantly higher than the 1% PEG POSS gel (79.6±0.98%). Therefore, the 7.5 mM CaCl2 hydrogel possessed similar stiffness and porosimetry to the 1% TSB POSS hydrogel. Although the 1% PEG POSS hydrogel exhibited the same stiffness as the other two, this hydrogel showed reduced pore size and porosity.
3.3. Microstructure of POSS nanocomposite hydrogel
Figure 3 shows SEM images of nanocomposite hydrogels with TSB POSS or PEG POSS. Our previous study demonstrated that the microstructure of collagen/alginate matrix possessed cross- linked collagen fibers as frame, where alginate flakes attached and aggregated to form curved sheets (by calcium crosslinking).[15] In this study, compared with the control hydrogel that exhibited random distribution of collagen fibers with uncross-linked alginate flakes, POSS incorporated hydrogels showed clearly uniform microstructures with defined pore geometry and well-distributed pore size.
Figure 3. SEM images of POSS nanocomposite hydrogels.

Scanning electron micrographs of nanocomposite hydrogels with 0.1% or 1% PEG POSS or TSB POSS. We acquired images at magnifications of 5000X (left), 500X (middle), and 100X (right). Scale bars indicate 10 μm, 50 μm, and 100 μm respectively.
The 0.1% TSB POSS incorporated gel showed denser, more circular-shaped pores than the 0.1% PEG POSS gel. As compared with the 0.1% TSB POSS gel, the 1% TSB POSS gel showed a less uniform pore structure where larger curved alginate sheets formed and dominated the structure. Potentially, these differences occurred because POSS molecules also interacted with the alginate matrix by weak bonding forces such as hydrogen bonding.[17] From Figure 2 there was no significant difference in porosimetry between 0.1% and 1% TSB POSSs, indicating that 1% TSB POSS resulted in some excess nanoparticle in the gel system that did not contribute to the primary pore structure. Since TSB POSS is not water soluble, as the ethanol solvent evaporated during gelation, the excess amount of TSB POSS formed small aggregates (small white triangle shown in the 5000X SEM image of 1% TSB POSS gel). These aggregates attached to the alginate sheets, which also facilitated aggregation of alginate flakes and led to the secondary structure shown in Figure 3.
The incorporation of 0.1% PEG POSS changed microstructure of the hydrogel without altering stiffness. The 0.1% PEG POSS gel showed larger pore sizes than the control gel at all three magnifications, which further confirmed the pore size characterization in Figure 2(c-d). The 0.1% PEG POSS gel showed more circular shaped pores compared with the 1% PEG POSS hydrogel.
In general, POSS molecules display better dispersion into a polymer matrix than other common nanoparticles (carbon nanotubes, nanoclays) since PEG POSS is water soluble and TSB POSS is soluble in ethanol. From Figure 2(a) the POSS nanocomposite hydrogels showed smaller cumulative pore area in the small pore size region (less than 10 μm) than the control hydrogel, consistent with less small pores in these nanocomposite gels. This result agreed with high magnification (5000X) SEM images shown in Figure 3, where only the control gel showed small pores made of a collagen fiber network. The microstructure of hydrogels significantly affects mechanical properties as well as growth of cells, therefore biomedical applications require a uniform gel structure.
3.4. Collagen fibrillar architecture
We used two-photon microscopy with second harmonic generation (SHG) imaging to analyze architecture of hydrated gels. We focused on comparing 1% TSB POSS and 1% PEG POSS nanocomposite hydrogels with the 7.5 mM CaCl2 gel because 1) these gels have similar overall stiffness; 2) the matrix contains the same mass density of collagen; and 3) the 1% TSB POSS gel possesses similar porosity to a 7.5 mM CaCl2 hydrogel and similar median pore size by volume to the 1% PEG POSS hydrogel. Figure 4(a) shows the microstructure of fibrillar collagen in each gel. The 1% PEG POSS nanocomposite hydrogel showed thinner fibers and smaller sizes of pores, while the CaCl2 hydrogel showed thicker fibers and larger pore sizes. These findings were consistent with the porosimetry measurements in Figure 2. The 1% TSB POSS gel showed an intermediate appearance with fiber thickness between that of the 1% PEG POSS and CaCl2 hydrogels.
Figure 4. Microstructure of fibrillar collagen.


(a) Fibrillar collagen microstructure. Top row: Collagen fiber microstructure shown by second harmonic two-photon microscopy in nanocomposite hydrogel with 1% TSB POSS, 1% PEG POSS, or 7.5mM CaCl2 crosslinking. Bottom row shows corresponding quantification of collagen fibers within a 30 μm3 VOI segmented in Imaris software for each type of hydrogel. Plots show measurements of fiber diameter (x-axis) and volume (y-axis). The pseudocolor scale also indicates diameter of fibers. (b) Quantification of collagen diameter. *: > 1% PEG POSS gel, p < 0.05; #: > 1% TSB POSS gel, p < 0.05. (c) Quantification of collagen volume. *: > 1% PEG POSS gel, p < 0.05; #: > 1% TSB POSS gel, p < 0.05.
We then quantified fibrillar collagen in each gel using 3D image segmentation, which pseudocolored each segmented fiber according to its thickness and generated a map of fiber thickness versus volume for each hydrogel (Figure 4(a)). We defined the fibrillar collagen volume as the volume of segmented collagen fiber fragment. Combining the quantified volume and diameter, the shape of fibrillar collagen can be more easily visualized. We further quantified average fiber thickness and volume in Figure 4(b-c). From these measurements, 43.7% of fibers in the 1% PEG POSS nanocomposite hydrogel distributed in the 0.5 – 0.6 μm range with only 2.2% of fibers exceeding a diameter of 0.8 μm or volume above 3.0 μm3. By comparison, fiber diameters in the CaCl2 hydrogel predominantly (50.7%) distributed in a range of 0.6 −0.85 μm with a relatively large proportion (20%) of fibers above 3 μm3. The fiber thickness in TSB POSS distributed more evenly as compared with the other two gel conditions. The average fiber volume followed the same trend as average thickness, where the CaCl2 hydrogel and 1% PEG POSS nanocomposite hydrogel showed the largest and smallest values, respectively.
Interestingly, the 1% TSB POSS nanocomposite hydrogel exhibited 2% thin fibers (0.6 – 0.7 μm) with larger volume (> 3.5 μm3). These findings further indicate that enhanced gelation by TSB POSS relates to elongation of collagen fibers.
3.5. Gelling characteristics of POSS nanocomposite hydrogels
The incorporation of 1% TSB and PEG POSS into the collagen/alginate matrix induced different fibrillar collagen microstructure from hydrogels cross-linked with 7.5 mM CaCl2, although the overall gel stiffness, collagen density, and pore structure were similar. Among the three types of hydrogels, the CaCl2 gel showed the largest fibers in both diameter and volume, while the PEG POSS nanocomposite hydrogel showed the smallest fibers and pore size. The TSB POSS hydrogel showed more uniform distribution in fiber size, intermediate between the other two hydrogels. To establish causes of these differences in collagen structure, we next explored gelling mechanisms of POSS nanocomposite hydrogels. Since the collagen/alginate hybrid hydrogel underwent sol-gel transitions resulting in rapid changes in solubility upon heating, we performed rheological tests on the thermal-induced gelation to measure the complex viscosity change with rising temperature.
Figure 5(a) shows changes of gelling characteristics due to incorporation of TSB POSS and PEG POSS with temperature increasing from 4 to 38 °C at constant ramp speed. The control curve demonstrated gelation of collagen at an onsite temperature of 28 °C, where the complex viscosity increased dramatically. Addition of TSB POSS enhanced gelation of collagen by lowering the onsite gelling temperature. POSS cages are considered as the smallest possible form of silica, where the size of the POSS cage (1.5 nm) is comparable to dimensions of the linear polymer.[27, 28] TSB POSS has an open-cage like structure with an inorganic silsequioxane at the core with organic isobutyl groups attached at the corners of the cage and three active silanol functionalities.[29] By incorporating 1% TSB POSS into the master hydrogel, the onsite gelling temperature decreased to 18 °C. This indicated a chemical reaction between TSB POSS and collagen, where the active silanol groups (Si−OH) on TSB POSS reacted with the hydroxyl groups on collagen fibers and cross-linked the network. The instant complex viscosity of hydrogels with 0.1% and 1% TSB POSS addition reached a similar plateau as temperature increased to 38 °C, and TSB POSS hydrogels both were higher than control and PEG POSS hydrogels.
PEG POSS has a dendritic structure, where eight long arms of polyethylene glycol polymer chain attach on the inorganic siloxane core, resulting in high water solubility.[30, 31] Incorporation of a small amount (0.1%) of PEG POSS increased solubility of the system and shifted the onsite gelation point to a lower temperature (20 °C), while thermal induced cross-linking of fibrillar collagen still occurred. However, incorporation of a large amount (1%) of PEG POSS reversed this effect. In contrast to TSB POSS that enhanced the gelation of collagen, addition of 1% PEG POSS largely attenuated the inherent gelation kinetics of collagen. As shown in Figure 5(a), the final complex viscosity at 38 °C dropped dramatically as the PEG POSS concentration increased. Addition of 1% PEG elevated the initial complex viscosity higher than other conditions due to the large amount of PEG side chains. The viscosity of PEG POSS nanocomposite hydrogel did not increase as dramatically with elevated temperature as other hydrogels. Therefore 1% PEG POSS incorporation disturbed the inherent agglomeration of collagen fibers upon heating, as the introduced soft PEG side chains entangled with the collagen fibrils that inhibited collagen fibers to aggregate themselves. Meanwhile, the hydrogen bond between PEG and collagen restricted chain mobility, conferring the sol-gel with a more stabilized condition.
Figure 5(b) shows schematics of gelling mechanisms with incorporation of TSB POSS and PEG POSS as compared with blank control gel. Our results showed two different strategies for preparing POSS nanocomposite hydrogels. Incorporation of TSB POSS into the collagen/alginate hydrogel was based on chemical reaction, where TSB POSS molecules acted as cross-linker to enhance gelation of collagen. By comparison, incorporation of PEG POSS occured through physical blending with PEG side chains physically dispersed through weak interactions with collagen, and anchorage of PEG chains on POSS cage stabilized the entire polymer motion. In other words, the fibrillar collagen shown in PEG POSS gel predominantly represented precursors of thermally-induced, fibril-forming collagen. Collagen fibrils shown in the CaCl2 hydrogel were an assembly of supra-fibrillar architecture due to full thermal-gelation. If the PEG chains are free in the system without anchorage or chemical crosslinking, the system will not form a hydrogel since water-soluble PEG molecules increase solubility of entire system.[32]
To confirm the rheological results, we used two measuring systems and tested samples of different volume. Both parallel plates and concentric cylinder systems showed similar results, and the hydrogel samples all remained intact after a temperature sweep (Figure S1). We also found that addition of CaCl2 did not affect gelling kinetics of collagen (Figure S2), confirming the collagen microstructure of the 7.5 mM CaCl2 hydrogel was a fully thermal-induced collagen gel network.
To prove the enhanced gelation of collagen with TSB POSS incorporation required the silanol rather than isobutyl group, we further tested gelling kinetics of the collagen/alginate matrix with several different silanol-POSS molecules. Figure S3 shows the complex viscosity as a function of temperature for hydrogels with (a) TriSilanolEthyl (TSE) POSS, (b) TriSilanolPhenyl (TSP) POSS, and (c) TetraSilanolPhenyl (TetraSP) POSS. These results confirmed that the silanol group (not the R group) acts as cross-linker to collagen gelation. Interestingly, the R group also affects gelation. When R group is phenyl, the higher concentration (1%) showed attenuated gelation relative to the lower concentration (0.1%) for both tri-silanol and tetra-silanol POSS (Figure S2 (b-c)). These results differ from small R groups such as isobutyl and ethyl.
As shown in Figure 1, the decreased collagen gelation with 1% PEG POSS did not affect the final mechanical stiffness of the hydrogels. This occurred because the kinetics shown in this experiment only indicated gelation of collagen fibers without cross-linking due to the lack of calcium. After gelation of collagen occurred, the alginate in the system attached onto the collagen network and further strengthened the hydrogel. Therefore, incorporating 1% PEG POSS, 1% TSB POSS, or 7.5 mM CaCl2 into the same collagen/alginate matrix induced three different gelling mechanisms without altering overall gel stiffness.
Differences in gelling mechanisms also explained the similar porosimetry of 1%TSB POSS and 7.5 mM CaCl2 hydrogels shown in Figure 2, since TSB POSS enhanced agglomeration of fibrillar collagen. Excess TSB POSS also assisted alginate crosslinking, resulting in a similar gel microstructure to the CaCl2 hydrogel. Incorporation of 1% PEG POSS completely reduced collagen agglomeration but induced a stabilized physical entanglement of PEG chains with fibrillar collagen. Changes in gelation mechanism depended both on the type of POSS nanoparticle and concentration of POSS incorporated. Here in this study, we chose 0.1% and 1% as two representative concentrations for several reasons. First, we wanted to make gels with stiffnesses comparable to an in vivo tumor. With the fixed collagen and alginate matrix concentration, the change in POSS concentration from 0.1 to 1% produced the desired range of stiffnesses. Second, with the increase from 0.1 to 1% TSB POSS, we added an excess amount of TSB POSS that contributed to aggregation of alginate. Depending on goals of future studies, we envision that investigators can generate gels with different mechanisms of gelation and resultant microstructures of fibrillary collagen by testing alternative types of POSS and/or concentrations. While the Ca gel we developed previously demonstrates that HMFs remodel ECM, this system does not allow us to investigate how different microstructures of ECM alter cell migration. The Ca and POSS gels have similar stiffness and other physical properties but distinct microstructures imparted by different mechanisms of gelation. The nanocomposite hydrogels provide an approach to decouple the fibrillar architecture of collagen from other confounding parameters such as stiffness and mass density. We believe this method provides a valuable new platform for mechanistic studies of ECM remodeling by stromal cells and cell migration.
3.6. Multi-cellular tumor environments remodel the collagen network
As we have created different collagen microstructures without changing the overall mass density of collagen or hydrogel stiffness, we then investigated remodeling of different collagen microstructures by fibroblasts. We built a 3D multi-cell migration model in nanocomposite hydrogels with both 1% TSB and PEG POSS and compared the two conditions with a 7.5 mM CaCl2 hydrogel. The 3D multi-cell migration model involved a spheroid made of human mammary fibroblasts (HMFs) embedded into the pre-gel solutions with dissociated MDA-MB-231 breast cancer cells to mimic invasion of malignant cells from breast tumor. Once the solutions gelled, on day 0 the HMF spheroids exhibited smooth surfaces without any protrusions of cells. Cancer cells distributed randomly throughout each hydrogel, and cells showed no elongation or polarization. We overlaid fluorescent images of spheroids (red and green) and cancer cells (green) with second harmonic imaging of fibrillar collagen matrix (purple) in zintensity projection (top row, Figure 6(a)). The bottom row of this figure shows quantified distributions of fibrillar collagen orientation angles corresponding to each hydrogel. We observed no differences in spheroids or cancer cells on day 0. We note HMFs express both green fluorescent protein (GFP) and mCherry to distinguish these cells from MDA-MB-231 breast cancer cells. As spheroids enlarge, preferential transmission of red light through tissue accounts for greater detection of fluorescence from mCherry.
The day 2 images in Figure 6(b) showed dramatic changes from day 0, where HMFs migrated extensively out of spheroids to the surrounding gel in a sun-burst pattern. Breast cancer cells migrated in an opposite direction towards spheroids and migrating cancer cells demonstrated elongated protrusions pointing to spheroids. Second harmonic images of fibrillar collagen in the middle row of Figure 6(b) clearly showed remodeling of the collagen network, where thicker bundles of fibers formed with alignment coinciding to pathways of migrating HMFs. The distribution of fibrillar collagen orientation angles (bottom row in Figure 6(b)) showed a peak at 0° indicating more fibers with alignment perpendicular to the spheroid surface. While all three gels showed similar cell migration, remodeling of collagen fibers varied among hydrogels. The 1% TSB POSS gel showed most obvious collagen bundles, followed by the 7.5 mM Ca gel. Collagen remodeling in the 1% PEG POSS gel, however, did not show clear collagen bundles as observed in the other two gels. In the 1% PEG POSS gel, thin fibrillar collagen fragments just aggregated denser in the region of HMFs relative to other regions. These differences corresponded with initial collagen microstructures in each gel. Thinner and non-cross-linked fibers of collagen in PEG POSS gel were more mobile than cross-linked fiber networks, reducing force transmission.[33, 34] TSB POSS enhanced cross-linking of collagen networks with more elongated fibers, facilitating transmission of forces exerted by HMFs.[35]
We quantified the percentage of fibrillar collagen that aligned perpendicularly to the spheroid surface in each gel on both day 0 and day 2. As shown in Figure 6(c), none of the gels showed alignment of collagen on day 0, but the alignment increased 0~30% for all three hydrogels on day 2. The 1% PEG POSS gel showed significantly less alignment than the other two (p = 0.023), while the 1% TSB POSS nanocomposite hydrogel showed a slightly larger average percentage value that did not differ significantly from the 7.5 mM CaCl2 gel. We further quantified the invasion distance of HMFs from spheroids in all hydrogels (Fig 6(d). Similar to alignment, HMFs migrated least in the 1% PEG POSS hydrogel, while the 1% TSB POSS hydrogel showed the largest invasion distance. Combining Figure 6(c) and (d), the ~ 5% increment in collagen alignment between 1% TSB POSS gel and 1% PEG POSS gel resulted in ~90 μm increment in HMF invasion distance, which is ~ 50% of the original spheroid diameter on day 0. The invasion distance in 7.5 mM CaCl2 gel was significantly smaller than in TSB POSS hydrogel. From Figure 6(c) and (d), the HMF invasion distance followed the trend of fibrillar collagen alignment, but not the same as the trend of collagen fiber diameter and volume in blank gel shown in Figure 4 (b-c). In other words, thicker fibers in the CaCl2 hydrogel did not contribute to more alignment and HMF migration. Instead, collagen fibers with slightly smaller thickness but in a more cross-linked network in a TSB gel resulted in greater HMF remodeling and migration.
These results indicate differences in initial collagen microstructure in each hydrogel affects remodeling of collagen alignment and subsequent migration of HMFs. We previously showed migration of cancer cells following HMF’s,[15] a complex process both cell-cell and cell-matrix interactions. The reasons why cancer cells followed HMFs include alignment of collagen fibers and direct cell-cell interactions between HMFs and cancer cells. In this study, we chose spheroids made of HMFs rather than cancer cells to focus solely on interactions betwee fibroblasts and collagen fibers in our engineered tumor environments. Incorporating other cell types into these spheroids would introduce additional complexity from intercellular interactions as well as effects of HMF’s on collagen.
Migration of cancer cells did not reproduce results with HMFs. As shown in Figure 6(b), breast cancer cells migrated extensively towards spheroids in all three gels. Migration of cancer cells may be driven by gradients of chemoattractant molecules secreted by HMFs, overcoming differences in collagen structure and alignment. Supporting this conclusion, we observed that some breast cancer cells did not migrate precisely along aligned collagen fibers as seen with HMFs (Figure S4). Other ECM components also may provide pathways for migrating breast cancer cells. For example, fibronectin is another ECM protein that promotes migration of cancer cells.[36] Fibroblasts secrete and align fibronectin fibers to enhance migration of cancer cells.[37] In our current multi-cell migration model, however, we did not attribute cancer cell migration to fibronectin since the migration direction of cancer cells runs opposite to HMFs. Fibronectin secreted by HMFs will be aligned with orientations of these cells, while cancer cells migrated towards HMFs rather than following HMF migration. We designed this stromal cell spheroid-dissociated cancer cell model specifically to illustrate remodeling of collagen fibers by HMFs and the subsequent migration of cancer cells. Our results clearly showed interactions among HMFs, cancer cells, and collagen. Since remodeling of collagen occurs in many primary tumors besides breast cancer, this model system is also applicable to other cancer types. For future investigations of other regulators of cell migration, we can modify this model by changing cellular constituents of spheroids as well as the surrounding gel. The ability to vary both cellular and ECM components makes this a versatile platform to study a variety of migration behaviors in 3D. To our knowledge, this is the first study combining spheroids with dissociated cells in a 3D hydrogel to study ECM remodeling and cancer cell migration. In the future, we plan to expand this work by introducing other ECM components, such as fibronectin and hyaluronic acid, to evaluate effects on migration of cancer cells.
4. Conclusion
We employed a nanocomposite approach to achieve a tunable collagen matrix with altered gelling mechanisms and corresponding microstructures. This series of nanocomposite hydrogels decoupled effects of matrix stiffness and architecture on tumor invasion efficiency. We also highlighted a function of fibroblasts to facilitate migration by reorganizing the collagen microstructure. We demonstrated the potential of nanocomposite 3D matrices to serve as robust platforms for mechanistic studies of interactions between physical and cellular components of tumor environments.
Supplementary Material
Statement of Significance.
Our manuscript demonstrates a new type of nanocomposite hydrogel with two different gelling mechanisms, produced by incorporating two types of Polyhedral oligomeric silsesquioxane (POSS) nano-molecules into a collagen/alginate matrix. The resultant biomimetic hydrogels show different fibrillar collagen microstructures while maintaining constant overall matrix stiffness, density, and porosimetry. These gels allow us to uncouple effects of matrix stiffness versus architecture on migration and invasion of breast cancer cells and stromal fibroblasts. Upon embedding spheroids of human mammary fibroblasts (HMFs) and dissociated 231 breast cancer cells, we showed that HMFs remodeled the collagen network to differing extents dependent on starting matrix microstructures in each hydrogel. The remodeled collagen matrix showed aligned collagen fibers perpendicular to the surface of a spheroid with migrating HMFs following these fibers as occurs in tumors in vivo. To our knowledge, this is the first study showing significant different fibrillar collagen microstructures with constant collagen density and gel stiffness. This study establishes a new type of nanocomposite 3D hydrogels for studies of biophysical and cellular interactions in engineered tumor environments.
Acknowledgements
This work was supported by United States National Institutes of Health grants R01CA196018 and U01CA210152. We thank the University of Michigan Biointerfaces Institute for use of facilities.
Footnotes
Publisher's Disclaimer: This is a PDF file of an unedited manuscript that has been accepted for publication. As a service to our customers we are providing this early version of the manuscript. The manuscript will undergo copyediting, typesetting, and review of the resulting proof before it is published in its final citable form. Please note that during the production process errors may be discovered which could affect the content, and all legal disclaimers that apply to the journal pertain.
References
- [1].Li T, Sun L, Miller N, Nicklee T, Woo J, Hulse-Smith L, Tsao M-S, Khokha R, Martin L, Boyd N, The Association of Measured Breast Tissue Characteristics with Mammographic Density and Other Risk Factors for Breast Cancer, Cancer Epidemiology Biomarkers & Prevention 14(2) (2005) 343. [DOI] [PubMed] [Google Scholar]
- [2].Conklin MW, Eickhoff JC, Riching KM, Pehlke CA, Eliceiri KW, Provenzano PP, Friedl A, Keely PJ, Aligned Collagen Is a Prognostic Signature for Survival in Human Breast Carcinoma, The American Journal of Pathology 178(3) (2011) 1221–1232. [DOI] [PMC free article] [PubMed] [Google Scholar]
- [3].Guzman A, Ziperstein MJ, Kaufman LJ, The effect of fibrillar matrix architecture on tumor cell invasion of physically challenging environments, Biomaterials 35(25) (2014) 6954–6963. [DOI] [PubMed] [Google Scholar]
- [4].Han W, Chen S, Yuan W, Fan Q, Tian J, Wang X, Chen L, Zhang X, Wei W, Liu R, Qu J, Jiao Y, Austin RH, Liu L, Oriented collagen fibers direct tumor cell intravasation, Proceedings of the National Academy of Sciences 113(40) (2016) 11208. [DOI] [PMC free article] [PubMed] [Google Scholar]
- [5].Zhou ZH, Ji CD, Xiao HL, Zhao HB, Cui YH, Bian XW, Reorganized Collagen in the Tumor Microenvironment of Gastric Cancer and Its Association with Prognosis, J Cancer 8(8) (2017) 1466–1476. [DOI] [PMC free article] [PubMed] [Google Scholar]
- [6].Puls TJ, Tan X, Whittington CF, Voytik-Harbin SL, 3D collagen fibrillar microstructure guides pancreatic cancer cell phenotype and serves as a critical design parameter for phenotypic models of EMT, Plos One 12(11) (2017) e0188870. [DOI] [PMC free article] [PubMed] [Google Scholar]
- [7].Carey SP, Martin KE, Reinhart-King CA, Three-dimensional collagen matrix induces a mechanosensitive invasive epithelial phenotype, Scientific Reports 7 (2017) 42088. [DOI] [PMC free article] [PubMed] [Google Scholar]
- [8].Provenzano PP, Inman DR, Eliceiri KW, Knittel JG, Yan L, Rueden CT, White JG, Keely PJ, Collagen density promotes mammary tumor initiation and progression, BMC Medicine 6(1) (2008) 11. [DOI] [PMC free article] [PubMed] [Google Scholar]
- [9].Grossman M, Ben-Chetrit N, Zhuravlev A, Afik R, Bassat E, Solomonov I, Yarden Y, Sagi I, Tumor Cell Invasion Can Be Blocked by Modulators of Collagen Fibril Alignment That Control Assembly of the Extracellular Matrix, Cancer Research 76(14) (2016) 4249. [DOI] [PubMed] [Google Scholar]
- [10].Harisi R, Jeney A, Extracellular matrix as target for antitumor therapy, Oncotargets Ther 8 (2015) 1387–1398. [DOI] [PMC free article] [PubMed] [Google Scholar]
- [11].Lu P, Weaver VM, Werb Z, The extracellular matrix: A dynamic niche in cancer progression, The Journal of Cell Biology 196(4) (2012) 395. [DOI] [PMC free article] [PubMed] [Google Scholar]
- [12].Liao Z, Tan ZW, Zhu P, Tan NS, Cancer-associated fibroblasts in tumor microenvironment – Accomplices in tumor malignancy, Cellular Immunology (2018). [DOI] [PubMed] [Google Scholar]
- [13].Erdogan B, Ao M, White LM, Means AL, Brewer BM, Yang L, Washington MK, Shi C, Franco OE, Weaver AM, Hayward SW, Li D, Webb DJ, Cancer-associated fibroblasts promote directional cancer cell migration by aligning fibronectin, The Journal of Cell Biology (2017). [DOI] [PMC free article] [PubMed] [Google Scholar]
- [14].Fullár A, Dudás J, Oláh L, Hollósi P, Papp Z, Sobel G, Karászi K, Paku S, Baghy K, Kovalszky I, Remodeling of extracellular matrix by normal and tumor-associated fibroblasts promotes cervical cancer progression, BMC Cancer 15(1) (2015) 256. [DOI] [PMC free article] [PubMed] [Google Scholar]
- [15].Liu C, Lewin Mejia D, Chiang B, Luker KE, Luker GD, Hybrid collagen alginate hydrogel as a platform for 3D tumor spheroid invasion, Acta Biomaterialia 75 (2018) 213–225. [DOI] [PMC free article] [PubMed] [Google Scholar]
- [16].Gaharwar Akhilesh K, Peppas Nicholas A, Khademhosseini A, Nanocomposite hydrogels for biomedical applications, Biotechnology and Bioengineering 111(3) (2013) 441–453. [DOI] [PMC free article] [PubMed] [Google Scholar]
- [17].Kuo S-W, Chang F-C, POSS related polymer nanocomposites, Progress in Polymer Science 36(12) (2011) 1649–1696. [Google Scholar]
- [18].Kannan RY, Salacinski HJ, Butler PE, Seifalian AM, Polyhedral Oligomeric Silsesquioxane Nanocomposites: The Next Generation Material for Biomedical Applications, Accounts of Chemical Research 38(11) (2005) 879–884. [DOI] [PubMed] [Google Scholar]
- [19].Crowley C, Klanrit P, Butler CR, Varanou A, Platé M, Hynds RE, Chambers RC, Seifalian AM, Birchall MA, Janes SM, Surface modification of a POSS-nanocomposite material to enhance cellular integration of a synthetic bioscaffold, Biomaterials 83(Supplement C) (2016) 283–293. [DOI] [PMC free article] [PubMed] [Google Scholar]
- [20].Song JW, Cavnar SP, Walker AC, Luker KE, Gupta M, Tung Y-C, Luker GD, Takayama S, Microfluidic Endothelium for Studying the Intravascular Adhesion of Metastatic Breast Cancer Cells, Plos One 4(6) (2009) e5756. [DOI] [PMC free article] [PubMed] [Google Scholar]
- [21].Cavnar SP, Ray P, Moudgil P, Chang SL, Luker KE, Linderman JJ, Takayama S, Luker GD, Microfluidic source-sink model reveals effects of biophysically distinct CXCL12-isoforms in breast cancer chemotaxis, Integrative biology : quantitative biosciences from nano to macro 6(5) (2014) 564–576. [DOI] [PMC free article] [PubMed] [Google Scholar]
- [22].Luker KE, Lewin SA, Mihalko LA, Schmidt BT, Winkler JS, Coggins NL, Thomas DG, Luker GD, Scavenging of CXCL12 by CXCR7 Promotes Tumor Growth and Metastasis of CXCR4-positive Breast Cancer Cells, Oncogene 31(45) (2012) 4750–4758. [DOI] [PMC free article] [PubMed] [Google Scholar]
- [23].Cavnar SP, Rickelmann AD, Meguiar KF, Xiao A, Dosch J, Leung BM, Cai Lesher-Perez S, Chitta S, Luker KE, Takayama S, Luker GD, Modeling Selective Elimination of Quiescent Cancer Cells from Bone Marrow, Neoplasia 17(8) (2015) 625–633. [DOI] [PMC free article] [PubMed] [Google Scholar]
- [24].Ray P, Stacer AC, Fenner J, Cavnar SP, Meguiar K, Brown M, Luker KE, Luker GD, CXCL12-γ in primary tumors drives breast cancer metastasis, Oncogene 34 (2014) 2043. [DOI] [PMC free article] [PubMed] [Google Scholar]
- [25].Oyen ML, Mechanical characterisation of hydrogel materials, International Materials Reviews 59(1) (2014) 44–59. [Google Scholar]
- [26].Urciuolo F, Imparato G, Netti PA, Effect of dynamic loading on solute transport in soft gels implication for drug delivery, AIChE Journal 54(3) (2008) 824–834. [Google Scholar]
- [27].Feher FJ, Newman DA, Walzer JF, Silsesquioxanes as models for silica surfaces, Journal of the American Chemical Society 111(5) (1989) 1741–1748. [Google Scholar]
- [28].Gravel MC, Zhang C, Dinderman M, Laine RM, Octa(3-chloroammoniumpropyl) octasilsesquioxane, Applied Organometallic Chemistry 13(4) (1999) 329–336. [Google Scholar]
- [29].Bai H, Zheng Y, Li P, Zhang A, Synthesis of liquid-like trisilanol isobutyl-POSS NOHM and its application in capturing CO2, Chemical Research in Chinese Universities 31(3) (2015) 484–488. [Google Scholar]
- [30].Wang DK, Varanasi S, Strounina E, Hill DJT, Symons AL, Whittaker AK, Rasoul F, Synthesis and Characterization of a POSS-PEG Macromonomer and POSS-PEG-PLA Hydrogels for Periodontal Applications, Biomacromolecules 15(2) (2014) 666–679. [DOI] [PubMed] [Google Scholar]
- [31].Wang D, Fredericks PM, Haddad A, Hill DJT, Rasoul F, Whittaker AK, Hydrolytic degradation of POSS–PEG–lactide hybrid hydrogels, Polym Degrad Stabil 96(1) (2011) 123–130. [Google Scholar]
- [32].Munoz-Pinto DJ, Jimenez-Vergara AC, Gharat T, Hahn MS, Characterization of Sequential Collagen-Poly(ethylene glycol) Diacrylat Interpenetrating Networks and Initial Assessment of their Potential for Vascular Tissue Engineering, Biomaterials 40 (2015) 32–42. [DOI] [PMC free article] [PubMed] [Google Scholar]
- [33].Beysens D, Forgács G, Dynamical networks in physics and biology : at the frontier of physics and biology, Les Houches Workshop, March 17–21, 1997, Springer;EDP Sciences, Berlin; New York Les Ulis; Cambridge, Mass, 1998. [Google Scholar]
- [34].Jones JL, Marques CM, Rigid Polymer Network Models, J Phys-Paris 51(11) (1990) 1113–1127. [Google Scholar]
- [35].Pavlov AS, Khalatur PG, Filler reinforcement in cross-linked elastomer nanocomposites: insights from fully atomistic molecular dynamics simulation, Soft Matter 12(24) (2016) 5402–5419. [DOI] [PubMed] [Google Scholar]
- [36].Gopal S, Veracini L, Grall D, Butori C, Schaub S, Audebert S, Camoin L, Baudelet E, Radwanska A, Beghelli-de la Forest Divonne S, Violette SM, Weinreb PH, Rekima S, Ilie M, Sudaka A, Hofman P, Van Obberghen-Schilling E, Fibronectin-guided migration of carcinoma collectives, Nature Communications 8 (2017) 14105. [DOI] [PMC free article] [PubMed] [Google Scholar]
- [37].Erdogan B, Ao M, White LM, Means AL, Brewer BM, Yang L, Washington MK, Shi C, Franco OE, Weaver AM, Hayward SW, Li D, Webb DJ, Cancer-associated fibroblasts promote directional cancer cell migration by aligning fibronectin, The Journal of Cell Biology 216(11) (2017) 3799. [DOI] [PMC free article] [PubMed] [Google Scholar]
Associated Data
This section collects any data citations, data availability statements, or supplementary materials included in this article.