

Abstract
The pulse waveform and current direction of transcranial magnetic stimulation (TMS) influence its interactions with the neural substrate; however, their role in the efficacy and reliability of single- and paired-pulse TMS measures is not fully understood. We investigated how pulse waveform and current direction affect the efficacy and test-retest reliability of navigated, single- and paired-pulse TMS measures. 23 healthy adults (aged 18–35 years) completed two identical TMS sessions, assessing resting motor threshold (RMT), motor evoked potentials (MEPs), cortical silent period (cSP), short- and long-interval intra-cortical inhibition (SICI and LICI), and intracortical facilitation (ICF) using either monophasic posterior-anterior (monoPA; n=9), monophasic anterior-posterior (monoAP; n=7), or biphasic (biAP-PA; n=7) pulses. Averages of each TMS measure were compared across the three groups and intraclass correlation coefficients were calculated to assess test-retest reliability. RMT was the lowest and cSP was the longest with biAP-PA pulses, whereas MEP latency was the shortest with monoPA pulses. SICI and LICI had the largest effect with monoPA pulses, whereas only monoAP and biAP-PA pulses resulted in significant ICF. MEP amplitude was more reliable with either monoPA or monoAP than with biAP-PA pulses. LICI was the most reliable with monoAP pulses, whereas ICF was the most reliable with biAP-PA pulses. Waveform/current direction influenced RMT, MEP latency, cSP, SICI, LICI, and ICF, as well as the reliability of MEP amplitude, LICI, and ICF. These results show the importance of considering TMS pulse parameters for optimizing the efficacy and reliability of TMS neurophysiologic measures.
Keywords: transcranial magnetic stimulation, current direction, monophasic waveform, biphasic waveform, paired-pulse, reliability
Introduction
The use of transcranial magnetic stimulation (TMS) in basic and clinical neuroscience has grown substantially over the past 30 years. Although TMS is commonly employed nowadays in laboratories and clinics across the world as a research, diagnostic, or therapeutic tool, the underlying mechanisms of TMS are not yet fully understood, in particular, how the TMS pulse interacts with the neural substrate, and how different pulse parameters influence the efficacy and reliability of TMS measures. A deeper understanding of these issues is crucial for assessing the utility of TMS measures as possible neurophysiologic biomarkers in health and disease.
TMS is a form of noninvasive brain stimulation via electromagnetic induction (Barker et al., 1985). Each TMS pulse consists of an electric pulse sent rapidly through the wiring of a coil. The rapid change in the electric current induces a change in the magnetic field perpendicular to the plane of the coil. The rapid fluctuation in the magnetic field in turn induces a current in the brain that is parallel to the coil but in the opposite direction of the original current (Hallett, 2007). When applied over the primary motor cortex, the induced current can lead to activation of the corticospinal pathway and produce a muscle response, or motor evoked potential (MEP), contralateral to the site of stimulation. The seemingly straightforward account of the mechanisms of TMS belies the complex interplay between the pulse parameters and the dynamic properties of each individual’s brain where the electrical current is induced. Some of the main factors known to influence this current-brain interaction include TMS pulse parameters such as waveform and the direction of the induced current in the brain (Di Lazzaro et al., 2001a, 2003, 2011; Di Lazzaro and Rothwell, 2014), individual differences in optimal current direction (Balslev et al., 2007) and pattern of cortical sulcation (Silva et al., 2008; Salvador et al., 2011), coil-cortex distance (Kozel et al., 2000; McConnell et al., 2001; Stokes et al., 2013), and state-dependent factors (Silvanto et al., 2007; Ridding and Ziemann, 2010).
The full effects of parameters such as pulse waveform and current direction have not been adequately studied, despite clear evidence of their importance in shaping the outcome of TMS (Mills et al., 1992; Sakai et al., 1997; Kammer et al., 2001). Most TMS stimulators generate pulse waveforms that are either biphasic or monophasic (although other shapes such as half-sine and square-wave pulses are also available on some machines). These two common types of waveforms can be distinguished based on the length and duration of the first and second phases of the pulse waveform. For example, biphasic pulses tend to have two equal phases with opposite polarities, whereas monophasic pulses have a shorter, rapid first phase and a longer, slow second phase. In addition to the pulse shape, the direction of the induced current in the brain is determined by the coil shape (e.g., circular or figure-8), the direction of the current through the coil windings (e.g., posterior-to-anterior or anterior-to-posterior at the center of a figure-8 coil), the orientation of the coil relative to the stimulated cortex (e.g., perpendicular to the motor cortex), and sulcal geometry (Salvador et al., 2011).
Previous studies suggest that specific waveforms and current directions preferentially stimulate different neural components in different cortical layers. These studies are based on invasive epidural recordings of the efferent corticospinal neurons (Di Lazzaro et al., 2001a, 2003, 2011; Di Lazzaro and Rothwell, 2014). A corticospinal volley elicited by TMS can be composed of a D-wave and/or one or more I-waves, which are produced by direct and indirect (likely via presynaptic interneurons) activation, respectively, of layer-V pyramidal tract neurons (PTNs) (Amassian et al., 1989, 1990; Thompson et al., 1991; Burke et al., 1993). Based on these studies, different theoretical cortical models have been proposed to explain the current-brain interactions (Ziemann and Rothwell, 2000; Di Lazzaro and Rothwell, 2014; Rusu et al., 2014).
A given TMS protocol can be assessed in terms of its efficacy (will the protocol produce the expected outcome?) and consistency (is the effect reproducible in the same subjects on different occasions?). Both of these questions are especially relevant as TMS-based neurophysiological measures are increasingly explored for their diagnostic and prognostic potential. While several studies have examined the effects of waveform and current directions on TMS measures (Mills et al., 1992; Sakai et al., 1997; Niehaus et al., 2000; Kammer et al., 2001; Orth and Rothwell, 2004; Takahashi et al., 2005; Sommer et al., 2006, 2013; Ni et al., 2011; Delvendahl et al., 2014a, 2014b; D’Ostilio et al., 2016; Stephani et al., 2016), none have investigated the influence of these parameters on both the efficacy and test-retest reliability of common single and paired-pulse TMS protocols. The present study aims to fill this important gap through a direct comparison of the most common single- and paired-pulse TMS measures obtained with three widely used pulse configurations from healthy adults over the course of two sessions.
Experimental procedures
Participants
Twenty-six healthy adults (aged 18–35 years, 14 females, 22 right-handed as determined by the Edinburgh Handedness Inventory; Oldfield, 1971) participated in the study that was approved by the local Institutional Review Board in accordance with the Declaration of Helsinki. All participants provided written informed consent prior to enrollment and received monetary compensation upon completion.
Participants completed two identical TMS sessions (intersession interval range 1–70 days; median = 10.5 days). Participants were randomly separated into three groups based on the waveform and direction of current induced in the motor cortex (Figure 1): ten received monophasic posterior-anterior (monoPA), nine received monophasic anterior-posterior (monoAP), and seven received biphasic with an anterior-posterior initial phase (biAP-PA). Three participants completed all experiments but were subsequently excluded from all analyses: one from the monoPA condition was excluded because of a prior history of traumatic brain injury that was not disclosed during enrollment screening. Two from the monoAP condition were excluded because their resting motor thresholds (RMTs) were higher than 83% of maximum stimulator output (MSO), which precluded stimulation at 120% of RMT. The remaining cohort was comprised of 23 participants (9 monoPA, 7 monoAP, 7 biAP-PA), participants had normal physical and neurological examinations, and had no history of medical disease or TMS contraindication. Participants’ demographics are presented in Table 1.
Figure 1. TMS pulse waveforms and induced current directions used in the study.
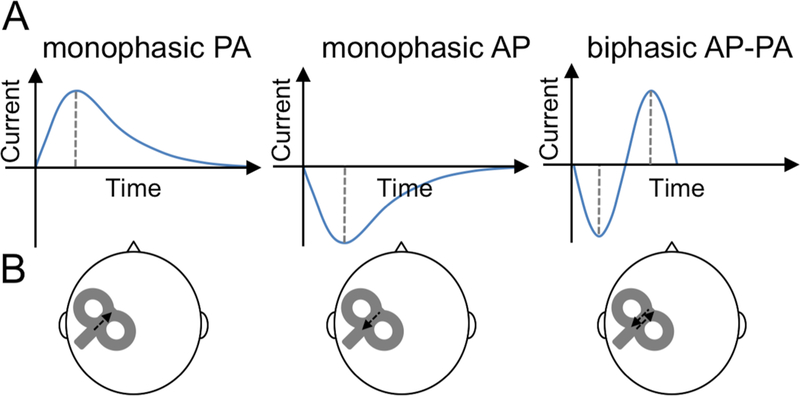
A. Diagram showing monophasic posterior-anterior (PA), monophasic anterior-posterior (AP), and biphasic AP-PA TMS pulse waveforms. B. Diagram showing location of the TMS coil over the left primary motor cortex with arrows depiction the direction of the induced current(s) in the brain.
Table 1.
Participant characteristics
| Participant | Waveform/ Current direction | Gender | Handedness | Medications | Days between visits | Start-time difference (h) |
|---|---|---|---|---|---|---|
| 1 | biAP-PA | Male | Right | – | 1 | 0.5 |
| 2 | biAP-PA | Female | Right | birth control | 25 | 0.5 |
| 3 | biAP-PA | Male | Right | – | 1 | 1 |
| 4 | biAP-PA | Female | Right | – | 5 | 3 |
| 5 | biAP-PA | Male | Right | – | 7 | 0 |
| 6 | biAP-PA | Male | Left | – | 7 | 0 |
| 7 | biAP-PA | Male | Right | – | 5 | 0 |
| 8 | monoAP | Female | Right | birth control | 36 | 0 |
| 9 | monoAP | Male | Right | – | 5 | 1 |
| 10 | monoAP | Female | Right | – | 24 | 5 |
| 11 | monoAP | Female | Right | birth control | 11 | 2 |
| 12 | monoAP | Female | Left | birth control, cetirizine hydrochloride | 36 | 2 |
| 13 | monoAP | Female | Right | birth control, vitamins | 70 | 0.5 |
| 14 | monoAP | Female | Right | – | 13 | 0 |
| 15 | monoPA | Male | Right | – | 16 | 4.5 |
| 16 | monoPA | Female | Right | birth control | 16 | 0 |
| 17 | monoPA | Male | Right | vitamins | 11 | 1 |
| 18 | monoPA | Female | Right | birth control | 4 | 0 |
| 19 | monoPA | Female | Right | birth control | 7 | 0 |
| 20 | monoPA | Male | Left | – | 10 | 0.25 |
| 21 | monoPA | Female | Right | – | 12 | 5 |
| 22 | monoPA | Female | Right | birth control | 14 | 3 |
| 23 | monoPA | Male | Left | cetirizine hydrochloride | 9 | 2 |
Abbreviations: biAP-PA, biphasic anterior-posterior—posterior-anterior; monoAP, monophasic anterior-posterior; monoPA, monophasic posterior-anterior.
For comparison with the present cohort of young adults, reliability data on RMT, baseline MEP amplitude, and paired-pulse protocols with monoPA and biAP-PA pulses were obtained on 12 older adults (six females) between aged 51–77 from a previous study (see Fried et al., 2017 for full details).
Electromyography
Surface electromyogram (EMG) was recorded from the dominant hand’s first dorsal interosseous (FDI) with a PowerLab 4/25T data-acquisition device and Scope software (AD Instruments, Colorado Springs, CO, USA). Electrodes were placed over the FDI belly (negative) and the first interphalangeal joint of the second finger (positive). The ground electrode was placed over the ipsilateral ulnar styloid process. EMG was digitized at 1kHz and amplified with a range of ±10mV (band-pass filter 0.3–1000Hz). Participants were monitored for drowsiness and were asked to keep their eyes open throughout the experiment.
Transcranial Magnetic Stimulation
TMS was performed by one of three experienced TMS technicians (the same technician performed both visits for a given subject). Participants were seated comfortably in a chair with their arms resting in a natural ~90º angle on a table in front of them. TMS was performed with a MagPro X100 device (MagVenture A/S, Denmark) using a Cool-B65 figure-of-eight coil (outer diameter 75mm) hand-held over the motor cortex in the dominant hemisphere with the handle pointing backwards at a ~45º angle. A Polaris infrared-optical tracking system (Northern Digital Inc., Waterloo, ON, Canada) and Brainsight (Rogue Research, Inc., Montreal, QC, Canada) with a brain MRI template were used to maintain consistent targeting within sessions.
Each session began by assessing the motor “hotspot” and RMT. The hotspot was identified de novo at each visit as the optimal stimulation site for the motor cortex. The RMT (% MSO), was defined following the International Federation of Clinical Neurophysiology guidelines (Rossi et al., 2009; Rossini et al., 2015) as the lowest intensity that elicited an MEP ≥ 50µV in at least 50% of trials.
TMS measures were then acquired in the following order: (1) Baseline (unconditioned) cortico-motor reactivity was assessed by applying 10 single pulses at rest at 120% of RMT. The average peak-to-peak amplitude (Baseline MEP amplitude) and the average time from the TMS pulse until the onset of the MEP (MEP latency) were measured. (2) The cSP was assessed by applying ten single pulses at 120% of RMT during isometric FDI contraction at ~25% of maximum strength. Live EMG was monitored for muscle contraction throughout cSP measurements and recorded in 5-s epochs and participants could rest for a few seconds between pulses. The cSP duration was measured in ms from non-rectified signal from MEP onset to the resumption of pre-TMS EMG activity (Orth and Rothwell, 2004), and averaged over 10 trials. (3) Paired-pulse protocols included short-interval intra-cortical inhibition (SICI), long-interval intra-cortical inhibition (LICI), and intracortical facilitation (ICF) (Kujirai et al., 1993; Valls-Solé et al., 1992). 40 pulses per protocol (120 trials total) were administered in a pseudorandom, interleaved order to reduce blocking effects and at a pseudo-randomized inter-trial interval (4–6s) to minimize expectation and avoid hysteresis. SICI and ICF consisted of a conditioning stimulus (CS) at 80% of RMT, a test stimulus (TS) at 120% of RMT and an inter-stimulus interval (ISI) of 3 and 12ms, respectively. In LICI, CS and TS were 120% of RMT separated by a 100ms ISI. The amplitude of the conditioned MEP for each protocol was averaged across 40 trials and expressed as a percent change from baseline MEP amplitude (%∆ SICI, %∆ ICF, %∆ LICI). For each TMS measure (except RMT), individual data points > 2.5 SD from the mean were excluded.
Comparative data from older adults included RMT and MEP amplitude with monoPA and biAP-PA and paired-pulse protocols using monoPA, performed with Nexstim (Nexstim Plc, Finland). For full details, see (Fried et al., 2017).
Statistical Analyses
Analyses were performed in MATLAB and Statistics and Machine Learning Toolbox Release 2015b (The MathWorks, Inc., Natick, MA, USA) and Stata version 13.1 (StataCorp, College Station, TX, USA) using a two-tailed 95% confidence interval (α=0.05). TMS measures were calculated for each waveform/current direction (monoPA, monoAP, biAP-PA), hereafter referred to as Waveform.
Shapiro–Wilk tests indicated deviations from normality for MEP amplitude, %∆ SICI, %∆ ICF, and %∆ LICI (p’s < 0.05), but not RMT, cSP, and MEP latency did not (p’s > 0.74). Levene’s tests indicated significant heteroscedasticity for %∆ SICI, %∆ ICF, and %∆ LICI (p’s < 0.05), but not for RMT, baseline MEP amplitude, cSP, or MEP latency (p’s > 0.15). To conform to the assumptions of our parametric statistical tests, baseline MEP amplitude, %∆ SICI, %∆ ICF, and %∆ LICI were transformed as described previously (van Albada and Robinson, 2007). After transformation, only %∆ LICI remained non-normal (p < 0.01) and was analyzed using non-parametric tests. There was no significant heteroscedasticity among the three Waveforms for %∆ SICI, %∆ LICI, or %∆ ICF after transformation (p’s > 0.17).
Data were analyzed in terms of efficacy [1] and reliability [2] and their relationship to RMT [3] using the following approaches:
Magnitude of TMS measures across waveforms and visits
TMS measures were entered as dependent variables into separate mixed-effects ANOVAs (me-ANOVAs) with Waveform as a between-subjects factor and Visit (Visit-A, Visit-B) as a within-subject factor. For MEP latency, Shapiro–Wilk tests indicated the residuals were not normally distributed (p < 0.05), so the ANOVA was rerun after transforming the data in the manner indicated above. For %∆ LICI, the residuals for the transformed values were still found to be non-normal so a non-parametric two-level, mixed-effects ordered logistic regression (me-OLR; with subjects nested in Waveform) was used instead. Pairwise comparisons of TMS measures between waveforms were conducted using the Tukey’s honestly significant difference (HSD) test.
To control for the effect of potential confounding variables, we added Gender, Inter-Visit Interval (in days), or Time Difference (in minutes) between the starting times of the two visits (one at a time) as a covariate to the above models with the transformed values of TMS measures as dependent variable.
Efficacy of paired-pulse measures across waveforms and visits
Average MEP amplitudes for each paired pulse conditioned were entered into separate me-OLRs for each waveform, with MEP amplitude as dependent variable, MEP Type (conditioned vs. unconditioned) as independent variable and Visit as a within-subject factor.
Reliability of single- and paired-pulse TMS measures across waveforms
Intraclass correlation coefficients (ICCs) were calculated for all TMS measures for each waveform using the ICC(A,1) formula (McGraw and Wong, 1996). Following Portney and Watkins (Portney and Watkins, 2009), ICC values were interpreted as high (ICC ≥ 0.75), moderate (0.50 ≤ ICC < 0.75), low (0.25 ≤ ICC < 0.50) or very low to none (ICC < 0.25). ICCs were compared across Waveform using mixed-effects F-statistics (McGraw and Wong, 1996). The effects of Gender, Inter-Visit Interval, or Time Difference on all the ICCs were assessed by including the covariate of interest in the corresponding mixed-effects regression model and recalculating the residual intraclass correlation.
Reliability of TMS measures in young and older adults
Data on RMT (monoPA, biAP-PA), baseline MEP (monoPA, biAP-PA), and SICI, LICI, ICF (monoPA) were compared between the current cohort and a previously acquired cohort of older adults using mixed-effects F-statistics.
Relationship between RMT and other TMS measures
Each TMS measure was entered into a separate mixed-effects linear regressions with RMT as a predictor, Waveform as a between-subjects factor, Visit as a within-subject factor, and Waveform-x-Visit interaction. All linear regression analyses were conducted using the transformed values for the TMS measures. For each regression analysis, we checked the bivariate normality between RMT and the other TMS measure using the Doornik-Hansen test. There was no significant deviation from bivariate normality in any of the regression models (p’s > 0.19).
Results
Magnitude of TMS measures across waveforms and visits
The effects of the TMS measurements in each condition are presented in Figure 2. The results of me-ANOVAs on TMS measures are detailed in Table 2. There was a significant overall effect of Waveform on RMT (F2,20 = 9.28, p = 0.001, η2p = 0.48). Tukey’s HSD test indicated RMT was significantly higher with monoAP than with either monoPA (t14 = 13.99, p < 0.05) or biAP-PA (t12 = 11.98, p < 0.05). Furthermore, RMT was significantly higher with monoPA than biAP-PA (t14 = 25.98, p < 0.05). MEP latency was significantly shorter with monoPA than with either biAP-PA (t14 = 8.05, p < 0.05) or monoAP (t14 = 11.52, p < 0.05). The cSP was significantly shorter with monoPA than with biAP-PA (t14 = 3.64, p < 0.05). None of the other pairwise differences in single-pulse TMS measures between the waveforms were significant (p’s > 0.05).
Figure 2: Effects of waveform and current direction on TMS measures.
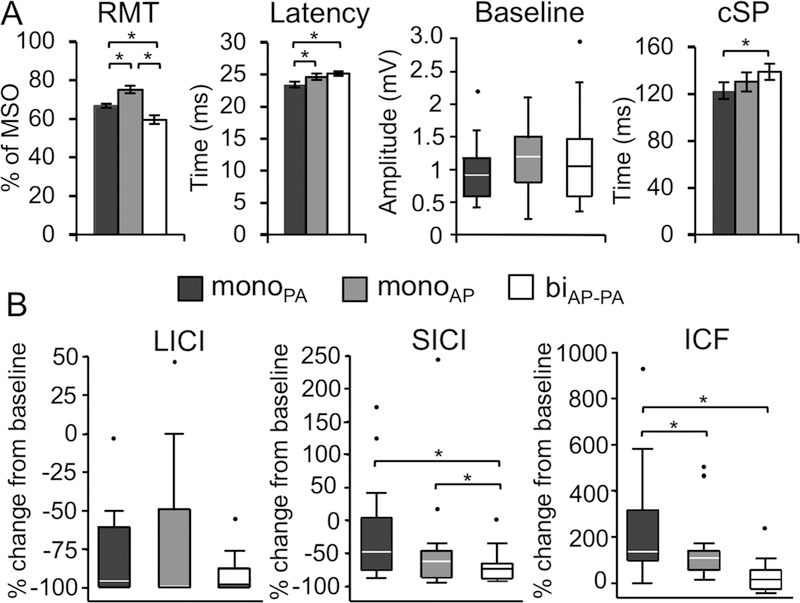
Mean and standard error are shown for RMT, MEP latency, and cSP. Baseline MEP, LICI, SICI, and ICF values deviated from normality and homoscedasticity, and, therefore, are depicted by their medians and 25–75 percentiles in box plots. The upper whisker in each box plot represents the 75 percentile plus 1.5 times the interquartile range, whereas the lower whisker represents the 25 percentile minus 1.5 times the interquartile range. Values that fell outside that range are marked by individual data points. Results from Tukey’s HSD pairwise comparisons (* p < 0.05) after mixed-effects ANOVAs between waveforms and current directions for each TMS measure. Baseline MEP amplitude, LICI, SICI, and ICF were transformed to achieve normal distributions prior to analysis (see text for details).
(A) RMT was significantly different between all waveforms and current directions. MonoPA elicited significantly longer MEP latencies than in both the biAP-PA condition and the monoAP condition and significantly shorter cSP durations than biAP-PA. (B) In paired-pulse protocols, the monoPA condition yielded to significantly greater inhibition after LICI and shorter facilitation than the other two waveforms. SICI after monoPA led to significantly smaller MEPs than biAP-PA. Abbreviations: biAP-PA, biphasic anterior-to-posterior—posterior-to-anterior; cSP, cortical silent period; ICF, intracortical facilitation; LICI, long-interval intracortical inhibition; monoAP, monophasic anterior-to-posterior; monoPA, monophasic posterior-to-anterior; MSO, maximal stimulator output; RMT, resting motor threshold; SICI, short-interval intracortical inhibition.
Table 2.
Results of mixed-effect ANOVAs.
| Model | Waveform | Visit | Waveform x Visit | Shapiro–Wilk test for normality of residuals | Tukey’s HSD pairwise comparisons | ||||||||||
|---|---|---|---|---|---|---|---|---|---|---|---|---|---|---|---|
| F(25,20) | p | adjusted-R2 | F(2,20) | p | η2p | F(1,20) | p | η2p | F(2,20) | p | η2p | z | p | ||
| RMT (% MSO) | 26.06 | < 0.001 | 0.93 | 9.28 | 0.001 | 0.48 | 0.01 | 0.981 | < 0.01 | 0.02 | 0.980 | < 0.01 | –0.60 | 0.727 | biAP-PA < monoPA < monoAP |
| baseline MEP latency* | 12.33 | < 0.001 | 0.86 | 2.27 | 0.129 | 0.19 | 0.10 | 0.751 | < 0.01 | 0.20 | 0.818 | 0.02 | 0.27 | 0.395 | monoPA < monoAP, biAP-PA |
| baseline MEP amplitude* | 2.25 | 0.035 | 0.41 | 0.07 | 0.930 | 0.01 | 0.06 | 0.802 | < 0.01 | 0.14 | 0.869 | 0.01 | 0.68 | 0.247 | n.s. |
| cSP | 4.46 | < 0.001 | 0.66 | 0.66 | 0.527 | 0.06 | < 0.01 | 0.989 | < 0.01 | 0.02 | 0.979 | < 0.01 | -1.40 | 0.919 | monoPA < biAP-PA |
| %∆ LICI* | 6.76 | < 0.001 | 0.76 | 0.33 | 0.724 | 0.03 | 0.16 | 0.696 | 0.01 | 0.03 | 0.972 | < 0.01 | 1.87 | 0.031 | n.s. |
| %∆ SICI* | 5.21 | < 0.001 | 0.70 | 1.66 | 0.215 | 0.14 | 0.08 | 0.781 | < 0.01 | 0.48 | 0.627 | 0.05 | 0.82 | 0.207 | biAP-PA < monoPA, monoAP |
| %∆ ICF* | 4.29 | < 0.001 | 0.65 | 10.23 | < 0.001 | 0.51 | 0.23 | 0.634 | 0.01 | 1.52 | 0.242 | 0.13 | –1.65 | 0.950 | monoPA < monoAP, biAP-PA |
Variables marked by were transformed prior to analysis (see text for details). Abbreviations: biAP-PA, biphasic anterior-posterior—posterior-anterior; cSP, cortical silent period; ICF, intracortical facilitation; LICI, long-interval intracortical inhibition; MEP, motor evoked potentials; monoAP, monophasic anterior-posterior; monoPA, monophasic posterior-anterior; MSO, maximal stimulator output; n.s., no significant differences; RMT, resting motor threshold; SICI, short-interval intracortical inhibition; %∆, percentage change from baseline; η2p, partial eta squared.
After controlling for the effect of potential confounding variables, including Gender, Inter-Visit Interval, or Time Difference, on the transformed single-pulse TMS measures, the only observed significant association was between MEP latency and Gender, which was a significant predictor (F1,20 = 6.72, p = 0.02, η2p = 0.26). Controlling for Gender, the pairwise differences in MEP latency between monoPA and either monoAP (t14 = 6.88, p < 0.05) or biAP-PA (t14 = 9.79, p < 0.05), remained significant. No comparisons of any other single-pulse TMS measure was significantly influenced by Gender, Inter-Visit Interval, or Time Difference (p’s > 0.10).
For paired-pulse measures, the transformed values of %∆ SICI, %∆ LICI, and %∆ ICF were entered into separate me-ANOVAs, as described above. The results (Table 2) showed a significant effect of Waveform for %∆ ICF (F2,20 = 10.23, p < 0.001, η2p = 0.51), but not for %∆ SICI or %∆ LICI (p’s > 0.2). Specifically, ICF induced significantly less facilitation with monoPA than either biAP-PA (t14 = 9.29, p < 0.05) or monoAP (t14 = 6.85, p < 0.05). SICI induced significantly less inhibition with biAP-PA than with either monoPA (t14 = 5.79, p < 0.05) or monoAP (t12 = 3.96, p < 0.05). Because the residuals on transformed %∆ LICI values remained non-normal (p < 0.05), a me-OLR was conducted, as described above, which did not find a significant effect of Waveform (p > 0.3). There were no significant pairwise differences in other TMS measures between the waveforms (p’s > 0.05). The effects of Gender, Inter-Visit Interval, or Time Difference were not significant in any of the me-ANOVAs on paired-pulse TMS measures (p’s > 0.10) or in the me-OLR on %∆ LICI (p’s > 0.46).
Efficacy of paired-pulse measures across waveforms and visits
The me-OLRs found that SICI induced an overall significant inhibition of MEPs (z = –5.83, p < 0.001) across all waveforms and visits. Conducting the me-OLR separately for each waveform found significant inhibition with both monoPA (z = –4.81, p < 0.001) and monoAP (z = –3.52, p < 0.001), but not with biAP-PA (z = −1.53, p > 0.12). Similarly, LICI induced an overall significant inhibition of MEPs (z = –7.61, p < .001), which was observed across both visits of biAP-PA (z = –4.81, p < 0.001), monoAP (z = –3.86, p < 0.001), and monoPA (z = –4.11, p < 0.001). ICF induced a significant overall facilitation of MEPs (z = 5.39, p < 0.001). ICF induced a significant facilitation with both biAP-PA (z = 3.69, p < 0.001) and monoAP (z = 4.10, p < 0.001), across both visits, whereas there was no significant facilitation with monoPA (p > 0.31). The effect of Visit was not significant in any of the above analyses (p’s > 0.05). These results indicate that monoPA and biAP-PA may not be optimal for ICF and SICI, respectively.
Reliability of single- and paired-pulse TMS measures across waveforms
ICCs for single- and paired-pulse measures with monoPA, monoAP, and biAP-PA are presented in Figure 3A. After controlling for Gender, Inter-Visit Interval, or Time Difference, the ICCs for RMT with biAP-PA (0.73–0.91) and for LICI with biAP-PA (0.65–0.76) varied to some extent, but none of the other ICCs for single- or paired-pulse measures for any of the waveforms changed noticeably, i.e., they did not cross our pre-defined boundaries for interpreting ICC values (see Methods).
Figure 3: Reliability of TMS measures by waveform.
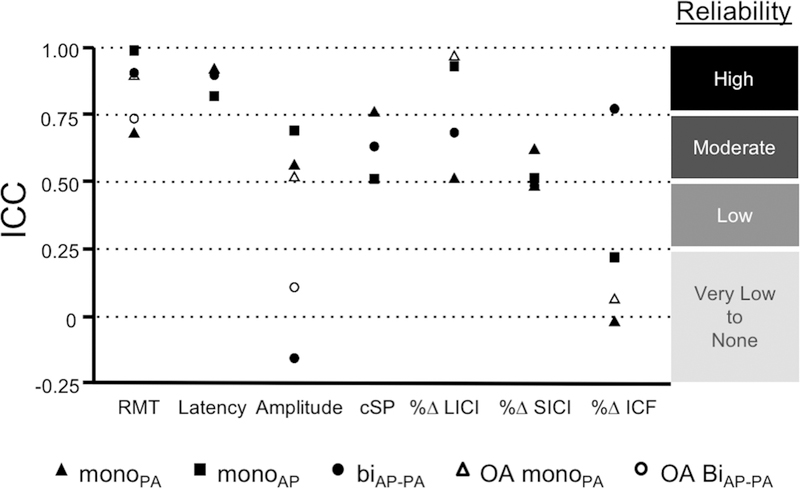
Intra-class correlation coefficients (ICCs) for the different TMS protocols performed with different waveforms and current directions in the young (ages 18 – 35) and older adults (OA, ages 51 – 77). Abbreviations: biAP-PA, biphasic anterior-to-posterior—posterior-to-anterior; cSP, cortical silent period; monoAP, monophasic anterior-to-posterior; monoPA, monophasic posterior-to-anterior; RMT, resting motor threshold; %∆ LICI, long-interval intracortical inhibition percentage of change from baseline; %∆ SICI, short-interval intracortical inhibition percentage of change from baseline; %∆ ICF, intracortical facilitation percentage of change from baseline.
Pairwise comparisons between the ICCs are detailed in Table 3. Baseline MEP amplitude was significantly more reliable when obtained with either monoPA or monoAP than with biAP-PA (p’s < 0.022). LICI was significantly more reliable with monoAP than with either monoPA or biAP-PA (p’s < 0.031). ICF was significantly more reliable with biAP-PA than either monoPA or monoAP (p’s < 0.041). Other ICCs were not significantly different between the Waveforms (p’s > 0.064).
Table 3.
Test-retest reliability of neurophysiological measures.
| visit A | visit B | ∆B-A | |∆B-A| | Intraclass correlation | p-values for ICC comparisons | |||||
|---|---|---|---|---|---|---|---|---|---|---|
| mean ± SD | mean ± SD | mean ± SD | mean ± SD | r | p | biAP-PA - monoAP | biAP-PA - monoPA | monoAP - monoPA | ||
| RMT (% MSO) | ||||||||||
| biAP-PA | 59.71 ± 9.11 | 59.14 ± 8.78 | −0.57 ± 4.20 | 3.14 ± 2.54 | 0.90 | 0.001 | 0.983 | 0.065 | 0.999 | |
| monoAP | 75.00 ± 7.05 | 75.00 ± 8.06 | 0.00 ± 1.41 | 0.86 ± 1.07 | 0.99 | <.001 | ||||
| monoPA | 66.22 ± 4.52 | 67.00 ± 4.03 | 0.78 ± 3.53 | 2.78 ± 2.11 | 0.68 | 0.016 | ||||
| baseline MEP latency (ms) | ||||||||||
| biAP-PA | 25.42 ± 1.31 | 24.85 ± 1.57 | −0.58 ± 0.41 | 0.58 ± 0.41 | 0.89 | 0.018 | 0.384 | 0.385 | 0.133 | |
| monoAP | 24.39 ± 1.79 | 24.83 ± 1.93 | 0.45 ± 1.12 | 0.97 ± 0.62 | 0.82 | 0.004 | ||||
| monoPA | 23.49 ± 1.70 | 23.30 ± 2.04 | −0.19 ± 0.81 | 0.57 ± 0.57 | 0.91 | <.001 | ||||
| baseline MEP amplitude (mV) | ||||||||||
| biAP-PA | 0.98 ± 0.60 | 1.02 ± 0.41 | 0.03 ± 0.77 | 0.56 ± 0.47 | −0.16 | 0.621 | 0.021 | 0.009 | 0.313 | |
| monoAP | 1.16 ± 0.44 | 1.19 ± 0.71 | 0.03 ± 0.49 | 0.36 ± 0.29 | 0.69 | 0.039 | ||||
| monoPA | 1.39 ± 0.97 | 0.97 ± 0.40 | −0.42 ± 0.65 | 0.61 ± 0.44 | 0.56 | 0.030 | ||||
| cSP (ms) | ||||||||||
| biAP-PA | 140.52 ± 27.80 | 137.25 ± 26.50 | −3.27 ± 21.58 | 16.39 ± 12.84 | 0.71 | 0.028 | 0.557 | 0.475 | 0.408 | |
| monoAP | 129.18 ± 22.15 | 131.34 ± 37.80 | 2.16 ± 26.08 | 17.24 ± 18.41 | 0.68 | 0.041 | ||||
| monoPA | 122.02 ± 33.80 | 123.60 ± 30.08 | 1.58 ± 24.83 | 18.77 ± 14.92 | 0.72 | 0.012 | ||||
| LICI (%∆) | ||||||||||
| biAP-PA | −77.93 ± 35.73 | −81.36 ± 22.30 | −3.43 ± 24.88 | 14.27 ± 19.87 | 0.68 | 0.038 | 0.030 | 0.776 | 0.007 | |
| monoAP | −71.35 ± 55.32 | −76.27 ± 38.10 | −4.90 ± 18.84 | 9.12 ± 16.91 | 0.93 | <.001 | ||||
| monoPA | −94.87 ± 5.62 | −89.99 ± 15.37 | 4.88 ± 11.27 | 6.00 ± 10.64 | 0.51 | 0.051 | ||||
| SICI (%∆) | ||||||||||
| biAP-PA | 1.82 ± 85.48 | −35.04 ± 75.13 | −36.86 ± 80.46 | 61.68 ± 60.18 | 0.48 | 0.088 | 0.530 | 0.290 | 0.633 | |
| monoAP | −52.35 ± 38.12 | −26.79 ± 120.19 | 25.56 ± 89.40 | 41.38 ± 82.21 | 0.51 | 0.095 | ||||
| monoPA | −73.59 ± 18.14 | −65.43 ± 29.14 | 8.16 ± 21.05 | 19.72 ± 8.96 | 0.62 | 0.021 | ||||
| ICF (%∆) | ||||||||||
| biAP-PA | 243.39 ± 177.43 | 215.64 ± 318.95 | −27.74 ± 184.07 | 127.61 ± 125.63 | 0.77 | 0.015 | 0.040 | 0.014 | 0.256 | |
| monoAP | 101.33 ± 50.44 | 191.21 ± 206.85 | 89.88 ± 186.39 | 126.47 ± 159.71 | 0.22 | 0.276 | ||||
| monoPA | 0.53 ± 35.45 | 60.70 ± 85.64 | 60.17 ± 94.08 | 87.51 ± 65.65 | −0.02 | 0.535 | ||||
Abbreviations: biAP-PA, biphasic anterior-posterior—posterior-anterior; cSP, contralateral cortical silent period; ICC, intraclass correlation coefficient; ICF, intracortical facilitation; LICI, long-interval intracortical inhibition; MEP, motor evoked potentials; monoAP, monophasic anterior-posterior; monoPA, monophasic posterior-anterior; MSO, maximal stimulator output; RMT, resting motor threshold; SICI, short-interval intracortical inhibition; %∆, percent of change from baseline. Significant values are shown in bold type.
Reliability of TMS measures in young and older adults
Figure 3B depicts the ICCs for TMS measures between the present cohort and older adults from a prior study (Fried et al., 2017). RMT and LICI with monoPA pulses were both significantly more reliable among older adults (p = 0.028 and p < 0.001, respectively). Other ICCs were not significantly different between the two cohorts (p’s > 0.060).
Relationship between RMT and other TMS measures
The exploratory mixed-effects linear regressions assessing the relationship between RMT and the transformed values of other single- and paired-pulse TMS measures across the two visits found a significant negative association between RMT and baseline MEP amplitude (z = –2.07, p = 0.04). None of the associations between RMT and other TMS measures were significant (p’s > 0.23).
Discussion
In the present work, we investigated the influence of TMS pulse waveform and induced current direction (monoPA, monoAP, and biAP-PA) on the efficacy and test-retest reliability of common single- and paired-pulse TMS measures in young healthy adults. To explore the effects of age group on the test-retest reliability of TMS measures, we also compared the reliability of monoPA and biAP-PA TMS measures between our participants and a cohort of older adults who participated in a previous study (Fried et al., 2017). Pulse waveform/current direction was observed to exert the greatest influence on RMT, MEP latency, cSP, SICI, and ICF. RMT was the highest with monoAP, followed by monoPA and biAP-PA pulses. MonoPA pulses resulted in the shortest MEP latency and the greatest SICI followed by monoAP, but the smallest ICF. There were also significant effects of waveform/current direction on test-retest reliability of baseline MEP amplitude, LICI, and ICF. MonoPA pulses resulted in a more reliable baseline MEP amplitude, but less reliable ICF, than biAP-PA pulses. In contrast, LICI was more reliable with monoAP than with monoPA pulses. RMT and LICI were significantly more reliable with monoPA pulses in the older adults than in the young who participated in the present study.
The present results can be interpreted using a framework put forth by Di Lazzaro and Rothwell (Di Lazzaro and Rothwell, 2014) following a series of experiments performed on patients with epidural electrodes implanted at the cervical spinal cord (Di Lazzaro et al., 2001a, 2001b, 2003, 2011). The authors proposed that different waveforms and current directions interact with stimulation intensity to evoke distinct patterns of D- and I-waves by selective recruitment of particular neural components of cortical layers. For example, monoPA pulses at threshold intensities elicit an early I-wave (the I1-wave), which is thought to reflect indirect monosynaptic activation of PTNs through excitatory interneurons in layers II–III. As the intensity of monoPA pulses increases, descending volleys begin to include later I-waves, which are thought to reflect polysynaptic chains of interneurons in the same layers II–III, acting on PTNs. In contrast, monoAP pulses tend to evoke late I-waves that are more dispersed and have longer latencies. These late I-waves are thought to reflect the activation of horizontal cortico-cortical connections in layers II–III that originate from surrounding regions, including premotor cortex, thalamus, and perhaps other regions. As such, monoAP currents typically result in higher motor thresholds than monoPA currents. Biphasic pulses elicit a more complex pattern of D- and I-waves and the role of their current direction (AP-PA versus PA-AP) has not been well established. One consequence of this complex relationship is that biphasic pulses at suprathreshold intensities tend to be less direction-dependent and can elicit a combination of D- and I-waves (Di Lazzaro et al., 2001a, 2001b, 2003, 2011).
The present study is the first to assess the effects of induced current direction and pulse waveform on both the efficacy and test-retest reliability of paired-pulse TMS measures, including SICI, LICI, and ICF. Epidural recordings of paired-pulse TMS protocols have only been conducted with monoPA pulses. It is thus unknown how other waveforms would influence the effects of paired-pulse protocols on descending volleys. With monoPA pulses, both SICI and LICI suppress the I2 and later waves, but not the D- or I1-waves (Di Lazzaro et al., 1998, 2002; Nakamura et al., 1996; Ni et al., 2011). In contrast, ICF does not significantly change the amplitude or number of cortico-spinal waves (Di Lazzaro et al., 2006; Ni et al., 2011), indicating that the ICF-induced facilitation might reflect the recruitment of neural circuits unrelated to those involved in the generation of I-waves elicited by monoPA. Such recruitment can result in more dispersed activity that is not reflected in epidural recordings (Di Lazzaro and Rothwell, 2014). Even though it is likely that the origin of ICF is cortical (Cash et al., 2017), a complementary theory for the neural source of ICF has been evaluated recently (Wiegel et al., 2018), suggesting that the subthreshold conditioning pulse of ICF is able to trigger subcortical and spinal processes that may contribute to the facilitation of MEPs.
Effects of pulse waveform on TMS measures
There were significant differences in RMT, MEP latency, cSP, SICI, and ICF between the three conditions. MonoAP yielded the highest RMT, followed by monoPA and biAP-PA. These findings are consistent with previous studies that compared monoPA and biphasic pulses (Delvendahl et al., 2014a; Kammer et al., 2001; Niehaus et al., 2000; Sommer et al., 2006; Stephani et al., 2016) as well as monoPA and monoAP pulses (Delvendahl et al., 2014a; Orth and Rothwell, 2004; Sakai et al., 1997). Together, these results support a model of current-cortex interactions whereby the cortico-spinal pathway is most efficiently stimulated with biAP-PA waveforms followed by monoPA and monoAP currents induced orthogonally to the central sulcus.
Our results are in agreement with prior studies that found the MEP latencies to be shorter with monoPA than with monoAP (Delvendahl et al., 2014a, 2014b; D’Ostilio et al., 2016; Mills et al., 1992; Ni et al., 2011; Sommer et al., 2006; Takahashi et al., 2005). Moreover, this difference (of ~1.2ms) is in line with the results from Di Lazzaro (Di Lazzaro et al., 2001a, 2003, 2011) and probably reflects the later and more-dispersed I-waves elicited by monoAP.
In contrast, inconsistent results have been reported when comparing the latency of MEPs obtained with monophasic and biphasic pulses (Delvendahl et al., 2014a; Sommer et al., 2006; Niehaus et al., 2000). While we expected biphasic pulses to elicit MEPs with shorter latencies, our results showed that biAP-PA MEP latencies were longer than monoPA, and comparable to monoAP latencies. This difference in results could be due to: First, the intensity of the biphasic pulse was not sufficient to reach layer V of motor cortex and/or to depolarize the PTNs, eliciting a complex group of I-waves with longer latencies (Di Lazzaro et al., 2001a). Second, at threshold levels, the PA phase as second component of the biAP-PA pulse has a greater importance, whereas the AP phase gains more relevance as the stimulation intensity is increased to suprathreshold levels. Considering that MEP latency was 1.7ms longer with biAP-PA than with monoPA pulses, it is possible that in our study, the AP component played a more relevant role in the activation of motor cortex. Therefore, the PA and AP components could have antagonized each other in activating the inhibitory and excitatory interneuron networks, thus resulting in longer latecies. The similarity of biAP-PA and monoAP MEP latencies supports this hypothesis, though further investigation is warranted, e.g., by comparing the latencies of MEPs elicited with the different waveforms and current directions in an input-output curve. When controlling for potential confounding factors, we found that gender significantly influenced MEP latencies. This relationship has been described in previous studies and is considered to be due to a difference in limbs length between genders (Livingston et al., 2010).
Contradictory results have also been reported regarding the effects of waveform on MEP amplitude (Delvendahl et al., 2014a, 2014b; D’Ostilio et al., 2016; Mills et al., 1992; Ni et al., 2011; Sommer et al., 2006; Takahashi et al., 2005). An additional source of variability is the difference in methodology in previous studies: some studies used a fixed portion of MSO to elicit MEPs (Mills et al., 1992; Niehaus et al., 2000; Sommer et al., 2006), whereas other studies used a specific percentage of RMT (Delvendahl et al., 2014a, 2014b). Our results are consistent with the results of previous studies that used similar TMS parameters (Delvendahl et al., 2014a, 2014b).
With the FDI slightly contracted, biAP-PA yielded longer cSP than monoPA, with monoAP in between. These results are generally consistent with the findings of previous cSP studies (Orth and Rothwell, 2004; Sommer et al., 2006). Moreover, the similarity in cSP duration between monoPA and monoAP pulses in our results is consistent with those reported by Sommer and colleagues (Sommer et al., 2006), but contrasts with those reported by Orth and Rothwell (Orth and Rothwell, 2004), who found shorter cSP with monoPA than with either monoAP or biPA-AP pulses. These different results can be due to several factors: First, Orth and Rothwell used a Magstim 200 stimulator for monophasic pulses and a Magstim Super Rapid stimulator for biphasic pulses (Magstim Co., Whitland, Dyfed, UK), whereas both the present study and Sommer and colleagues used a MagPro X100 stimulator for all conditions. It has been shown that the maximal stimulation intensities vary across stimulators depending on the waveform (Kammer et al., 2001), which may influence the cSP duration. Second, Orth and Rothwell used 150% of active motor threshold as the stimulation intensity, whereas the present study and Sommer and colleagues set the stimulation intensity based on RMT. There are different methods to determine the stimulation intensity in the cSP protocol. The two most common methods, i.e., intensity determined as a percentage of either active motor threshold (AMT) or RMT, were discussed above. Other options could be to relate the cSP intensity to the threshold of the cSP itself or to the intensity at which an average of 1mV MEP amplitude is obtained. It should be noted, however, that depending on the method chosen, the effects of TMS pulse parameters on cSP may differ to some extent. We decided to determine the intensity based on the RMT because it can be rather difficult and time-consuming to determine whether a cSP has occurred online using the LabChart software. Our cSP results are in agreement with those of Sommer et al.’s study, in which the pulse parameters were mostly similar to ours. In contrast, our results differ to some extent (cSP was not significantly different between monoAP and monoPA) from those studies in which the cSP was obtained with a different stimulator and with different stimulation parameters.
In sum, RMT was lowest with biAP-PA and highest with monoAP, latencies were shorter with monoPA, whereas MEP amplitudes were comparable in the three conditions. These findings indicate that different pulse waveforms may recruit different subgroups of interneurons at different intensities (Di Lazzaro and Rothwell, 2014). For example, biAP-PA pulses seem to be more efficient at threshold levels but elicit non-significantly smaller MEPs at higher intensities.
Paired-pulse protocols have been conventionally performed with monoPA pulses, probably due to historical reasons and technical availability when they were first described. Our results show that monophasic pulses resulted in stronger short intracortical inhibition (SICI), but weaker facilitation (ICF), when measured with monoPA. Interestingly, significant facilitation was only achieved in the two conditions that included an AP component (i.e., monoAP and biAP-PA).
Although the physiological mechanisms responsible for the results of measures of intracortical balance of inhibition and facilitation (i.e., cSP and paired pulse TMS) cannot be directly inferred from the present study, some hypotheses can be formulated. The results suggest that monoPA waveforms may be more efficient in targeting short-interval inhibitory cortical mechanisms. Based on invasive epidural recordings showing a reduction of I2- and late I-wave amplitudes SICI performed with monoPA pulses (Di Lazzaro et al., 1998, 2002; Nakamura et al., 1996; Ni et al., 2011), the present results are consistent with the hypothesis that monoPA pulses activate interneuron networks in layers II and III of the motor cortex that inhibit layer V PTNs. However, no effect on the amplitude of D- or I-waves was observed when performing ICF with monoPA. In our study, performing ICF with monoPA pulses induced a small facilitation that was not significantly different from baseline. On the other hand, pulse waveforms with an AP component (monoAP and biAP-PA) led to significant facilitation. The influence of AP currents on D- and I-waves during facilitatory protocols has only been studied in a single subject (Di Lazzaro et al., 2006) showing the influence of ICF on late I-waves (I4- and I5-waves). Additional insights to the relationship between AP currents and ICF may come from the results of cSP. Even though cSP is an inhibitory protocol conducted with a single suprathreshold pulse, it is dependent on voluntary muscle contraction, which may reflect the engagement of additional cortical (i.e., premotor or supplementary motor areas) and/or subcortical structures. Similar to the results with ICF, cSP seems to be longer with pulses that include an AP component. If AP-oriented currents target inputs to primary motor cortex from surrounding cortices or other brain structures, the present results support the hypothesis that these cortico-cortical connections may underlie the processes that underlie both cSP and ICF; repeating this approach with epidural recordings could help confirm this hypothesis.
Finally, we examined the associations between RMT and the other TMS measures, and found the baseline MEP amplitude to be the only TMS measure that was related to RMT. The negative association between these two measures has been observed in previous studies (Fried et al., 2017). In regards to cSP and various methods that can be used to measure it, it is worth mentioning that there were no significant relationship between RMT and cSP, suggesting that the use of RMT to set the intensity of cSP pulses did not influence the results.
Effects of pulse waveform on the reliability of TMS measures
Moderate to high reliability was observed in all measures across waveforms with the exception of baseline MEP amplitude with biphasic pulses and ICF with monophasic pulses regardless of current direction. Waveform significantly influenced the test-retest reliability of baseline MEP amplitude, LICI, and ICF. The biAP-PA pulses resulted in less-reliable baseline MEP amplitude, but more-reliable ICF, than monoPA pulses. In contrast, LICI was more reliable when obtained with monoAP than with monoPA pulses.
The present results on RMT and MEP latency are in line with previously reported. Literature on MEP amplitude, however, includes a wide range of test-retest reliability amplitude (Carroll et al., 2001; Kamen, 2004; Kimiskidis et al., 2004; McDonnell et al., 2004; Christie et al., 2007; Livingston and Ingersoll, 2008; Bastani and Jaberzadeh, 2012; Fleming et al., 2012; Ngomo et al., 2012; Liu and Au-Yeung, 2014; Sankarasubramanian et al., 2015; Schambra et al., 2015; Hermsen et al., 2016). The present results suggest that using monophasic pulses may improve the reliability of the MEP amplitude.
The reliability of cSP (Liu and Au-Yeung, 2014; Hermsen et al., 2016) and paired-pulse TMS measures (Fleming et al., 2012; Ngomo et al., 2012; Schambra et al., 2015; Hermsen et al., 2016) has only been studied under certain conditions and predominantly using monoPA waveforms. Particular attention should be paid to ICF given that its reliability in the present work was excellent when obtained with biphasic, but not with monophasic, pulses.
Effects of aging on reliability of TMS measures
The ICCs of most TMS measures were reassuringly similar between young and older adults (Fried et al., 2017). Interestingly, however, the RMT and LICI with monoPA pulses, were the two most reliable TMS measures among older adults, and significantly less reliable in the young cohort. The higher reliability of monoPA RMT in older adults could reflect an increase of neurophysiological systems’ ‘rigidity’ due to normal aging, which may reduce the influence of state-dependent effects and other factors that contribute to the intraindividual variability in corticospinal excitability. The higher reliability of LICI among older adults could be attributed to: (1) Unlike the young adults, most older adults showed nearly complete inhibition of MEPs with LICI, suggesting a floor effect that would minimize inter-visit variability. (2) LICI can be performed with a range of ISIs (from 50–200ms), and 100ms may be sub-optimal for young adults relative to older. (3) Age-related changes in synaptic transmission and cortical adaptability to external stimuli may account for differences between young and older adults in the efficacy of intracortical inhibition, as indexed by LICI. Future studies could investigate this further by obtaining stimulus-response curves of LICI.
In conclusion, the results presented above show that pulse waveform and current direction influence the efficacy and reliability of single- and paired-pulse TMS measures and, therefore, should be considered in assessing TMS measures. Acknowledging that the sample size in each group was relatively small, the present study was able to detect significant differences between the three groups and the results were in line with, and expanded, previously reported measures in the literature. Future studies with larger cohorts are nevertheless needed to confirm the present findings. In addition, the present study investigated the effects and reliability of different pulse waveforms in different groups. Future research should try to incorporate a fully within-subject design. However, this type of study would require six visits per subject, which may reduce the feasibility of the experiment, and may make it difficult to disentangle the reproducibility results from the efficacy comparisons. Nevertheless, our results show that these parameters are of special relevance to measuring the RMT or baseline MEP amplitude, which are the most important and widely used TMS measures. Pulse configurations that were not previously studied with paired-pulse measures (monoAP and biAP-PA) induced significant inhibition (SICI and LICI) or facilitation (ICF) of MEPs. Monophasic pulses induced greater and more reliable inhibition in SICI, whereas biphasic pulses induced greater and more reliable facilitation in ICF. Thus, biphasic pulses may be better suited for exploring the effects of TMS when more than one cortical area or brain structure are involved, as in the case of cSP or ICF. These findings can help future studies choose the parameters of the TMS pulse so as to maximize the efficacy and reliability of single- and paired-pulse TMS measures, thereby optimizing their utility as potential neurophysiologic biomarkers in health and disease.
Acknowledgements
We thank Margo Bernstein (BIDMC) and Krista Grobelny (BIDMC) for assistance with data collection, and Ann Connor (BIDMC) and Joanna Macone (BIDMC) for regulatory oversight and compliance, and assistance with evaluation of participants’ health and medical history.
Funding
A.J. was supported by postdoctoral fellowships from the Natural Sciences and Engineering Research Council of Canada (NSERC PDF 454617) and the Canadian Institutes of Health Research (CIHR 41791). P.J.F. was supported in part by the National Institutes of Health (R21 NS082970, R21 AG051846). J.C.M. was supported in part by a Salvador de Madariaga Fellowship for visiting scientists (Ministry of Education, Culture and Sport, Spain). A.P.-L. was supported in part by the Sidney R. Baer Jr. Foundation, the National Institutes of Health (NIH R01 MH100186, R01 NS073601, R01 HD069776, R21 MH099196, R21 NS082870; R21 NS085491, R21 HD07616), the Football Players Health Study at Harvard University, and Harvard Catalyst | The Harvard Clinical and Translational Science Center (NCRR and the NCATS NIH, UL1 RR025758). The content is solely the responsibility of the authors and does not necessarily represent the official views of Harvard Catalyst, Harvard University and its affiliated academic health care centers, or any of the listed granting agencies.
A.P.-L. serves on the scientific advisory boards for Neuronix, Starlab Neuroscience, Neuroelectrics, Axilum Robotics, Constant Therapy, Cognito, NovaVision, and Neosync; and is listed as inventor on several issued and pending patents on real-time integration of transcranial magnetic stimulation with electroencephalography and magnetic resonance imaging. The remaining authors declare no competing interests.
Abbreviations:
- %∆
percentage of change
- AMT
Active motor threshold
- AP
Anterior-to-posterior
- biAP-PA
Biphasic anterior-to-posterior—posterior-to-anterior
- CS
Conditioning stimulus
- cSP
Cortical silent period
- EMG
Electromyography
- FDI
First dorsal interosseous
- η2p
Partial eta squared
- ICC
Intraclass correlation coefficient
- ICF
Intracortical facilitation
- ISI
Inter-stimulus interval
- LICI
Long-interval intracortical inhibition
- me-ANOVA
Mixed-effects analysis of variance
- me-OLR
Mixed-effects ordered logistic regression
- MEP
Motor evoked potential
- monoAP
Monophasic anterior-to-posterior
- monoPA
Monophasic posterior-to-anterior
- MSO
Maximum stimulator output
- PA
Posterior-to-anterior
- PTN
Pyramidal tract neuron
- RMT
Resting motor threshold
- SICI
Short-interval intracortical inhibition
- TMS
Transcranial magnetic stimulation
- TS
Test stimulus
Glossary
- Cortical silent period (cSP)
period of electrical silence in electromyogram that follows the activation of the corticospinal tract after a cortical stimulus during tonic contraction of the target muscle
- D-wave
evoked potential recorded at cervical spinal level, evoked by a stimulus over motor cortex (e.g. a transcranial magnetic stimulation pulse), that represents direct activation of the pyramidal tract neuron
- I-waves
evoked potentials recorded at cervical spinal level, evoked by a stimulus over the motor cortex (e.g. a transcranial magnetic stimulation pulse), which represent probable activation of cortical interneurons leading to the indirect activation of the pyramidal tract neuron
- Intracortical facilitation (ICF)
enhancement of the motor evoked potential following a pair of transcranial magnetic stimulation pulses over the motor cortex when the first stimulus has a low intensity and the inter-stimulus interval is between 8 and 30 ms
- Long-interval intracortical inhibition (LICI)
suppression of the motor evoked potential following a pair of transcranial magnetic stimulation pulses over the motor cortex when both stimuli have sufficient intensity and with an inter-stimulus interval between 50 and 200 ms
- Pulse waveform
refers to the shape of the pulse. Most commonly available waveforms are biphasic (the pulse is sinusoidal and has both positive and negative phases) or monophasic (the pulse is not sinusoidal and has a prominent positive or negative phase)
- Pulse current direction
refers to the direction of the electrical current in relation to the scalp. Most commonly used current directions are posterior-to-anterior and anterior-to-posterior
- Resting motor threshold (RMT)
the minimum intensity at which there is a motor response after at least half of the stimuli
- Short-interval intracortical inhibition
the suppression of the motor evoked potential following a pair of transcranial magnetic stimulation pulses over the motor cortex when the first stimulus has a low intensity and the inter-stimulus interval is between 1 and 4 ms
References
- Amassian VE, Cracco RQ, Maccabee PJ (1989) Focal stimulation of human cerebral cortex with the magnetic coil: a comparison with electrical stimulation. Electroencephalogr Clin Neurophysiol Potentials Sect 74:401–416. [DOI] [PubMed] [Google Scholar]
- Amassian VE, Quirk GJ, Stewart M (1990) A comparison of corticospinal activation by magnetic coil and electrical stimulation of monkey motor cortex. Electroencephalogr Clin Neurophysiol Potentials Sect 77:390–401. [DOI] [PubMed] [Google Scholar]
- Balslev D, Braet W, McAllister C, Miall RC (2007) Inter-individual variability in optimal current direction for transcranial magnetic stimulation of the motor cortex. J Neurosci Methods 162:309–313. [DOI] [PubMed] [Google Scholar]
- Barker AT, Jalinous R, Freeston IL (1985) Non-invasive magnetic stimulation of human motor cortex. The Lancet 325:1106–1107. [DOI] [PubMed] [Google Scholar]
- Bastani A, Jaberzadeh S (2012) A Higher Number of TMS-Elicited MEP from a Combined Hotspot Improves Intra- and Inter-Session Reliability of the Upper Limb Muscles in Healthy Individuals. PLoS ONE 7 Available at: http://dx.doi.org/10.1371/journal.pone.0047582. [DOI] [PMC free article] [PubMed] [Google Scholar]
- Burke D, Hicks R, Gandevia S, Stephen J, Woodforth I, Crawford M (1993) Direct comparison of corticospinal volleys in human subjects to transcranial magnetic and electrical stimulation. J Physiol 470:383. [DOI] [PMC free article] [PubMed] [Google Scholar]
- Carroll TJ, Riek S, Carson RG (2001) Reliability of the input-output properties of the cortico-spinal pathway obtained from transcranial magnetic and electrical stimulation. J Neurosci Methods 112:193–202. [DOI] [PubMed] [Google Scholar]
- Cash RFH, Noda Y, Zomorrodi R, Radhu N, Farzan F, Rajji TK, Fitzgerald PB, Chen R, Daskalakis ZJ, Blumberger DM (2017) Characterization of Glutamatergic and GABAA-Mediated Neurotransmission in Motor and Dorsolateral Prefrontal Cortex Using Paired-Pulse TMS-EEG. Neuropsychopharmacol Off Publ Am Coll Neuropsychopharmacol 42:502–511. [DOI] [PMC free article] [PubMed] [Google Scholar]
- Christie A, Fling B, Crews RT, Mulwitz LA, Kamen G (2007) Reliability of motor-evoked potentials in the ADM muscle of older adults. J Neurosci Methods 164:320–324. [DOI] [PubMed] [Google Scholar]
- Delvendahl I, Gattinger N, Berger T, Gleich B, Siebner HR, Mall V (2014a) The role of pulse shape in motor cortex transcranial magnetic stimulation using full-sine stimuli. PloS One 9:e115247. [DOI] [PMC free article] [PubMed] [Google Scholar]
- Delvendahl I, Lindemann H, Jung NH, Pechmann A, Siebner HR, Mall V (2014b) Influence of Waveform and Current Direction on Short-Interval Intracortical Facilitation: A Paired-Pulse TMS Study. Brain Stimulat 7:49–58. [DOI] [PubMed] [Google Scholar]
- Di Lazzaro V, Oliviero A, Mazzone P, Insola A, Pilato F, Saturno E, Accurso A, Tonali P, Rothwell J (2001a) Comparison of descending volleys evoked by monophasic and biphasic magnetic stimulation of the motor cortex in conscious humans. Exp Brain Res 141:121–127. [DOI] [PubMed] [Google Scholar]
- Di Lazzaro V, Oliviero A, Mazzone P, Pilato F, Saturno E, Insola A, Visocchi M, Colosimo C, Tonali PA, Rothwell JC (2002) Direct demonstration of long latency cortico-cortical inhibition in normal subjects and in a patient with vascular parkinsonism. Clin Neurophysiol Off J Int Fed Clin Neurophysiol 113:1673–1679. [DOI] [PubMed] [Google Scholar]
- Di Lazzaro V, Oliviero A, Pilato F, Mazzone P, Insola A, Ranieri F, Tonali PA (2003) Corticospinal volleys evoked by transcranial stimulation of the brain in conscious humans. Neurol Res 25:143–150. [DOI] [PubMed] [Google Scholar]
- Di Lazzaro V, Oliviero A, Saturno E, Pilato F, Insola A, Mazzone P, Profice P, Tonali P, Rothwell J (2001b) The effect on corticospinal volleys of reversing the direction of current induced in the motor cortex by transcranial magnetic stimulation. Exp Brain Res 138:268–273. [DOI] [PubMed] [Google Scholar]
- Di Lazzaro V, Pilato F, Oliviero A, Dileone M, Saturno E, Mazzone P, Insola A, Profice P, Ranieri F, Capone F, Tonali PA, Rothwell JC (2006) Origin of facilitation of motor-evoked potentials after paired magnetic stimulation: direct recording of epidural activity in conscious humans. J Neurophysiol 96:1765–1771. [DOI] [PubMed] [Google Scholar]
- Di Lazzaro V, Profice P, Ranieri F, Capone F, Dileone M, Oliviero A, Pilato F (2011) I-wave origin and modulation. Brain Stimulat 5 Available at: http://dx.doi.org/10.1016/j.brs.2011.07.008. [DOI] [PubMed] [Google Scholar]
- Di Lazzaro V, Restuccia D, Oliviero A, Profice P, Ferrara L, Insola A, Mazzone P, Tonali P, Rothwell JC (1998) Magnetic transcranial stimulation at intensities below active motor threshold activates intracortical inhibitory circuits. Exp Brain Res 119:265–268. [DOI] [PubMed] [Google Scholar]
- Di Lazzaro V, Rothwell J (2014) Corticospinal activity evoked and modulated by non-invasive stimulation of the intact human motor cortex. J Physiol 592:4115–4128. [DOI] [PMC free article] [PubMed] [Google Scholar]
- D’Ostilio K, Goetz SM, Hannah R, Ciocca M, Chieffo R, Chen J-CA, Peterchev AV, Rothwell JC (2016) Effect of coil orientation on strength–duration time constant and I-wave activation with controllable pulse parameter transcranial magnetic stimulation. Clin Neurophysiol 127:675–683. [DOI] [PMC free article] [PubMed] [Google Scholar]
- Fleming MK, Sorinola IO, Newham DJ, Roberts-Lewis SF, Bergmann JHM (2012) The Effect of Coil Type and Navigation on the Reliability of Transcranial Magnetic Stimulation. IEEE Trans Neural Syst Rehabil Eng 20:617625. [DOI] [PubMed] [Google Scholar]
- Fried PJ, Jannati A, Davila-Pérez P, Pascual-Leone A (2017) Reproducibility of Single-Pulse, Paired-Pulse, and Intermittent Theta-Burst TMS Measures in Healthy Aging, Type-2 Diabetes, and Alzheimer’s Disease. Front Aging Neurosci 9:263. [DOI] [PMC free article] [PubMed] [Google Scholar]
- Hallett M (2007) Transcranial Magnetic Stimulation: A Primer. Neuron 55:187–199. [DOI] [PubMed] [Google Scholar]
- Hermsen AM, Haag A, Duddek C, Balkenhol K, Bugiel H, Bauer S, Mylius V, Menzler K, Rosenow F (2016) Test–retest reliability of single and paired pulse transcranial magnetic stimulation parameters in healthy subjects. J Neurol Sci 362:209–216. [DOI] [PubMed] [Google Scholar]
- Kamen G (2004) Reliability of motor-evoked potentials during resting and active contraction conditions. Med Sci Sports Exerc 36:1574–1579. [DOI] [PubMed] [Google Scholar]
- Kammer T, Beck S, Thielscher A, Laubis-Herrmann U, Topka H (2001) Motor thresholds in humans: a transcranial magnetic stimulation study comparing different pulse waveforms, current directions and stimulator types. Clin Neurophysiol Off J Int Fed Clin Neurophysiol 112:250–258. [DOI] [PubMed] [Google Scholar]
- Kimiskidis VK, Papagiannopoulos S, Sotirakoglou K, Kazis DA, Dimopoulos G, Kazis A, Mills KR (2004) The repeatability of corticomotor threshold measurements. Neurophysiol Clin Clin Neurophysiol 34:259–266. [DOI] [PubMed] [Google Scholar]
- Kozel FA, Nahas Z, deBrux C, Molloy M, Lorberbaum JP, Bohning D, Risch SC, George MS (2000) How Coil–Cortex Distance Relates to Age, Motor Threshold, and Antidepressant Response to Repetitive Transcranial Magnetic Stimulation. J Neuropsychiatry Clin Neurosci 12:376–384. [DOI] [PubMed] [Google Scholar]
- Kujirai T, Caramia MD, Rothwell JC, Day BL, Thompson PD, Ferbert A, Wroe S, Asselman P, Marsden CD (1993) Corticocortical inhibition in human motor cortex. J Physiol 471:501–519. [DOI] [PMC free article] [PubMed] [Google Scholar]
- Liu H, Au-Yeung SSY (2014) Reliability of transcranial magnetic stimulation induced corticomotor excitability measurements for a hand muscle in healthy and chronic stroke subjects. J Neurol Sci 341:105–109. [DOI] [PubMed] [Google Scholar]
- Livingston SC, Goodkin HP, Ingersoll CD (2010) The influence of gender, hand dominance, and upper extremity length on motor evoked potentials. J Clin Monit Comput 24:427–436. [DOI] [PubMed] [Google Scholar]
- Livingston SC, Ingersoll CD (2008) Intra-rater reliability of a transcranial magnetic stimulation technique to obtain motor evoked potentials. Int J Neurosci 118:239–256. [DOI] [PubMed] [Google Scholar]
- McConnell KA, Nahas Z, Shastri A, Lorberbaum JP, Kozel FA, Bohning DE, George MS (2001) The transcranial magnetic stimulation motor threshold depends on the distance from coil to underlying cortex: a replication in healthy adults comparing two methods of assessing the distance to cortex. Biol Psychiatry 49:454–459. [DOI] [PubMed] [Google Scholar]
- McDonnell MN, Ridding MC, Miles TS (2004) Do alternate methods of analysing motor evoked potentials give comparable results? J Neurosci Methods 136:63–67. [DOI] [PubMed] [Google Scholar]
- McGraw KO, Wong SP (1996) Forming inferences about some intraclass correlation coefficients. Psychol Methods 1:30–46. [Google Scholar]
- Mills KR, Boniface SJ, Schubert M (1992) Magnetic brain stimulation with a double coil: the importance of coil orientation. Electroencephalogr Clin Neurophysiol 85:17–21. [DOI] [PubMed] [Google Scholar]
- Nakamura H, Kitagawa H, Kawaguchi Y, Tsuji H (1996) Direct and indirect activation of human corticospinal neurons by transcranial magnetic and electrical stimulation. Direct Indirect Act Hum Corticospinal Neurons Transcranial Magn Electr Stimul 210:45–48. [DOI] [PubMed] [Google Scholar]
- Ngomo S, Leonard G, Moffet H, Mercier C (2012) Comparison of transcranial magnetic stimulation measures obtained at rest and under active conditions and their reliability. Comp Transcranial Magn Stimul Meas Obtained Rest Act Cond Their Reliab 205:65–71. [DOI] [PubMed] [Google Scholar]
- Ni Z, Charab S, Gunraj C, Nelson AJ, Udupa K, Yeh I-JJ, Chen R (2011) Transcranial magnetic stimulation in different current directions activates separate cortical circuits. J Neurophysiol 105:749–756. [DOI] [PubMed] [Google Scholar]
- Niehaus L, Meyer B, Weyh T (2000) Influence of pulse configuration and direction of coil current on excitatory effects of magnetic motor cortex and nerve stimulation. Influ Pulse Config Dir Coil Curr Excit Eff Magn Mot Cortex Nerve Stimul 111:75–80. [DOI] [PubMed] [Google Scholar]
- Oldfield RC (1971) The assessment and analysis of handedness: the Edinburgh inventory. Neuropsychologia 9:97–113. [DOI] [PubMed] [Google Scholar]
- Orth M, Rothwell JC (2004) The cortical silent period: intrinsic variability and relation to the waveform of the transcranial magnetic stimulation pulse. Clin Neurophysiol Off J Int Fed Clin Neurophysiol 115:1076–1082. [DOI] [PubMed] [Google Scholar]
- Portney LG, Watkins MP (2009) Foundations of clinical research: applications to practice
- Ridding MC, Ziemann U (2010) Determinants of the induction of cortical plasticity by non-invasive brain stimulation in healthy subjects. J Physiol 588:2291–2304. [DOI] [PMC free article] [PubMed] [Google Scholar]
- Rossi S, Hallett M, Rossini PM, Pascual-Leone A, Safety of TMS Consensus Group (2009) Safety, ethical considerations, and application guidelines for the use of transcranial magnetic stimulation in clinical practice and research. Clin Neurophysiol Off J Int Fed Clin Neurophysiol 120:2008–2039. [DOI] [PMC free article] [PubMed] [Google Scholar]
- Rossini PM et al. (2015) Non-invasive electrical and magnetic stimulation of the brain, spinal cord, roots and peripheral nerves: Basic principles and procedures for routine clinical and research application. An updated report from an I.F.C.N. Committee. Clin Neurophysiol Off J Int Fed Clin Neurophysiol 126:1071–1107. [DOI] [PMC free article] [PubMed] [Google Scholar]
- Rusu CVV, Murakami M, Ziemann U, Triesch J (2014) A model of TMS-induced I-waves in motor cortex. Brain Stimul 7:401–414. [DOI] [PubMed] [Google Scholar]
- Sakai K, Ugawa Y, Terao Y, Hanajima R, Furubayashi T, Kanazawa I (1997) Preferential activation of different I waves by transcranial magnetic stimulation with a figure-of-eight-shaped coil. Exp Brain Res 113:24–32. [DOI] [PubMed] [Google Scholar]
- Salvador R, Silva S, Basser PJ, Miranda PC (2011) Determining which mechanisms lead to activation in the motor cortex: A modeling study of transcranial magnetic stimulation using realistic stimulus waveforms and sulcal geometry. Clin Neurophysiol 122:748–758. [DOI] [PMC free article] [PubMed] [Google Scholar]
- Sankarasubramanian V, Roelle SM, Bonnett CE, Janini D, Varnerin NM, David A. Cunningham, Sharma Jennifer S., Potter-Baker Kelsey A., Wang Xiaofeng, Yue Guang H., Ela B Plow (2015) Reproducibility of transcranial magnetic stimulation metrics in the study of proximal upper limb muscles. Reprod Transcranial Magn Stimul Metr Study Prox Up Limb Muscles 25:754–764. [DOI] [PMC free article] [PubMed] [Google Scholar]
- Schambra HM, Ogden RT, Martínez-Hernández IE, Lin X, Chang YB, Rahman A, Edwards DJ, Krakauer JW (2015) The reliability of repeated TMS measures in older adults and in patients with subacute and chronic stroke. Reliab Repeated TMS Meas Older Adults Patients Subacute Chronic Stroke 9 Available at: http://dx.doi.org/10.3389/fncel.2015.00335. [DOI] [PMC free article] [PubMed] [Google Scholar]
- Silva S, Basser PJ, Miranda PC (2008) Elucidating the mechanisms and loci of neuronal excitation by transcranial magnetic stimulation using a finite element model of a cortical sulcus. Clin Neurophysiol 119:2405–2413. [DOI] [PMC free article] [PubMed] [Google Scholar]
- Silvanto J, Muggleton NG, Cowey A, Walsh V (2007) Neural activation state determines behavioral susceptibility to modified theta burst transcranial magnetic stimulation: State dependency and TMS. Eur J Neurosci 26:523–528. [DOI] [PubMed] [Google Scholar]
- Sommer M, Alfaro A, Rummel M, Speck S, Lang N, Tings T, Paulus W (2006) Half sine, monophasic and biphasic transcranial magnetic stimulation of the human motor cortex. Clin Neurophysiol Off J Int Fed Clin Neurophysiol 117:838–844. [DOI] [PubMed] [Google Scholar]
- Sommer M, Norden C, Schmack L, Rothkegel H, Lang N, Paulus W (2013) Opposite Optimal Current Flow Directions for Induction of Neuroplasticity and Excitation Threshold in the Human Motor Cortex. Brain Stimulat 6:363–370. [DOI] [PubMed] [Google Scholar]
- Stephani C, Paulus W, Sommer M (2016) The effect of current flow direction on motor hot spot allocation by transcranial magnetic stimulation. Physiol Rep 4 Available at: http://dx.doi.org/10.14814/phy2.12666. [DOI] [PMC free article] [PubMed] [Google Scholar]
- Stokes MG, Barker AT, Dervinis M, Verbruggen F, Maizey L, Adams RC, Chambers CD (2013) Biophysical determinants of transcranial magnetic stimulation: effects of excitability and depth of targeted area. J Neurophysiol 109:437–444. [DOI] [PMC free article] [PubMed] [Google Scholar]
- Takahashi M, Ni Z, Yamashita T, Liang N, Sugawara K, Yahagi S, Kasai T (2005) Differential modulations of intracortical neural circuits between two intrinsic hand muscles. Clin Neurophysiol Off J Int Fed Clin Neurophysiol 116:2757–2764. [DOI] [PubMed] [Google Scholar]
- Thompson P, Day B, Crockard H, Calder I, Murray N, Rothwell J, Marsden C (1991) Intra-operative recording of motor tract potentials at the cervico-medullary junction following scalp electrical and magnetic stimulation of the motor cortex. J Neurol Neurosurg Psychiatry 54:618–623. [DOI] [PMC free article] [PubMed] [Google Scholar]
- Valls-Solé J, Pascual-Leone A, Wassermann EM, Hallett M (1992) Human motor evoked responses to paired transcranial magnetic stimuli. Electroencephalogr Clin Neurophysiol Potentials Sect 85:355–364. [DOI] [PubMed] [Google Scholar]
- van Albada SJ, Robinson PA (2007) Transformation of arbitrary distributions to the normal distribution with application to EEG test-retest reliability. J Neurosci Methods 161:205–211. [DOI] [PubMed] [Google Scholar]
- Wiegel P, Niemann N, Rothwell JC, Leukel C (2018) Evidence for a subcortical contribution to intracortical facilitation. Eur J Neurosci [DOI] [PubMed]
- Ziemann U, Rothwell J (2000) I-waves in motor cortex. J Clin Neurophysiol 17:397–405. [DOI] [PubMed] [Google Scholar]