Abstract
Few studies have evaluated the prognosis or treatment of patients with differentiated thyroid cancer (DTC) according to their NX status. This study investigated this issue to provide a new perspective regarding the treatment guidelines for these patients. Data from 92,447 patients with DTC were obtained from the Surveillance, Epidemiology, and End Results (SEER) database (2004-2013). Survival outcomes were evaluated using Kaplan-Meier analyses with the log-rank test and Cox proportional hazards regression analysis. The rates of cancer-specific mortality and all-cause mortality (per 1,000 person-years) were significantly higher for patients with NX disease, compared to patients with N0 or N1 disease. Multivariate Cox regression modeling revealed that NX stage was an independent risk factor for cancer-specific mortality compared to N1 stage, but not to N0 stage. Similar results were observed for all-cause mortality. After adjustment using propensity score matching, the cancer-specific and all-cause mortality rates were lower for NX stage compared to N0 stage, whereas no significant difference was observed when comparing the NX stage and N1 stage groups. The unexpectedly poor prognosis of patients with NX stage DTC provides new information that may be relevant for treating these patients.
Keywords: Differentiated thyroid cancer, NX stage, prognosis, SEER
Introduction
Differentiated thyroid cancer (DTC) is becoming increasingly prevalent [1,2], and the diagnosis and management of DTC is a growing problem for clinicians, researchers, and health policy makers. DTC mainly consists of papillary thyroid cancer or follicular thyroid cancer, and the regional lymph nodes include the central compartment, lateral cervical, and upper mediastinal lymph nodes. Nodal status is an important prognostic factor in many scoring systems, including the TNM system, and can be used to predict the risk of mortality among patients with DTC [1,3-5]. The current TNM system from the American Joint Committee on Cancer (AJCC) is considered the gold standard for predicting cancer mortality, and the NX stage is assigned to patients whose regional lymph nodes cannot be assessed.
The Surveillance, Epidemiology, and End Results (SEER) program provides cancer data from the National Cancer Institute. However, few studies have focused on the prognosis or treatment of patients with NX stage DTC. Therefore, the present study investigated the prognosis of patients according to their N stage (NX vs. N1 and N0) using SEER data from 2004-2013 and propensity score matching.
Materials and methods
Data collection
The SEER program is an American population-based cancer registry that was launched in 1973 to promote disease control and prevention. The SEER data are obtained from multiple geographic regions, and include information regarding the incidence, prevalence, primary tumor characteristics, and mortality for various cancers. The present study evaluated data from patients with DTC in the SEER database (2004-2013), based on the C73.9 code from the International Classification of Diseases for Oncology (thyroid, papillary, and/or follicular histology). Cases were included in the study if they had diagnosis codes for “papillary carcinoma”, “papillary adenocarcinoma”, “oxyphilic adenocarcinoma”, “papillary carcinoma, oxyphilic cell”, “follicular adenocarcinoma”, or “papillary and follicular adenocarcinoma”. The 92,477 eligible cases were subsequently classified according to their N stage, based on the 6th and 7th versions of the AJCC guidelines (Supplementary Tables 1 and 2). All patients had available information regarding age, sex, race, T and M stage, histological type, surgery (biopsy, lobectomy, subtotal or near-total thyroidectomy, and total thyroidectomy), and radiation treatment (none or refused, external beam radiation therapy, and radioactive I-131 ablation).
Statistical analyses
All patients had been followed until December 2013, and the survival curves (thyroid cancer-specific mortality and all-cause mortality) were compared using Kaplan-Meier analyses with the log-rank test. Propensity score matching was used to further adjust for potential baseline confounders. Cox proportional hazard regression analyses were performed to estimate hazard ratios (HRs) and 95% confidence intervals (CIs) for the associations of the N stages with cancer-specific and all-cause mortality. All tests were two-sided, and differences were considered statistically significant at a p-value of < 0.05. All analyses were performed using IBM SPSS software (version 19.0; IBM Corp.), Stata/SE software (version 12, Stata Corp.), and GraphPad Prism (version 6, GraphPad Software Inc.).
Results
Patient characteristics and outcomes
The N stages for the 92,477 eligible patients were N0 for 73,256 patients, N1 for 18,387 patients, and NX for 834 patients. The patients’ demographic and clinical characteristics according to N stage are shown in Table 1. Patients with NX disease had a significantly shorter follow-up, compared to patients with N1 or N0 disease.
Table 1.
Characteristics for Patients with different N stage
| Covariate | Level | N stage | ||||
|---|---|---|---|---|---|---|
|
| ||||||
| NX (n = 834) | N0 (n = 73256) | p value | N1 (n = 18387) | p value | ||
| Age | 45.37 ± 19.86 | 50.33 ± 14.85 | < 0.001 | 45.55 ± 16.33 | 0.001 | |
| Sex | Female (%) | 628 (75.3) | 58199 (79.4) | 0.003 | 12476 (67.9) | < 0.001 |
| Male (%) | 206 (24.7) | 10566 (20.6) | 5911 (32.1) | |||
| Race | White (%) | 587 (75.4) | 59742 (82.5) | < 0.001 | 15209 (83.7) | < 0.001 |
| Black (%) | 78 (10.0) | 5396 (7.5) | 570 (3.1) | |||
| Other (%) | 114 (14.6) | 7226 (10.0) | 2400 (13.2) | |||
| Histology type | PTC (%) | 708 (84.9) | 67950 (92.8) | < 0.001 | 18184 (98.9) | < 0.001 |
| Other (%) | 126 (15.1) | 5306 (7.2) | 203 (1.1) | |||
| T-stage | T1 (%) | 164 (35.0) | 48296 (66.6) | < 0.001 | 6618 (37.0) | < 0.001 |
| T2 (%) | 83 (17.7) | 12370 (17.1) | 2865 (16.0) | |||
| T3 (%) | 77 (16.5) | 10479 (14.5) | 6529 (36.5) | |||
| T4 (%) | 144 (30.8) | 1353 (1.9) | 1869 (10.5) | |||
| M-stage | M0 (%) | 656 (78.7) | 72697 (99.2) | < 0.001 | 17737 (96.5) | < 0.001 |
| M1 (%) | 178 (21.3) | 559 (0.8) | 650 (3.5) | |||
| Multifocality | No (%) | 316 (64.5) | 46165 (64.1) | 0.849 | 7857 (44.2) | < 0.001 |
| Yes (%) | 174 (35.5) | 25883 (35.9) | 9924 (55.8) | |||
| Extension | No (%) | 328 (65.7) | 66029 (90.5) | < 0.001 | 10783 (60.2) | 0.012 |
| Yes (%) | 171 (34.3) | 6965 (9.5) | 7141 (39.8) | |||
| Radiation | None or refused | 534 (67.1) | 41037 (57.2) | < 0.001 | 4409 (24.7) | < 0.001 |
| Radiation beam or radiation implants (%) | 55 (6.9) | 1063 (1.5) | 599 (3.3) | |||
| Radiosotopes or radiation beam and isotopes/implants (%) | 207 (26.0) | 29646 (41.3) | 12858 (72.0) | |||
| Surgery | Lobectomy (%) | 106 (22.4) | 12790 (17.9) | 0.021 | 420 (2.3) | < 0.001 |
| Subtotal or near-total thyroidectomy (%) | 24 (5.1) | 3028 (4.2) | 340 (1.9) | |||
| Total thyroidectomy (%) | 344 (72.5) | 55665 (77.9) | 17125 (95.8) | |||
| Survival months | 38.41 ± 35.66 | 49.92 ± 33.82 | < 0.001 | 44.68 ± 32.16 | < 0.001 | |
PTC: papillary thyroid cancer.
The rates of cancer-specific mortality per 1,000 person-years for N0 disease, N1 disease, and NX disease were 1.34 (95% CI: 1.22-1.48), 6.91 (95% CI: 6.31-7.56), and 29.22 (95% CI: 23.40-36.48), respectively (Table 2). The rates of all-cause mortality per 1,000 person-years for N0 disease, N1 disease, and NX disease were 9.49 (95% CI: 9.15-9.84), 16.62 (95% CI: 15.68-17.62), and 42.38 (95% CI: 42.38-59.45), respectively (Table 2).
Table 2.
Hazard Ratios of different surgery for the cancer specific deaths and all cause deaths of thyroid cancer
| Surgery | Cancer-Specific Deaths, No. | % | Cancer-Specific Deaths per 1,000 Person-Years | 95% CI | All Cause Deaths, No. | % | All Cause Deaths per 1,000 Person-Years | 95% CI |
|---|---|---|---|---|---|---|---|---|
| N0 | 435 | 0.59 | 1.34 | 1.22-1.48 | 3003 | 4.10 | 9.49 | 9.15-9.84 |
| N1 | 494 | 2.69 | 6.91 | 6.31-7.56 | 1171 | 6.37 | 16.62 | 15.68-17.62 |
| NX | 90 | 10.79 | 29.22 | 23.40-36.48 | 156 | 18.71 | 42.38 | 42.38-59.45 |
Risk factors for thyroid cancer-specific and all-cause mortalities
Univariate Cox regression analyses revealed that age, male sex, race, TNM stage, follicular subtype, extension, radiation treatment, and surgery were significant risk factors for cancer-specific mortality. In the multivariate Cox regression model, the risk of cancer-specific mortality was higher for N0 compared to NX stage (HR: 1.052, 95% CI: 0.581-1.903, P = 0.868). Furthermore, the risk of cancer-specific mortality for N1 was significantly higher than NX stage (HR: 2.249, 95% CI: 1.246-4.061, P = 0.007) (Table 3).
Table 3.
Risk factors for survival: outcome of thyroid cancer specific mortality and all-cause mortality
| Covariate | Level | Thyroid Cancer specific mortality | All-cause mortality | ||||||
|---|---|---|---|---|---|---|---|---|---|
|
| |||||||||
| Univariate Cox regression | Multivariate Cox regression | Univariate Cox regression | Multivariate Cox regression | ||||||
|
| |||||||||
| Hazard Ratio (95% CI) | p-value | Hazard Ratio (95% CI) | p-value | Hazard Ratio (95% CI) | p-value | Hazard Ratio (95% CI) | p-value | ||
| Age | 1.097 (1.092-1.102) | < 0.001 | 1.065 (1.059-1.071) | < 0.001 | 1.087 (1.084-1.089) | < 0.001 | 1.077 (1.074-1.08) | < 0.001 | |
| Sex | Female | Ref | Ref | Ref | Ref | ||||
| Male | 2.892 (2.565-3.260) | < 0.001 | 1.348 (1.154-1.574) | < 0.001 | 2.473 (2.33-2.625) | < 0.001 | 1.65 (1.538-1.77) | < 0.001 | |
| Race | White | Ref | Ref | Ref | Ref | ||||
| Black | 1.088 (0.856-1.384) | 0.490 | 1.065 (0.762-1.488) | 0.714 | 1.307 (1.174-1.454) | < 0.001 | 1.412 (1.245-1.601) | < 0.001 | |
| Other | 1.454 (1.226-1.726) | < 0.001 | 0.926 (0.739-1.161) | 0.506 | 0.91 (0.821-1.007) | 0.068 | 0.805 (0.712-0.91) | 0.001 | |
| Histological types | PTC | Ref | Ref | Ref | Ref | ||||
| Other | 3.559 (3.059-4.140) | < 0.001 | 1.573 (1.254-1.972) | < 0.001 | 2.012 (1.839-2.202) | < 0.001 | 1.217 (1.08-1.372) | 0.001 | |
| T stage | T1 | Ref | Ref | Ref | Ref | ||||
| T2 | 2.928 (2.162-3.966) | < 0.001 | 2.409 (1.707-3.398) | < 0.001 | 1.088 (0.99-1.195) | < 0.079 | 1.098 (0.988-1.222) | 0.084 | |
| T3 | 8.613 (6.769-10.958) | < 0.001 | 4.394 (3.086-6.256) | < 0.001 | 1.6 (1.476-1.733) | < 0.001 | 1.223 (1.066-1.402) | 0.004 | |
| T4 | 95.16 (76.242-118.771) | < 0.001 | 15.932 (10.642-23.85) | < 0.001 | 7.768 (7.172-8.413) | < 0.001 | 2.732 (1.276-3.279) | < 0.001 | |
| N stage | NX | Ref | Ref | Ref | Ref | ||||
| N0 | 0.045 (0.035-0.056) | < 0.001 | 1.052 (0.581-1.903) | 0.868 | 0.171 (0.146-0.201) | < 0.001 | 1.04 (0.724-1.495) | 0.832 | |
| N1 | 0.218 (0.174-0.272) | < 0.001 | 2.249 (1.246-4.061) | 0.007 | 0.296 (0.251-0.35) | < 0.001 | 1.613 (1.122-2.319) | 0.01 | |
| M-stage | M0 | Ref | Ref | Ref | Ref | ||||
| M1 | 50.738 (44.873-57.370) | < 0.001 | 6.373 (5.288-7.68) | < 0.001 | 14.198 (13.057-15.44) | < 0.001 | 3.65 (3.197-4.167) | < 0.001 | |
| Multifocality | No | Ref | Ref | Ref | Ref | ||||
| Yes | 0.913 (0.798-1.044) | 0.185 | 0.797 (0.682-0.933) | 0.005 | 0.901 (0.845-0.96) | 0.001 | 0.967 (0.9-1.039) | 0.361 | |
| Extension | No | Ref | Ref | Ref | Ref | ||||
| Yes | 14.482 (12.571-16.684) | < 0.001 | 1.419 (1.038-1.939) | 0.028 | 2.766 (2.595-2.948) | < 0.001 | 1.089 (0.935-1.269) | 0.274 | |
| Radiation | None or refused | Ref | Ref | Ref | Ref | ||||
| Radiation Beam or Rdioactive implants | 16.208 (13.841-18.979) | < 0.001 | 2.56 (2.017-3.247) | < 0.001 | 3.967 (3.557-4.424) | < 0.001 | 1.418 (1.216-1.652) | < 0.001 | |
| Radioisotopes or Radiation beam + isotopes/implants | 0.986 (0.859-1.133) | 0.847 | 0.812 (0.675-0.978) | 0.028 | 0.628 (0.589-0.669) | < 0.001 | 0.695 (0.643-0.751) | < 0.001 | |
| Surgery | Lobectomy | Ref | Ref | Ref | Ref | ||||
| Subtotal or near-total thyroidectomy | 2.062 (1.467-2.9) | < 0.001 | 1.037 (0.693-1.551) | 0.861 | 1.06 (0.909-1.238) | 0.457 | 1.012 (0.857-1.193) | 0.892 | |
| Total thyroidectomy | 1.417 (1.134-1.77) | 0.002 | 0.937 (0.719-1.22) | 0.627 | 0.829 (0.762-0.903) | < 0.001 | 0.935 (0.851-1.029) | 0.169 | |
PTC: papillary thyroid cancer.
Univariate Cox regression analyses revealed that age, male sex, race, TNM stage, multifocality, follicular subtype, extension, radiation treatment, and surgery were significant risk factors for all-cause mortality. In the multivariate Cox regression model, the risk of all-cause mortality was higher for N0 compared to NX stage (HR: 1.04, 95% CI: 0.724-1.495, P = 0.832). Furthermore, the risk of all-cause mortality was significantly higher for N1 compared to NX stage (HR: 1.613, 95% CI: 1.122-2.319, P = 0.01) (Table 3).
Propensity score matching
The Kaplan-Meier analysis and log-rank test revealed that patients with NX disease had higher rates of cancer-specific and all-cause mortality, compared to patients with N0 or N1 disease (Figure 1A-D). Propensity score matching was performed to minimize any bias regarding age, sex, race, N/M stage, histological subtype, and surgical or radiation treatment. After propensity score matching for age, sex, and race, NX stage was associated with lower DTC-specific mortality, compared to N0 or N1 stage (both P < 0.001, Figure 2A, 2B). Furthermore, after propensity score matching for age, sex, race, T/M stage, histological type, multifocality, and extension, NX stage was associated with lower cancer-specific mortality, compared N0 or N1 stage (P < 0.001 and P = 0.044, respectively; Figure 3A, 3B). After matching for all potential confounders, the cancer-specific mortalities were similar for NX and N1 stage (P = 0.704, Figure 4B), although the cancer-specific mortality was lower for NX compared to N0 stage (P < 0.001, Figure 4A).
Figure 1.
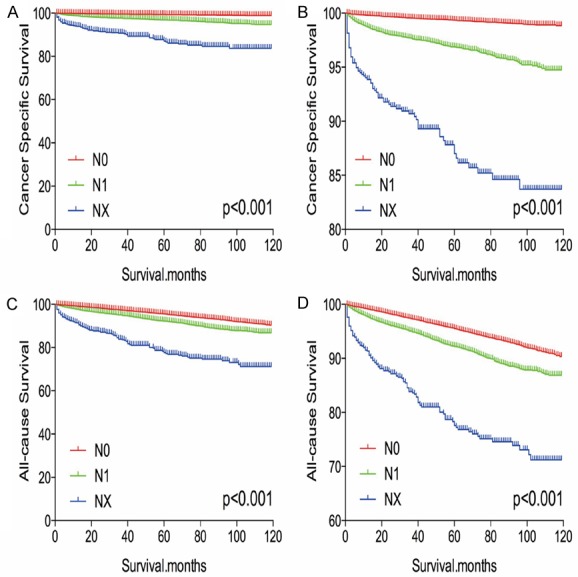
Kaplan Meier curves among patients stratified by N stage for cancer-specific mortality (A, B) and all cause mortality (C, D).
Figure 2.
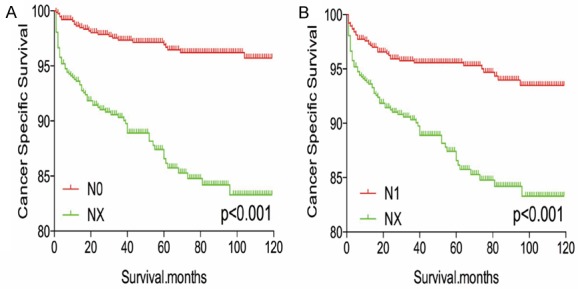
Kaplan Meier curves of cancer-specific mortality for matched stage pairs. Age, sex and race matching between NX and N0 (A), NX and N1 (B) respectively.
Figure 3.
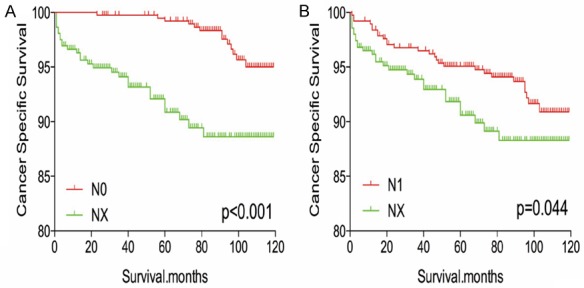
Kaplan Meier curves of cancer-specific mortality for matched stage pairs. Age, sex, race, T/M stage, histology type, multifocality, extension matched between NX and N0 (A), NX and N1 (B) respectively.
Figure 4.
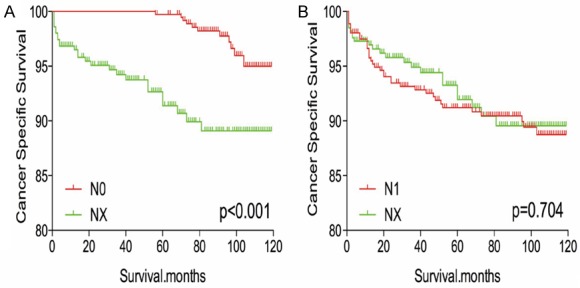
Kaplan Meier curves of cancer-specific mortality for matched stage pairs. Age, sex, race, T/M stage, histology type, multifocality, extension and radiation treatment matched between NX and N0 (A), NX and N1 (B) respectively.
After matching for age, sex, and race, NX stage was associated with a worse prognosis, compared to N0 or N1 stage (both P < 0.001, Figure 5A, 5B). Similar results were obtained after matching for age, sex, race, T/M stage, histological type, multifocality, and extension (Figure 6A, 6B). After matching for all potential confounders, NX and N1 stage were associated with similar all-cause mortality (P = 0.328, Figure 7B), although DX disease was associated with lower all-cause mortality, compared to N0 stage (P < 0.001, Figure 7A).
Figure 5.
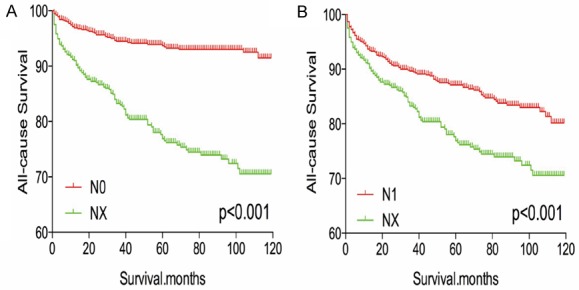
Kaplan Meier curves of all cause mortality for matched stage pairs. Age, sex and race matching between NX and N0 (A), NX and N1 (B) respectively.
Figure 6.
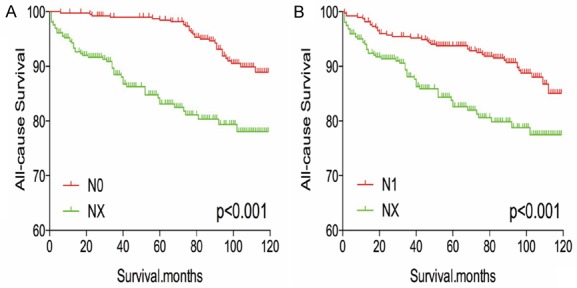
Kaplan Meier curves of all cause mortality for matched stage pairs. Age, sex, race, T/M stage, histology type, multifocality, extension matching between NX and N0 (A), NX and N1 (B) respectively.
Figure 7.
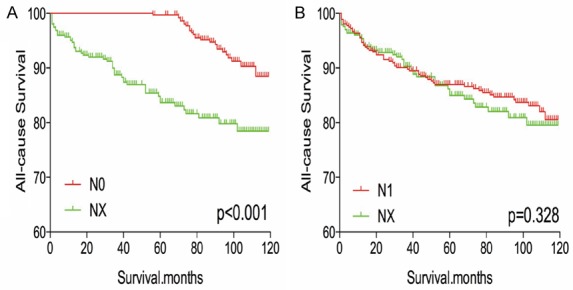
Kaplan Meier curves of all cause mortality for matched stage pairs. Age, sex, race, T/M stage, histology type, multifocality, extension and radiation treatment matching between NX and N0 (A), NX and N1 (B) respectively.
Discussion
In the previous and current editions of the AJCC guidelines (6th and 7th versions), NX stage is assigned to patients whose regional lymph nodes cannot be assessed [1]. Many studies have evaluated the risk factors and outcomes of N0-N1 stage DTC [6-10], although no studies have thoroughly investigated NX stage DTC. Therefore, we evaluated the characteristics and prognosis of patients with NX stage DTC in the SEER database (2004-2013), and found that NX disease was associated with an unexpectedly poor prognosis after adjusting for influential risk factors.
The regional nodes around the thyroid gland can be divided according to their location into levels I-VII [11,12]. However, it is difficult to identify lymph node metastasis from DTC, even after prophylactic lymph node dissection, because of tissue coverage around the retropharyngeal, cervical, or superior mediastinal lymph nodes [1]. Nevertheless, there is little evidence to support a lymph node evaluation if dissection is not performed in DTC cases.
Inadequate and excessive treatments are becoming important concerns in the management of thyroid carcinoma [13-15], and a balance between these two extremes is needed. Thus, an appropriate surgical approach would decrease the cancer-specific mortality and recurrence rates while avoiding unnecessary surgical complications [16]. In the present study, only 72.5% of patients in the NX stage group underwent total thyroidectomy, which was less than the rate for the N1 stage group (95.8%). Therefore, the higher cancer-specific mortality rate for NX disease may be related to insufficient use of thyroidectomy. Furthermore, 21.3% of the patients in the NX stage group experienced distant metastasis, and this rate was much higher than the rates for N1 (0.8%) and N0 stage group (3.5%). Thus, the high cancer-specific mortality rate in the NX stage group may be explained by the high distance metastasis rate, which is an important predictor of recurrence and cancer-specific mortality in DTC cases [1,17]. Moreover, postoperative radioiodine ablation can eradicate normal thyroid remnants and destroy neoplastic foci, although it also reduces or eliminates serum thyroglobulin, to decrease the risks of mortality and recurrence [18-20]. In the present study, 67.1% of the patients in the NX stage group did not undergo radiation, which may also explain the association with a relatively low cancer-specific survival. Therefore, compared to the other two stages, NX stage DTC was associated with insufficient surgery, a high rate of distant metastasis, and infrequent postoperative radioiodine ablation, which may indicate that aggressive treatment is needed for patients with NX stage DTC.
The present study has several limitations. First, the SEER database does not include information regarding DTC recurrence, which may have introduced overestimation bias in the analysis of cancer-specific and all-cause mortality. Second, patients with NX stage DTC had relatively short follow-ups, which may have affected the prognostic analysis. Third, the present study did not consider important risk factors, such as family history, vascular invasion, histological findings, and genetic status (e.g., BRAF and TERT promoter mutations).
In conclusion, patients with NX stage DTC experienced significantly poorer survival, compared to patients with N0 stage DTC. However, after propensity score matching for relevant confounding factors, similar prognoses were observed in the NX stage and N1 stage groups. These findings are not consistent with current expectations regarding DTC progression, and provide new information regarding the radical treatment of patients with NX stage DTC.
Disclosure of conflict of interest
None.
Supporting Information
References
- 1.Haugen BR, Alexander EK, Bible KC, Doherty GM, Mandel SJ, Nikiforov YE, Pacini F, Randolph GW, Sawka AM, Schlumberger M, Schuff KG, Sherman SI, Sosa JA, Steward DL, Tuttle RM, Wartofsky L. 2015 American thyroid association management guidelines for adult patients with thyroid nodules and differentiated thyroid cancer the American thyroid association guidelines task force on thyroid nodules and differentiated thyroid cancer. Thyroid. 2016;26:1–133. doi: 10.1089/thy.2015.0020. [DOI] [PMC free article] [PubMed] [Google Scholar]
- 2.Mao YS, Xing MZ. Recent incidences and differential trends of thyroid cancer in the USA. Endocr Relat Cancer. 2016;23:313–22. doi: 10.1530/ERC-15-0445. [DOI] [PMC free article] [PubMed] [Google Scholar]
- 3.Nixon IJ, Wang LY, Palmer FL, Tuttle RM, Shaha AR, Shah JP, Patel SG, Ganly I. The impact of nodal status on outcome in older patients with papillary thyroid cancer. Surgery. 2014;156:137–46. doi: 10.1016/j.surg.2014.03.027. [DOI] [PubMed] [Google Scholar]
- 4.Furtado MS, Rosario PW, Calsolari MR. Persistent and recurrent disease in patients with papillary thyroid carcinoma with clinically apparent (cN1), but not extensive, lymph node involvement and without other factors for poor prognosis. Arch Endocrinol Metab. 2015;59:285–91. doi: 10.1590/2359-3997000000081. [DOI] [PubMed] [Google Scholar]
- 5.Stratmann M, Sekulla C, Dralle H, Brauckhoff M. Current TNM system of the UICC/AJCC. The prognostic significance for differentiated thyroid carcinoma. Chirurg. 2012;83:646–51. doi: 10.1007/s00104-011-2216-3. [DOI] [PubMed] [Google Scholar]
- 6.Wang F, Yu X, Shen X, Zhu G, Huang Y, Liu R, Viola D, Elisei R, Puxeddu E, Fugazzola L, Colombo C, Jarzab B, Czarniecka A, Lam AK, Mian C, Vianello F, Yip L, Riesco-Eizaguirre G, Santisteban P, O’Neill CJ, Sywak MS, Clifton-Bligh R, Bendlova B, Sýkorová V, Wang Y, Liu S, Zhao J, Zhao S, Xing M. The prognostic value of tumor multifocality in clinical outcomes of papillary thyroid cancer. J Clin Endocrinol Metab. 2017;102:3241–50. doi: 10.1210/jc.2017-00277. [DOI] [PMC free article] [PubMed] [Google Scholar]
- 7.Liu ZM, Wang LQ, Yi PF, Wang CY, Huang T. Risk factors for central lymph node metastasis of patients with papillary thyroid microcarcinoma: a meta-analysis. Int J Clin Exp Pathol. 2014;7:932–7. [PMC free article] [PubMed] [Google Scholar]
- 8.Liu Z, Huang T. Papillary thyroid microcarcinoma and active surveillance. Lancet Diabetes Endocrinol. 2016;4:974–5. doi: 10.1016/S2213-8587(16)30269-8. [DOI] [PubMed] [Google Scholar]
- 9.Liu Z, Zeng W, Chen T, Guo Y, Zhang C, Liu C, Huang T. A comparison of the clinicopathological features and prognoses of the classical and the tall cell variant of papillary thyroid cancer: a meta-analysis. Oncotarget. 2017;8:6222–32. doi: 10.18632/oncotarget.14055. [DOI] [PMC free article] [PubMed] [Google Scholar]
- 10.Liu LS, Liang J, Li JH, Liu X, Jiang L, Long JX, Jiang YM, Wei ZX. The incidence and risk factors for central lymph node metastasis in cN0 papillary thyroid microcarcinoma: a meta-analysis. Eur Arch Otorhinolaryngol. 2017;274:1327–38. doi: 10.1007/s00405-016-4302-0. [DOI] [PubMed] [Google Scholar]
- 11.Nixon IJ, Shaha AR. Management of regional nodes in thyroid cancer. Oral Oncol. 2013;49:671–5. doi: 10.1016/j.oraloncology.2013.03.441. [DOI] [PubMed] [Google Scholar]
- 12.Wu MH, Shen WT, Gosnell J, Duh QY. Prognostic significance of extranodal extension of regional lymph node metastasis in papillary thyroid cancer. Head Neck. 2015;37:1336–43. doi: 10.1002/hed.23747. [DOI] [PubMed] [Google Scholar]
- 13.Del Rio P, Pisani P, Montana CM, Cataldo S, Marina M, Ceresini G. The surgical approach to nodule Thyr 3-4 after the 2.2014 NCCN and 2015 ATA guidelines. Int J Surg. 2017;41:S21–S5. doi: 10.1016/j.ijsu.2017.05.014. [DOI] [PubMed] [Google Scholar]
- 14.De Crea C, Raffaelli M, Sessa L, Lombardi CP, Bellantone R. Surgical approach to level VI in papillary thyroid carcinoma: an overview. Updates Surg. 2017;69:205–9. doi: 10.1007/s13304-017-0468-2. [DOI] [PubMed] [Google Scholar]
- 15.Lang BH, Wong CK. A cost-effectiveness comparison between early surgery and non-surgical approach for incidental papillary thyroid microcarcinoma. Eur J Endocrinol. 2015;173:367–75. doi: 10.1530/EJE-15-0454. [DOI] [PubMed] [Google Scholar]
- 16.Leboulleux S, Tuttle RM, Pacini F, Schlumberger M. Papillary thyroid microcarcinoma: time to shift from surgery to active surveillance? Lancet Diabetes Endocrinol. 2016;4:933–42. doi: 10.1016/S2213-8587(16)30180-2. [DOI] [PubMed] [Google Scholar]
- 17.See A, Iyer NG, Tan NC, Teo C, Ng J, Soo KC, Tan HK. Distant metastasis as the sole initial manifestation of well-differentiated thyroid carcinoma. Eur Arch Otorhinolaryngol. 2017;274:2877–82. doi: 10.1007/s00405-017-4532-9. [DOI] [PubMed] [Google Scholar]
- 18.Cheng LX, Liu M, Ruan MM, Chen LB. Challenges and strategies on radioiodine treatment for differentiated thyroid carcinoma. Hell J Nucl Med. 2016;19:23–32. doi: 10.1967/s002449910334. [DOI] [PubMed] [Google Scholar]
- 19.Schlumberger M, Catargi B, Borget I, Deandreis D, Zerdoud S, Bridji B, Bardet S, Leenhardt L, Bastie D, Schvartz C, Vera P, Morel O, Benisvy D, Bournaud C, Bonichon F, Dejax C, Toubert ME, Leboulleux S, Ricard M, Benhamou E Tumeurs de la Thyroïde Refractaires Network for the Essai Stimulation Ablation Equivalence Trial. Strategies of radioiodine ablation in patients with low-risk thyroid cancer. N Engl J Med. 2012;366:1663–73. doi: 10.1056/NEJMoa1108586. [DOI] [PubMed] [Google Scholar]
- 20.Molinaro E, Pieruzzi L, Viola D. Radioiodine post-surgical remnant ablation in patients with differentiated thyroid cancer: news from the last 10 years. J Endocrinol Invest. 2012;35:16–20. [PubMed] [Google Scholar]
Associated Data
This section collects any data citations, data availability statements, or supplementary materials included in this article.


