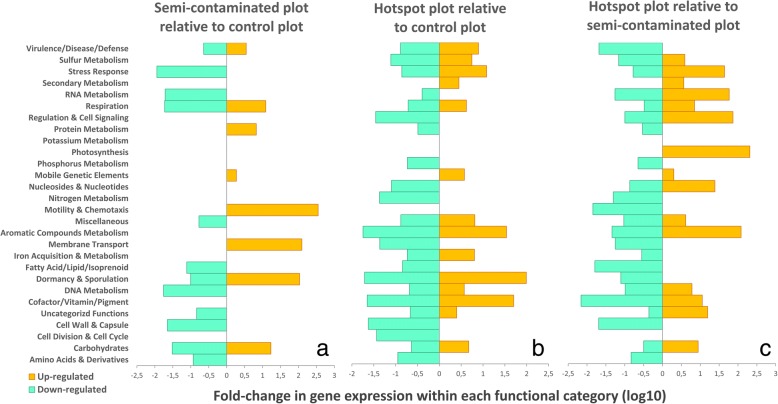
Fig. 2.
Metatranscriptomic pairwise ratio comparison of gene expression in the three plots. The figure shows the log10 up and downregulation ratios of functions within metabolic categories in Cu-plots relative to the control (panels a and b, downregulated = higher in the control; upregulated = higher in the copper plots), and between copper plots (panel c, downregulated = higher in the semi-contaminated; upregulated = higher in the hotspot). Absolute mRNA counts of functions significantly altered by Cu were extracted (nbGLM, LRT, FDR-corrected p < 0.05), summed per metabolic category, and respectively divided by either control plot values (panels a and b) or from the semi-contaminated plot (panel c) in order to define relative up and downregulation ratios. The displayed functional categories used are very large and encopass many subcategories and genes. Therefore, within a same category, some genes might be significantly upregulated while others might be downregulated

