Abstract
Dendritic cells (DCs) orchestrate the crosstalk between innate and adaptive immunity. CD8α+ DCs present antigens to CD8+ T cells and elicit cytotoxic T-cell responses to viruses, bacteria and tumors1. Although lineage-specific transcriptional regulators of CD8α+ DC development have been identified2, the molecular pathways that selectively orchestrate CD8α+ DC function remain elusive. Moreover, metabolic reprogramming is important for DC development and activation3,4, but metabolic dependence and regulation of DC subsets are unknown. Here, we describe a data-driven systems biology algorithm (NetBID) and an unexpected role of Hippo pathway kinases, Mst1 and Mst2 (Mst1/2), in selectively programming CD8α+ DC function and metabolism. Our NetBID analysis reveals a marked enrichment of the activities of Hippo pathway kinases in CD8α+ DCs relative to CD8α− DCs. DC-specific deletion of Mst1/2, but not Lats1/2 or Yap/Taz that mediate canonical Hippo signaling, disrupts homeostasis and function of CD8+ T cells and anti-tumor immunity. Mst1/2-deficient CD8α+ DCs are impaired in presenting extracellular proteins and cognate peptides to prime CD8+ T cells, while CD8α− DCs lacking Mst1/2 have largely normal function. Mechanistically, compared with CD8α− DCs, CD8α+ DCs show much stronger oxidative metabolism and critically depend upon Mst1/2 signaling to maintain bioenergetic activities and mitochondrial dynamics for functional capacities. Further, CD8α+ DCs selectively express IL-12 that depends upon Mst1/2 and the crosstalk with non-canonical NF-κB signaling. Our findings identify Mst1/2 as selective drivers of CD8α+ DC function by integrating metabolic activity and cytokine signaling, and highlight that the interplay between immune signaling and metabolic reprogramming underlies the unique function of DC subsets.
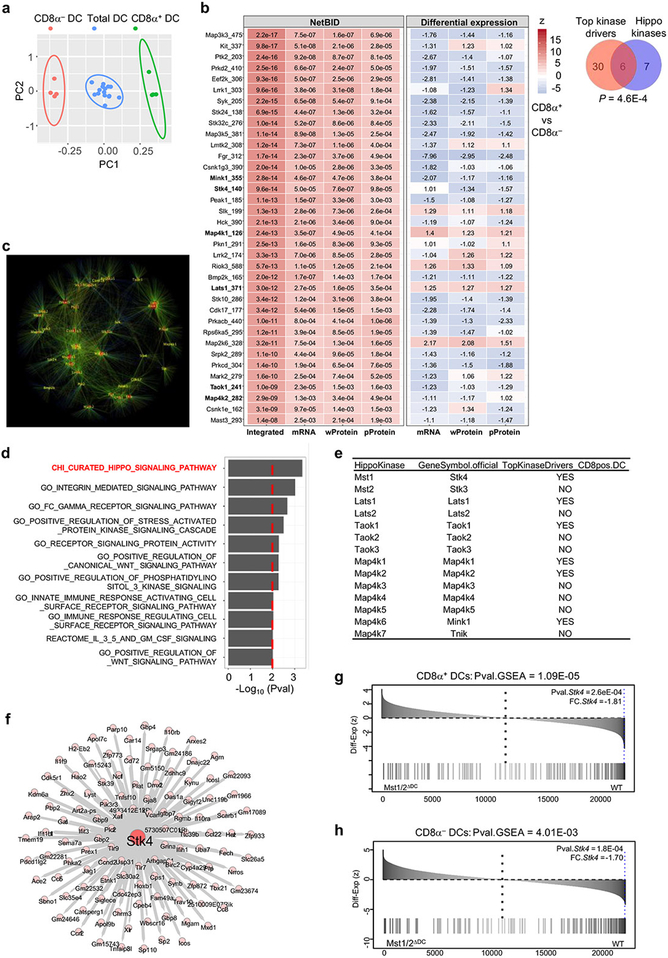
CD8α+ DCs have a superior ability to prime CD8+ T cells, while CD8α− DCs are more efficient in priming CD4+ T cells5. To identify DC subset-specific regulators, we developed a systems biology approach, data-driven Network-based Bayesian Inference of Drivers (NetBID), by integrating data from transcriptomics, whole proteomics and phosphoproteomics (Fig. 1a). Specifically, we computationally reconstructed a DC-specific signaling Interactome (DCI) from a collective cohort of transcriptomic profiles of total DCs (Extended Data Fig. 1a) by information theory-based approaches6,7. Next, we superimposed DCI with the transcriptome, proteome and phosphoproteome of CD8α+ and CD8α− DCs. We hypothesized that if a signaling protein is a unique driver between DC subsets, its regulons in DCI should be enriched in the differentially expressed genes and proteins, although the driver itself is not necessarily differentially expressed. Given the crucial roles of protein kinases in immune function8, we focused on them and identified 36 hub kinases whose regulons in DCI were enriched in CD8α+ vs CD8α− DC signatures in all of the transcriptome, proteome and phosphoproteome profiles (Extended Data Fig. 1b, c). There was a striking enrichment of Hippo signaling9 (Extended Data Fig. 1b, d), as many kinases involved in Hippo signaling (Extended Data Fig. 1e) were identified by NetBID, including Stk4 (also known as Mst1). Immunoblot analysis showed that CD8α+ DCs had increased phosphorylation of Mst1 and Mst2 (Mst1/2) and Yap, as well as expression of Lats1 (Fig. 1b). Moreover, the predicted regulons of Stk4/Mst1 (Extended Data Fig. 1f) were significantly dysregulated upon Mst1/2 deletion in total, CD8α+ and CD8α− DCs (Fig. 1c and Extended Data Fig. 1g, h). Collectively, capitalizing on the power of our newly developed unbiased approach to capture putative master regulators, we unveil the significant enrichment of Hippo signaling in CD8α+ DCs.
Figure 1. NetBID identifies Hippo signaling kinases as drivers of CD8α+ DCs, and deletion of Mst1/2 in DCs leads to selective CD8+ T-cell homeostatic and functional defects.
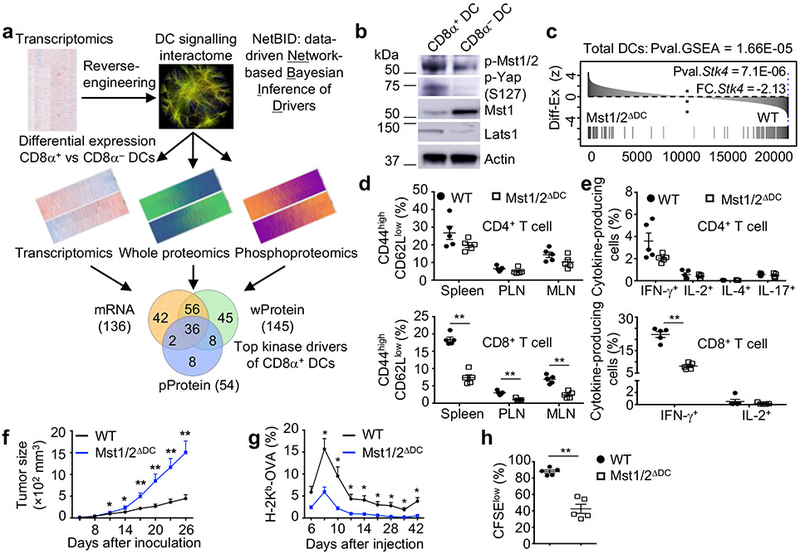
a, Overview of NetBID. b, Immunoblot of splenic CD8α+ and CD8α− DCs. c, Enrichment of predicted Mst1 signaling regulons in differentially expressed genes between Mst1/2-deficient (Mst1/2ΔDC) and wild-type (WT) DCs. FC.Stk4, signed fold change of Stk4 expression. d, Frequencies of CD44highCD62Llow effector/memory cells in T cells from spleen, peripheral lymph nodes (PLN) and mesenteric lymph nodes (MLN) (n = 5 per genotype). e, Frequencies of cytokine-producing cells (n = 5 per genotype). f, MC38 tumor growth (n = 10 for WT, n = 6 for Mst1/2ΔDC). g, Frequency of blood H-2Kb-OVA+ CD8+ T cells from LM-OVA-infected mice (n = 5 for WT, n = 4 for Mst1/2ΔDC). h, Frequency of CFSElow proliferated cells of donor OT-I T cells in OVA-immunized mice (n = 5 per genotype). Error bar indicates SEM. *P < 0.05; **P < 0.01; two-tailed unpaired Student’s t-test in d–h. Data summarize two (f, g, h), three (b) or four (d, e) independent experiments.
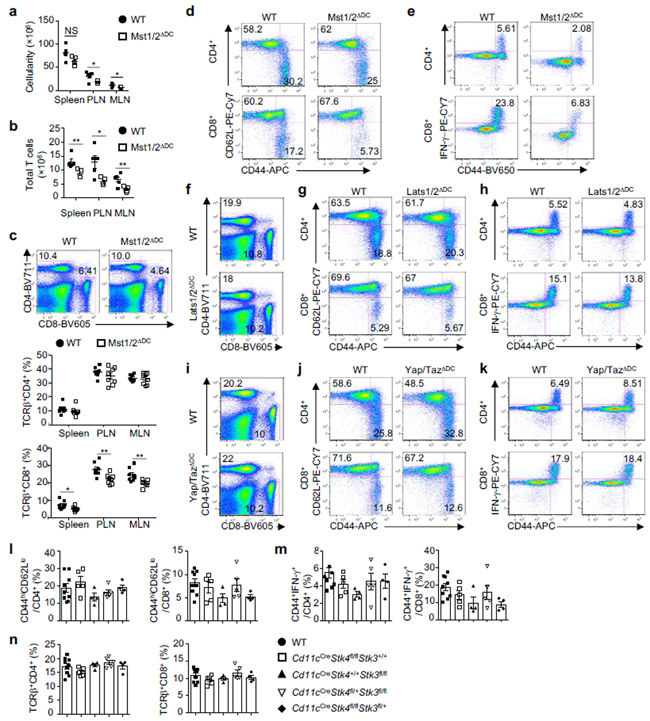
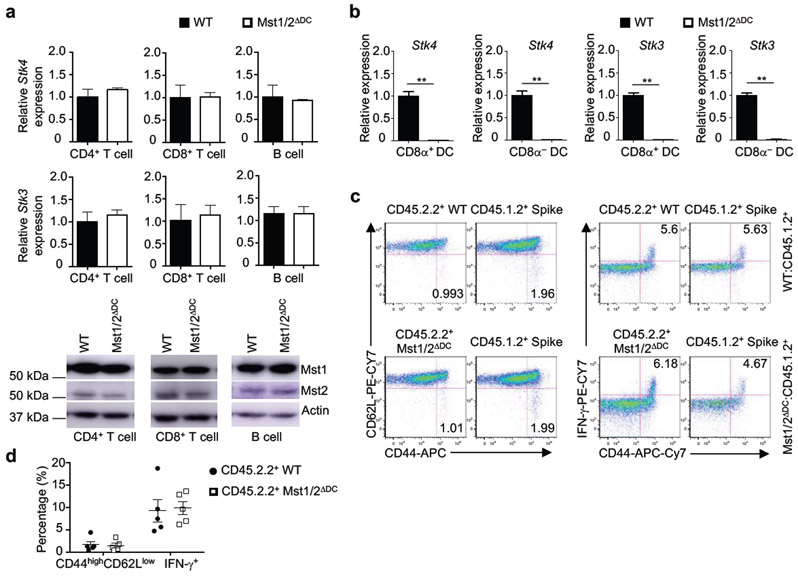
To systemically dissect the Hippo pathway in DCs, we engineered DC-specific deletion of Mst1/2, Lats1/2, or Yap/Taz via CD11c-Cre mice (Mst1/2ΔDC, Lats1/2ΔDC, or Yap/TazΔDC mice). Cellularity of lymphoid organs and T cells were reduced in Mst1/2ΔDC mice (Extended Data Fig. 2a, b), but normal in Lats1/2ΔDC and Yap/TazΔDC mice (data not shown). Mst1/2ΔDC mice showed a decreased percentage of CD8+ T cells (Extended Data Fig. 2c) associated with reduced effector/memory population (Fig. 1d and Extended Data Fig. 2d), but CD4+ T-cell homeostasis was largely unperturbed. Furthermore, CD44high CD8+ T cells from Mst1/2ΔDC mice expressed less IFN-γ, while CD44high CD4+ T cells had slightly reduced IFN-γ but normal IL-2, IL-4 and IL-17A expression (Fig. 1e and Extended Data Fig. 2e). In contrast to Mst1/2ΔDC mice, Lats1/2ΔDC and Yap/TazΔDC mice contained normal T-cell homeostasis (Extended Data Fig. 2f–k). Also, deletion of Mst1 or Mst2 alone did not affect immune homeostasis (Extended Data Fig. 2l–n). We verified specific loss of Mst1/2 expression in DCs from Mst1/2ΔDC mice (Extended Data Fig. 3a, b), and rectification of CD8+ T-cell phenotypes in Mst1/2ΔDC bone marrow (BM)-derived cells from mixed BM chimeras (Extended Data Fig. 3c, d). Collectively, DCs require Mst1/2 to selectively orchestrate CD8+ T-cell homeostasis, and this occurs independently of classical Hippo pathway.
Figure 2. Mst1/2 are selectively required in CD8α+ DCs to orchestrate CD8+ T-cell homeostasis and function.

a, b, Frequencies of CD44highCD62Llow (a) and CD44+IFN-γ+ cells (b) in splenic T cells from WT (n = 5), Mst1/2ΔDC (n = 3), Batf3−/− (n = 4) and Mst1/2ΔDCBatf3−/− (n = 4) mice. c, CFSE dilution of donor OT-I T cells in WT, Mst1/2ΔDC, Batf3−/−:WT or Batf3−/−:Mst1/2ΔDC mixed chimeras immunized with OVA. d, Frequency and number of IFN-γ+ cells among H-2Kb-OVA+ CD8+ T cells after immunization with OVA-loaded irradiated B2m−/− splenocytes (n = 4 per genotype). e, Thymidine incorporation of OT-I T cells cultured with OVA protein- or OVA(257-264) peptide-pulsed CD8α+ or CD8α− DCs (n = 8 per genotype). f, IL-2 from co-cultures in e (n = 6 per genotype for CD8α+ DCs, and n = 8 per genotype for CD8α− DCs). Error bar indicates SEM. NS, not significant; *P < 0.05; **P < 0.01; one-way ANOVA in a, b; two-tailed unpaired Student’s t-test in d–f. Data summarize two (f, c), three (d, e) or four (a, b) independent experiments.
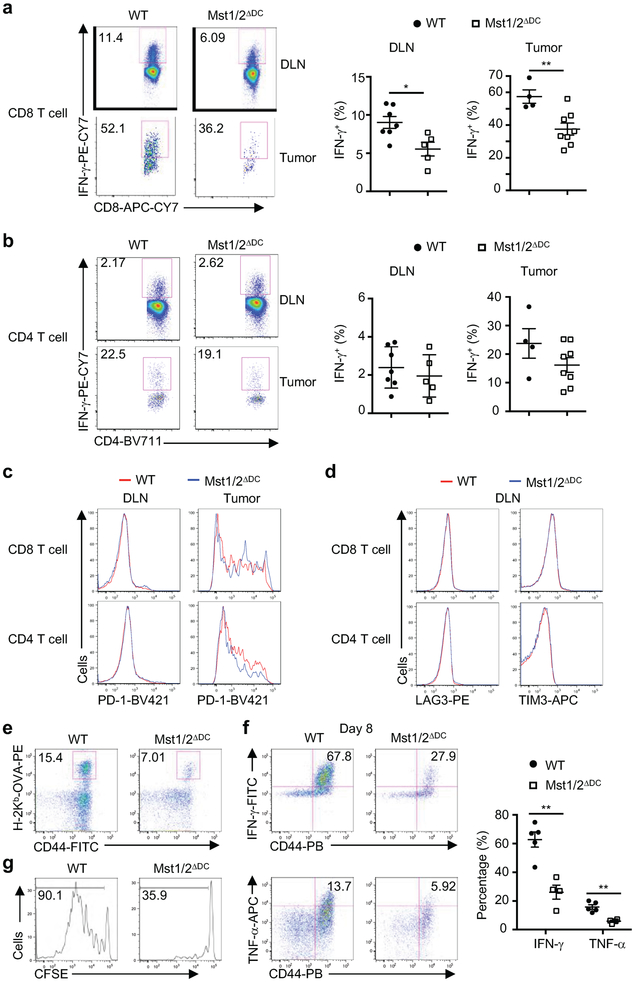
After challenge with MC38 colon adenocarcinoma cells, Mst1/2ΔDC mice showed drastically increased tumor growth (Fig. 1f) and impaired IFN-γ expression in CD8+ T cells (Extended Data Fig. 4a, b), although expression of PD-1, LAG3 and TIM3 was unaltered (Extended Data Fig. 4c, d). Additionally, Mst1/2ΔDC mice infected with ovalbumin-expressing Listeria monocytogenes (LM-OVA) had reduced CD8+ T-cell responses (Fig. 1g and Extended Data Fig. 4e, f). Furthermore, following adoptive transfer of OVA-reactive (OT-I) CD8+ T cells and immunization with OVA, proliferation of OT-I cells was greatly impaired in Mst1/2ΔDC mice (Fig. 1h and Extended Data Fig. 4g). Altogether, Mst1/2 signaling in DCs is required for orchestrating CD8+ T cell-mediated immune responses in vivo.
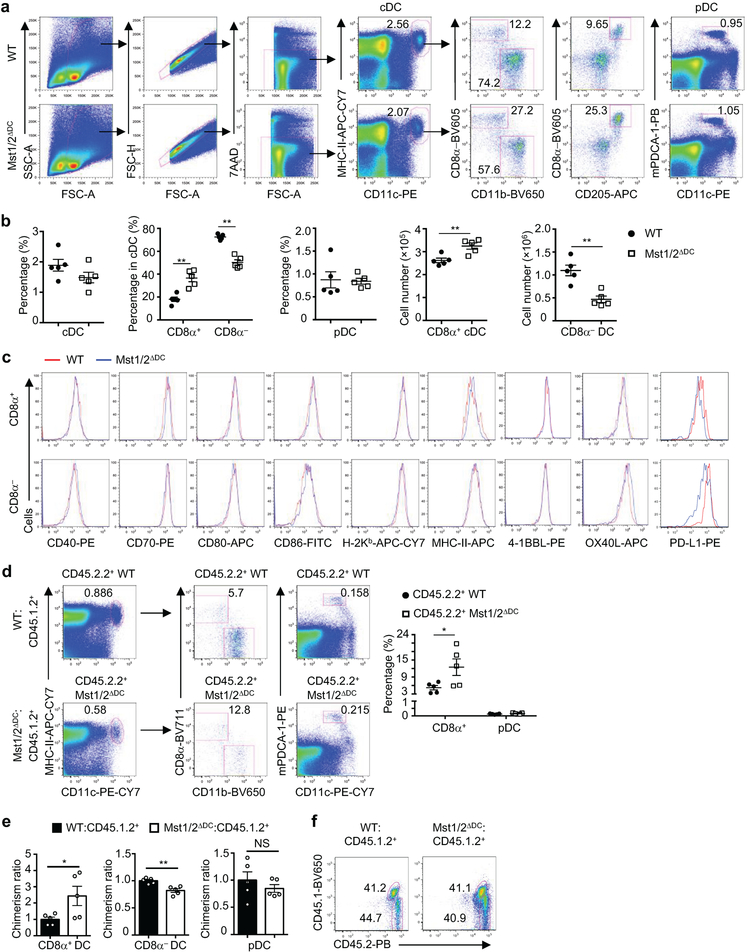
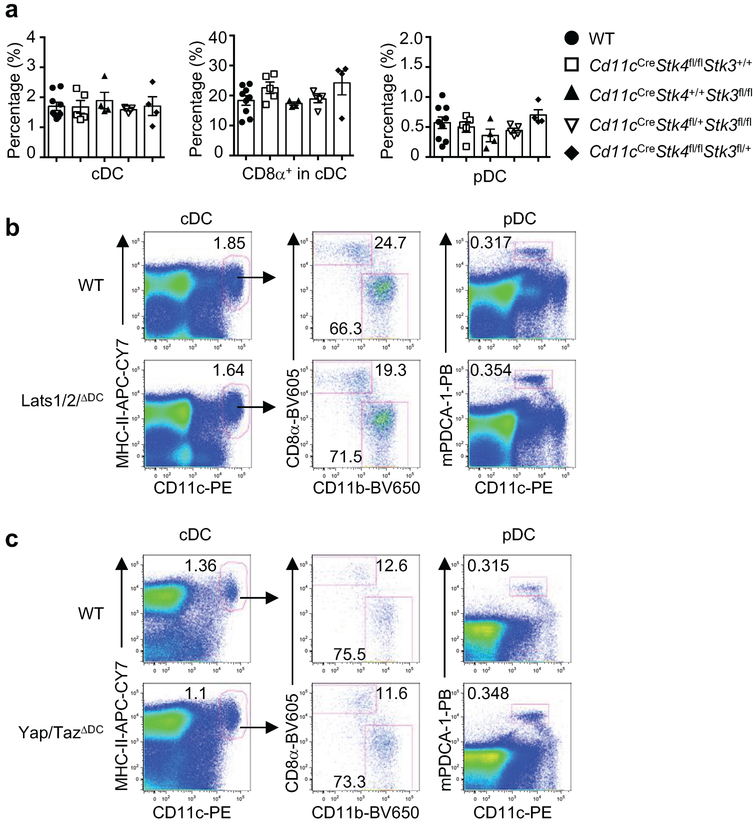
Mst1/2ΔDC mice contained normal percentages of splenic conventional DCs (cDCs) and plasmacytoid DCs (pDCs) (Extended Data Fig. 5a). Within cDCs, the percentages and numbers of CD8α+ and CD8α− subsets were increased and decreased, respectively (Extended Data Fig. 5b). Mst1/2-deficient DCs had normal expression of multiple surface molecules, except for a slight reduction of PD-L1 on CD8α− DCs (Extended Data Fig. 5c). Moreover, mixed BM chimera experiments revealed a cell-intrinsic role of Mst1/2 in DC homeostasis (Extended Data Fig. 5d–f). However, loss of Mst1 or Mst2 alone, or deletion of Lats1/2 or Yap/Taz, did not affect DC homeostasis (Extended Data Fig. 6a–c). Therefore, Mst1/2 control CD8α+ DC homeostasis independently of classical Hippo pathway.
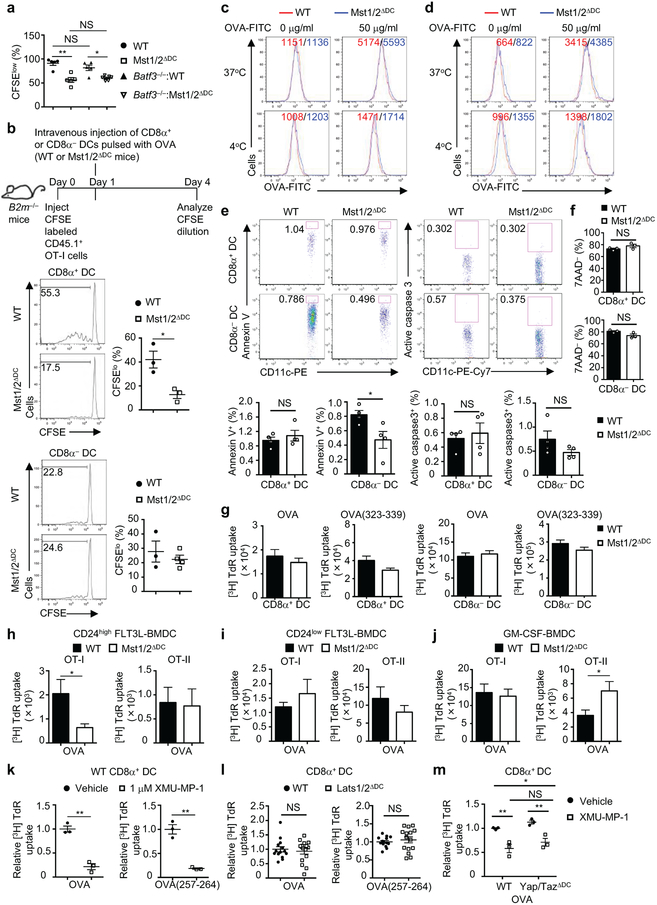
We hypothesized that a selective functional defect of CD8α+ DCs in Mst1/2ΔDC mice accounts for the altered CD8+ T-cell homeostasis and activation. T-cell compartment in mice lacking Batf3, whose deletion selectively ablates CD8α+ DCs10, largely phenocopied those in Mst1/2ΔDC mice, with reduced effector/memory population and IFN-γ expression in CD8+ T cells (Fig. 2a, b). Additionally, these parameters were comparable between Mst1/2-sufficient and -deficient mice in the Batf3−/− background (Fig. 2a, b). Next, we generated Batf3−/−-:Mst1/2ΔDC mixed BM chimeras by following an established strategy11 to restrict Mst1/2 deficiency to CD8α+ DCs only, and found that they were impaired in supporting OT-I CD8+ T-cell priming at the same extent as Mst1/2ΔDC complete chimeras, indicating a selective defect in CD8α+ DCs lacking Mst1/2 (Fig. 2c and Extended Data Fig. 7a). To further test this notion, we transferred OT-I T cells into mice deficient in β2 microglobulin and thus MHC-I, followed by immunization with OVA-pulsed CD8α+ or CD8α− DCs. Mst1/2-deficient CD8α+ DCs induced significantly weaker proliferation of OT-I T cells than WT counterparts, while WT and Mst1/2-deficient CD8α− DCs had comparable function (Extended Data Fig. 7b). Finally, in an in vivo cross-presentation assay, IFN-γ production from endogenous antigen-specific CD8+ T cells was significantly reduced in Mst1/2ΔDC mice (Fig. 2d). Of note, Mst1/2-deficient DCs had no defects in antigen uptake or cell survival (Extended Data Fig. 7c–f). Therefore, Mst1/2 are required for in vivo cross-presentation ability of CD8α+ DCs.
In vitro, Mst1/2-deficient CD8α+ DCs showed a profound defect in mediating OT-I T-cell proliferation in response to OVA protein, and to a lesser extent, OVA(257-264) peptide (Fig. 2e), while WT and Mst1/2-deficient CD8α− DCs had comparable function (Fig. 2e). Similar phenotypes were observed for IL-2 secretion (Fig. 2f). In contrast, either CD8α+ or CD8α− DCs from Mst1/2ΔDC mice were equivalent to WT counterparts in priming proliferation of OVA-specific CD4+ (OT-II) T cells (Extended Data Fig. 7g). Mst1/2 deficiency also impaired CD8+ T-cell priming function of FLT3L-derived CD24high BMDCs, which are functionally equivalent to splenic CD8α+ DCs12, but not CD24low cells or GM-CSF-derived BMDCs (Extended Data Fig. 7h-j). Moreover, CD8α+ DCs treated with a specific Mst1/2 inhibitor were defective in priming CD8+ T cells (Extended Data Fig. 7k). Thus, Mst1/2 selectively program CD8α+ DC functions to prime CD8+ T cells. However, Lats1/2 or Yap/Taz deficiency did not affect T-cell priming function of CD8α+ DCs or their responsiveness to Mst1/2 inhibition (Extended Data Fig. 7l, m), further establishing a role of Mst1/2 in non-canonical Hippo signaling.
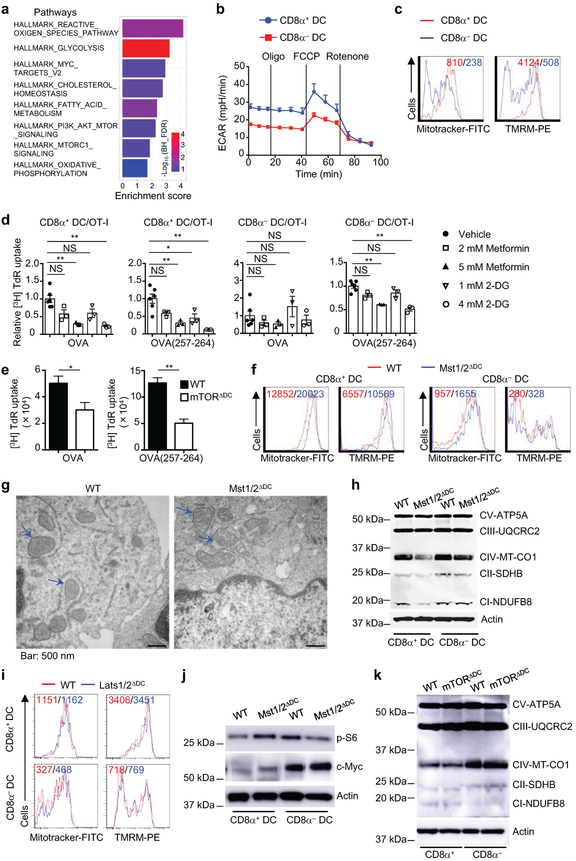
Metabolic reprogramming is associated with DC development and activation3,4, but metabolic requirement for different DC subsets is poorly defined. Our proteomics profiling revealed a significant enrichment of metabolic pathways in CD8α+ DCs (Extended Data Fig. 8a). Accordingly, CD8α+ DCs showed much higher oxygen consumption rate (OCR) and extracellular acidification rate (ECAR), as well as mitochondrial mass and membrane potential, than CD8α− DCs (Fig. 3a and Extended Data Fig. 8b, c). We hypothesized that the unique metabolic state of CD8α+ DCs contributes to their immune priming functions. Indeed, treatment of CD8α+ DCs with metformin (inhibitor of mitochondrial complex I activity) or 2-deoxyglucose (2-DG, inhibitor of hexokinase activity) markedly impaired their ability to prime OT-I T cells, while these inhibitors had only modest effects in CD8α− DCs (Extended Data Fig. 8d). Also, deficiency of metabolic regulator mTOR dampened CD8+ T-cell priming function of CD8α+ DCs (Extended Data Fig. 8e). Therefore, CD8α+ DCs have elevated metabolic activities relative to CD8α− DCs, which contribute to their functional capacity.
Figure 3. Unique metabolic state of CD8α+ DCs supports their immune priming function in an Mst1/2-dependent manner.

a, OCR of splenic CD8α+ and CD8α− DCs (Oligo, oligomycin; FCCP, carbonyl cyanide p-trifluoromethoxyphenylhydrazone). b, OCR bioenergetics profile, basal and maximal OCR (n = 6 for WT CD8α+ DCs, n = 3 for Mst1/2-deficient CD8α+ DCs, n = 6 per genotype for CD8α− DCs), and basal ECAR (n = 9 per genotype for CD8α+ DCs, n = 18 for WT CD8α− DCs, n = 12 for Mst1/2-deficient CD8α− DCs). c, Stochastic optical reconstruction microscopy (STORM) analysis of mitochondrial marker Tom20. Right, quantified maximal mitochondrial diameter. d, Transmission electron microscopy analysis of mitochondria (arrows) in CD8α+ DCs. e, Immunoblot of CD8α+ DCs. f, CD8α+ DC lysate was immunoprecipitated with anti-Mst1 and blotted with anti-PKA Cα/β. g, Thymidine incorporation of OT-I T cells cultured with OVA protein-pulsed WT (n = 13 from 4 mice) or Mst1/2ΔDC (n = 11 from 4 mice) CD8α+ DCs pre-treated with vehicle or M1+Mdivi-1. Error bar indicates SEM. **P < 0.01; two-tailed unpaired Student’s t-test in b, c, g. Data summarize two (b, c, e–g) or four (a) independent experiments.
Furthermore, OCR and ECAR were drastically and selectively reduced in Mst1/2-deficient CD8α+ DCs (Fig. 3b). Since the mitochondrion is the main organelle for oxidative phosphorylation (OXPHOS), we measured the structural integrity of mitochondria. Mst1/2-deficient CD8α+ DCs had enlarged mitochondria (Fig. 3c) and abnormal mitochondrial mass and membrane potential (Extended Data Fig. 8f). Transmission electron microscopy showed that Mst1/2-deficient CD8α+ DCs exhibited increased mitochondrial size, but markedly disorganized cristae (Fig. 3d), which is required for efficient OXPHOS13,14. In contrast, mitochondrial homeostasis and structure were less affected by Mst1/2 deficiency in CD8α− DCs (Extended Data Fig. 8f, g). Consistent with the role of mitochondrial cristae in the assembly and stability of respiratory chain complexes13, NDUFB8 and MT-CO1, components of complexes I and IV respectively, showed impaired expression in Mst1/2-deficient CD8α+ DCs (Extended Data Fig. 8h). Collectively, Mst1/2 orchestrate the metabolic activities and mitochondrial integrity of CD8α+ DCs.
We investigated the molecular basis underlying mitochondrial functions in CD8α+ DCs. We noted that Lats1/2-deficient DCs showed normal mitochondrial profiles (Extended Data Fig. 8i). Additionally, mTORC1 activity and c-Myc expression were unaltered by Mst1/2 deficiency (Extended Data Fig. 8j), and expression of respiratory chain proteins was normal in mTOR-deficient DCs (Extended Data Fig. 8k). Given the regulation of mitochondrial morphology by fission and fusion processes (mitochondrial dynamics) and the link to OXPHOS15, we examined the role of Mst1/2 in mitochondrial dynamics. Mst1/2-deficient CD8α+ DCs had reduced expression of fusion regulator OPA115, and phosphorylation of fission protein DRP1 at Serine 637, which is mediated by protein kinase A (PKA) to inhibit mitochondrial fission15 (Fig. 3e). Moreover, Mst1 interacted with PKA in CD8α+ DCs (Fig. 3f). Thus, in line with disorganized cristae, Mst1/2-deficient CD8α+ DCs have reduced mitochondrial fusion and/or excessive fission. Moreover, treatment of CD8α+ DCs with Mdivi-1 (mitochondrial fission inhibitor) and M1 (mitochondrial fusion promoter)14 slightly enhanced the function of WT DCs, but more importantly, partially restored the ability of Mst1/2-deficient DCs in priming CD8+ T cells (Fig. 3g). These results reveal that Mst1/2-dependent mitochondrial dynamics contributes to CD8α+ DC function.
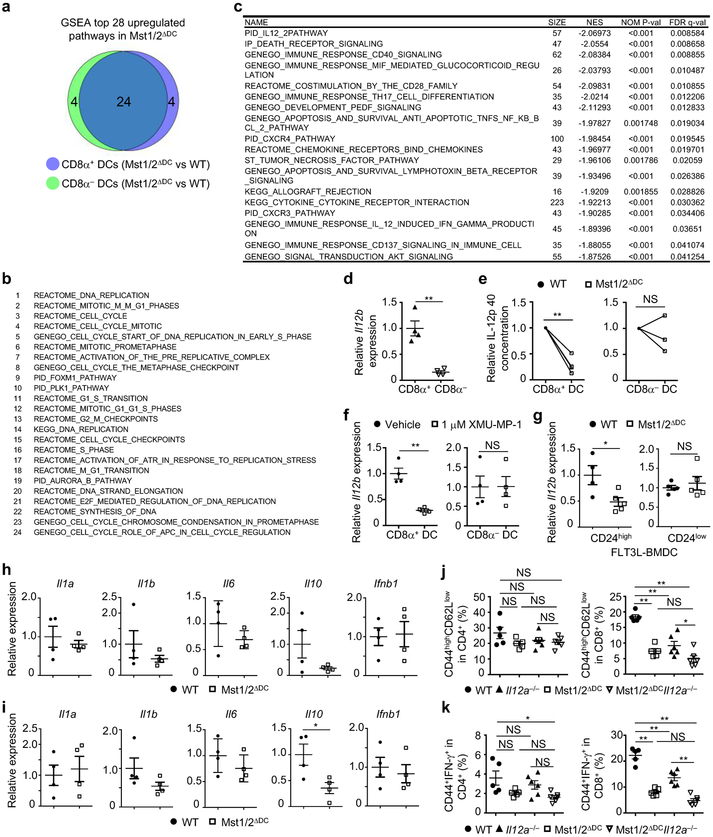
To identify additional mechanisms, we compared gene expression profiles of CD8α+ or CD8α− DCs from WT and Mst1/2ΔDC mice via gene-set enrichment analysis (GSEA). The majority of the significantly upregulated pathways due to Mst1/2 deficiency were shared between CD8α+ and CD8α− DCs (Fig. 4a and Extended Data Fig. 9a, b). In contrast, Mst1/2-deficient CD8α+ DCs had 18, while CD8α− DCs had no significantly downregulated pathways (Fig. 4a and Extended Data Fig. 9c). IL-12 signaling was the most significantly downregulated gene-set in Mst1/2-deficient CD8α+ DCs (Fig. 4b and Extended Data Fig. 9c). Il12b (encoding IL-12 p40) was much higher in WT CD8α+ relative to CD8α− DCs (Extended Data Fig. 9d), but its expression was considerably dampened by Mst1/2 deficiency (Fig. 4c). Additionally, IL-12 p40 or Il12b expression was diminished in CD8α+ DCs upon deletion or inhibition of Mst1/2 (Extended Data Fig. 9e, f) and FLT3L-cultured CD24high BMDCs lacking Mst1/2 (Extended Data Fig. 9g), while other cytokine genes were expressed normally (Extended Data Fig. 9h, i). Hence, Mst1/2 promote IL-12 expression in CD8α+ DCs.
Figure 4. Mst1/2 orchestrate selective expression of IL-12 in CD8α+ DCs via crosstalk with non-canonical NF-κB signaling.
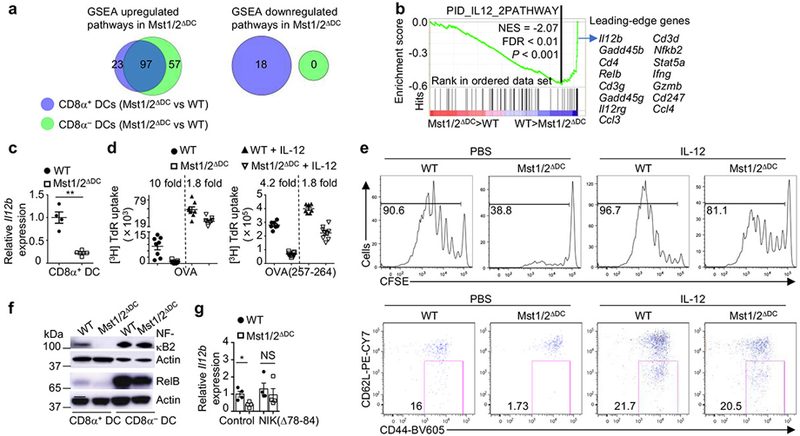
a, Venn diagram showing the overlap of significantly upregulated or downregulated pathways by GSEA analysis between CD8α+ and CD8α− DCs. b, Underrepresentation of IL-12 pathway in Mst1/2-deficient CD8α+ DCs. NES, normalized enrichment score. c, Il12b expression in CD8α+ DCs from WT and Mst1/2ΔDC mice (n = 4 per genotype). d, Thymidine incorporation of OT-I T cells cultured with OVA protein- or OVA(257-264) peptide-pulsed CD8α+ DCs with or without IL-12 (left, n = 8 from 3 WT mice, n = 9 from 3 Mst1/2ΔDC mice; right, n = 7 from 3 WT mice, n = 9 from 3 Mst1/2ΔDC mice). The numbers above the graph are the relative ratios of WT vs Mst1/2ΔDC DC groups. e, CFSE dilution (left) and CD62L/CD44 expression (right) of transferred OT-I T cells in OVA-immunized mice. f, NF-κB2 (p100) and RelB expression in DCs. g, Relative Il12b expression in WT or Mst1/2-deficient CD24high FLT3L-BMDCs transduced with control or NIK(Δ78-84) (n = 4 mice per group). Error bar indicates SEM. *P < 0.05; **P < 0.01; two-tailed unpaired Student’s t-test in c, g. Data summarize two (c–f) or three (g) independent experiments.
IL-12 serves as ‘signal 3’ for CD8+ T-cell activation16, although its role in T-cell homeostasis is less understood. In Il12a−/− mice, CD8+ but not CD4+ T cells had reduced effector/memory population and IFN-γ-producing cells, which were also observed in Mst1/2ΔDC and Mst1/2ΔDCIl12a−/− mice (Extended Data Fig. 9j, k), highlighting critical roles of Mst1/2 and IL-12 in CD8+ T-cell homeostasis. Moreover, Il12a−/− CD8α+ DCs were impaired in priming CD8+ T cells (Extended Data Fig. 10a), similar as Mst1/2-deficient cells. Importantly, adding exogenous IL-12 to Mst1/2-deficient CD8α+ DCs in vitro rectified, albeit incompletely, their ability to induce OT-I T-cell proliferation (Fig. 4d), and IL-12 treatment in vivo promoted proliferation and CD44 upregulation of OT-I T cells in Mst1/2ΔDC mice (Fig. 4e). Therefore, Mst1/2-mediated IL-12 expression contributes to CD8α+ DC function in mediating CD8+ T-cell homeostasis and priming.
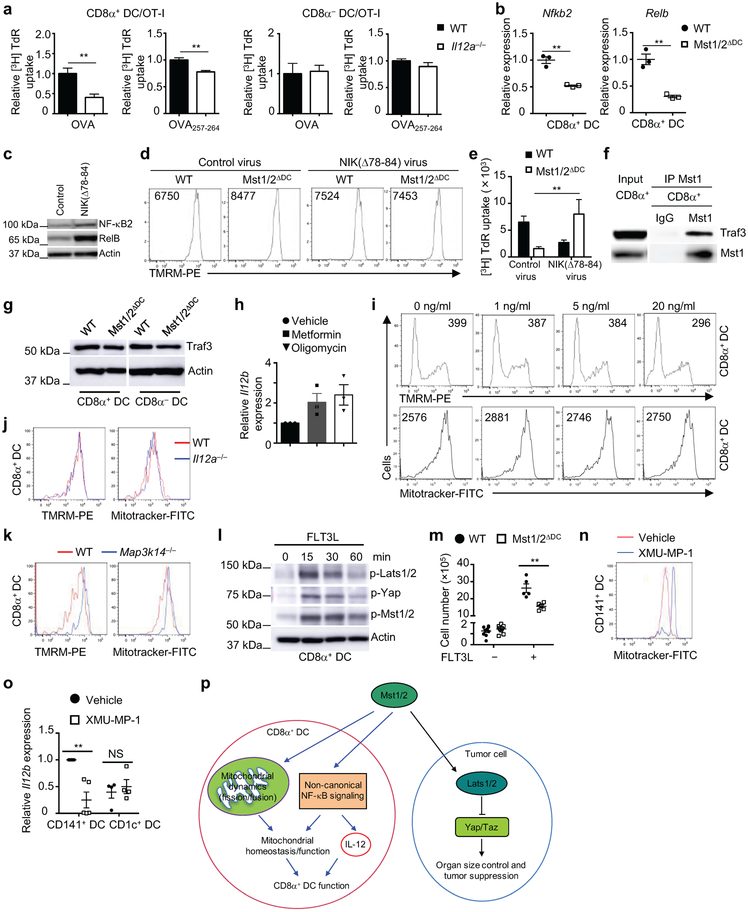
How do Mst1/2 regulate IL-12 expression? Mst1/2-deficient CD8α+ DCs had reduced expression of NF-κB2 and RelB, which are involved in the non-canonical NF-κB pathway17 (Fig. 4b, f and Extended Data Fig. 10b). A critical mediator of this pathway is NF-κB-inducing kinase (NIK), which functions in DCs to drive IL-12 production and CD8+ T-cell priming18. Ectopic expression of constitutively active NIK(Δ78-84)19 in FLT3L-cultured BMDCs promoted NF-κB2 and RelB expression in WT CD24high BMDCs (Extended Data Fig. 10c), and largely rescued the impaired expression of Il12b in Mst1/2-deficient cells (Fig. 4g). Moreover, expression of NIK(Δ78-84) corrected the abnormal mitochondrial membrane potential of Mst1/2-deficient CD24high BMDCs (Extended Data Fig. 10d), and increased the ability of these cells to prime CD8+ T cells (Extended Data Fig. 10e). Further, Traf3, a key regulator of non-canonical NF-κB/NIK signaling17, interacted with Mst1 in CD8α+ DCs (Extended Data Fig. 10f), although Traf3 expression was unaltered by Mst1/2 deficiency (Extended Data Fig. 10g). Collectively, Mst1/2 promote the non-canonical NF-κB pathway for IL-12 production and CD8α+ DC function.
Given the roles of Mst1/2 in mitochondrial metabolism and IL-12 signaling, we examined whether mitochondrial metabolism is required for IL-12 production. Treatment of CD8α+ DCs with metformin or oligomycin increased, but not decreased, IL-12 expression (Extended Data Fig. 10h). Also, CD8α+ DCs treated with exogenous IL-12 or deficient in IL-12 had normal mitochondrial profiles (Extended Data Fig. 10i, j). However, NIK-deficient CD8α+ DCs had abnormal mitochondrial membrane potential and mass (Extended Data Fig. 10k). Hence, mitochondrial profiles and IL-12 expression are largely discrete events coordinately regulated by Mst1/2, although defective non-canonical NF-κB signaling can alter mitochondrial homeostasis.
We explored regulation of Mst1/2 signaling in CD8α+ DCs. FLT3L, which promotes DC development and expansion1, activated Mst1/2 and downstream signaling in CD8α+ DCs (Extended Data Fig. 10l). Additionally, Mst1/2 deficiency impaired FLT3L-induced expansion of CD8α+ DCs (Extended Data Fig. 10m), indicating a role of Mst1/2 in mediating FLT3L function. Next, we determined whether our findings in the murine system could extend to human cells. Mst1/2 inhibitor altered mitochondrial mass and impaired IL-12 expression of human CD141+ DCs (Extended Data Fig. 10n, o), which are functionally equivalent to murine CD8α+ DCs20. Therefore, Mst1/2 activity represents an evolutionarily conserved mechanism to orchestrate DC function.
By integrating systems biology approach with experimental investigation, our work identifies Mst1/2 as crucial and selective regulators of CD8α+ DC function and metabolism. Our NetBID algorithm demonstrates the advantage over conventional methods to successfully identify ‘hidden’ kinase drivers from high-throughput profiles, which can be extended to other drivers and biological questions. Mechanistically, we define a non-canonical Hippo signaling pathway (Mst1/2-dependent but Lats1/2- and Yap/Taz-independent) that coordinates mitochondrial activity and non-canonical NF-κB and cytokine signaling in CD8α+ DCs (Extended Data Fig. 10p). These results highlight that metabolic state and mitochondrial activity of DC subsets support their functional capacity, and point to a previously unappreciated mechanism in orchestrating DC subset function. Capitalizing on DC subset-specific Mst1/2 signaling and metabolic regulation, strategies that modulate these activities represent attractive means of therapeutic intervention of cancer and immune-mediated diseases.
METHODS
Mice
C57BL/6, CD45.1+, OT-I, OT-II, Batf3−/−, B2m−/−, Il12a−/−, Mtorfl, Map3k14−/−, Lats1fl, Lats2fl, and CD11c-Cre mice were purchased from The Jackson Laboratory. Stk4fl and Stk3fl mice were kindly provided by Randy Johnson 21, and Yapfl and Tazfl mice were kindly provided by Eric Olson22. The mice have been backcrossed to the C57BL/6 background and were used at 8-12 weeks old. All of the genetically modified mice were viable and developed normally. For mixed bone marrow (BM) chimera generation, BM cells from WT or Mst1/2ΔDC CD45.2.2+ mice were mixed with cells from CD45.1.2+ mice at a 1:1 ratio and transferred into lethally irradiated (11 Gy) CD45.1.1+ mice, followed by reconstitution for 6-8 weeks, as described previously23. In certain experiments, BM cells from WT or Mst1/2ΔDC CD45.2.2+ mice were transferred into lethally irradiated (11 Gy) CD45.1.1+ mice. For chimeras used in Fig. 2c, BM cells from WT or Mst1/2ΔDC CD45.2.2+ mice were mixed with BM cells from Batf3−/− mice at a 1:1 ratio and transferred into lethally irradiated (11 Gy) CD45.1.1+ mice. All mice were kept in a specific pathogen-free facility in the Animal Resource Center at St. Jude Children’s Research Hospital. Animal protocols were approved by the Institutional Animal Care and Use Committee of St. Jude Children’s Research Hospital.
Cell purification
Mouse spleens were digested with Collagenase D (Worthington) and CD11c+ DCs were enriched using CD11c MicroBeads (Miltenyi Biotec) according to manufacturer's instructions. Enriched cells were stained and sorted for CD8α+ DCs (CD11c+CD8α+CD205+TCRβ−CD19−CD49b−B220−) and CD8α− DCs (CD11c+CD8α−CD205−TCRβ−CD19−CD49b−B220−) on a Reflection cell sorter (i-Cyt). Lymphocytes from spleen and peripheral lymph nodes were sorted for naïve CD4+ T cells (CD4+CD62LhiCD44loCD25−) and naïve CD8+ T cells (CD8+CD62LhiCD44loCD25−). The antibodies used for sorting were listed below: anti-TCRβ-FITC (H57-597), anti-CD8-PE (53-6.7), anti-CD19-FITC (eBio1D3 (1D3)), anti-B220-FITC (RA3-6B2), anti-CD49b-FITC (DX5), anti-CD11c-PB (N418), anti-CD205-APC (205yekta), anti-CD4-PB (RM4-5), anti-CD25-FITC (PC61.5), anti-CD44-APC (IM7) and anti-CD62L-PE-CY7 (MEL-14) (all from eBioscience); and anti-CD8-BV421 (53-6.7, Sony Biotechnology Inc).
Human DC isolation, real-time PCR and mitochondrial profile assays
Peripheral blood mononuclear cells (PBMCs) were purified from blood using Ficoll (MP Biomedicals) and enriched for total DCs by immuno-depletion. Briefly, Fc blocker (Miltenyi Biotec) and FITC-Lineage Cocktail 1 antibodies (BD Biosciences) were added to cells and incubated at 4°C for 20 min, followed by adding anti-mouse IgG MicroBeads and negative enrichment (Miltenyi Biotec). Flow-through was collected and stained with anti-HLA-DR-PE-CY7 (LN3), anti-CD1c-PB (L161) (both from BioLegend), anti-CD141-BV605 (1A4, BD Biosciences), and anti-CD370-APC (8F9, Miltenyi Biotec), and Lin−HLA-DR+CD1c+ cells (CD1c+ DCs, equivalents to mouse CD8α− DCs) and Lin −HLA-DR+CD141+CD370+ cells (CD141+ DCs, equivalents to mouse CD8α+ DCs) were sorted24. Sorted DCs were treated with vehicle or 1 μM Mst1/2 inhibitor (XMU-MP-1)25 (Selleckchem) for 4 h, and RNA was extracted for reverse transcription and real-time PCR using SYBR Green (Thermo Fisher Scientific). The sequences for human IL-12 p40 primers were as following: forward primer 5’->3’, GACATTCTGCGTTCAGGTCCAG; reverse primer 5’->3’, CATTTTTGCGGCAGATGACCGTG. For mitochondrial mass analysis, DCs were treated with vehicle or 1.5 μM Mst1/2 inhibitor (XMU-MP1)25 for 4 h at 37°C and Mitotracker staining was performed according to the manufacturer’s instructions (Invitrogen). All human studies were in compliance with the Declaration of Helsinki. Blood donors were recruited by the Blood Donor Center at St. Jude Children’s Research Hospital. Blood donors provided written consent for their blood products not used in transfusions to be used for research. This consent form has been reviewed and approved by the Institutional Review Board at St. Jude Children’s Research Hospital.
In vitro BM-derived DCs
BM cells were flushed from mouse tibias and femurs, and red blood cells were lysed using ACK lysis buffer. For FLT3L-BMDCs, BM cells were cultured in RPMI-1640 medium (plus β-mercaptoethanol) containing 10% (vol/vol) FBS and 1% (vol/vol) penicillin-streptomycin (complete RPMI-1640 medium) and mouse FLT3L (200 ng/ml) for 9.5-11.5 days. For GM-CSF-BMDCs, BM cells were cultured in complete RPMI-1640 medium and mouse GM-CSF (20 ng/ml) and IL-4 (5 ng/ml) for 7.5-9.5 days. Loosely adherent cells were collected for analysis.
Antigen challenge
Antigen-specific T cells from OT-I (CD45.1+; 1×10⁶) TCR-transgenic mice were sorted and labeled with CFSE, and transferred into WT and Mst1/2ΔDC mice intravenously. Twenty-four hours later, the mice were injected i.v. with 30 μg OVA (low Endo™, Worthington). Three days after OVA immunization, spleen and peripheral lymph nodes were isolated for further analyses. For in vivo IL-12 treatment, 2 μg IL-12/mouse was injected i.p. each day for three consecutive days started from 24 h post OT-I CD8+ T-cell transfer.
Tumor model
MC38 colon adenocarcinoma cells were cultured in DMEM supplemented with 10% (vol/vol) FBS and 1% (vol/vol) penicillin-streptomycin. WT and Mst1/2ΔDC-derived BM chimera mice were injected subcutaneously with 5×10⁵ MC38 cells in the right flank. Tumors were measured regularly with calipers. Tumor volumes were calculated using the formula: length × width × width × π/6. To prepare tumor infiltrating lymphocytes, tumor tissues were excised, minced and digested with 0.5 mg/ml Collagenase IV (Roche) + 200 U/ml DNase I (Sigma) for 1 h at 37°C. Tumor infiltrating lymphocytes were then isolated by density-gradient centrifugation over Percoll (Life Technologies).
Listeria monocytogenes-OVA infection model
Mice were i.v. infected with 3×10⁴ colony-forming units (CFUs) of L. monocytogenes expressing the chicken ovalbumin (LM-OVA), and were bled at the indicated days post infection to collect cells for analysis.
Flow cytometry
Flow cytometry was performed as described previously23, with the following antibodies: anti-IL-4-APC (11B11), anti-H-2Kb-APC (AF6-88.5.5.3), anti-CD70-PE (FR70), anti-TCRβ-APC-CY7 (H57-597), anti-IFN-γ-PE-CY7 (XMG1.2), anti-CD44-APC (IM7), anti-CD62L-PE-CY7 (MEL-14), anti-CD44-APC-CY7 (IM7), anti-CD44-FITC (IM7), anti-CD11c-PE (N418), anti-CD205-APC (205yekta), anti-CD40-PE (1C10), anti-MHC-II-APC-CY7 (M5/114.15.2), anti-CD80-APC (16-10A1), anti-CD86-FITC (GL1), anti-4-1BBL-PE (TKS-1), anti-OX40L-APC (RM134L), anti-PD-L1-PE (MIH5), anti-LAG3-PE (eBioC9B7W) and anti-CD11c-PE-CY7 (N418) (all from eBioscience); anti-CD44-BV650 (IM7), anti-CD11b-BV650 (M1/70), anti-IL-17A-BV421 (TC11), anti-PD-1-BV421 (29F.1A12), anti-TIM3-APC (B8.2c12) and anti-CD4-BV711 (RM4-5) (all from Biolegend); anti-IL-2-PE (JES6-5H4, BD Biosciences); and anti-CD8-BV605 (53-6.7, Sony Biotechnology Inc). For intracellular cytokine detection, cells were stimulated for 4 to 5 h with phorbol 12-myristate 13-acetate (PMA) and ionomycin in the presence of monensin before staining according to the manufacturer’s instructions (BD Biosciences). Mitotracker and Tetramethylrhodamine, methyl ester (TMRM) staining was performed according to the manufacturer’s instructions (Invitrogen). Flow cytometry data were acquired on LSRII or LSR Fortessa (BD Biosciences) and analyzed using FlowJo software (Tree Star).
Antigen presentation assays
For in vitro assays, CD8α+ and CD8α− DCs were sorted from spleen, pulsed with 500 μg/ml OVA, 250 pg/ml OVA257-264 or 3 μg/ml OVA323-339 peptide for 1 h, then washed twice and cultured with naïve CD4+ T cells from OT-II mice or naïve CD8+ T cells from OT-I mice for 3 days. Thymidine was added to the culture 7-8 h before harvest to measure cell proliferation. When indciated, DCs were pretreated with 0.2 μM M1 26 + 0.1 μM Mdivi-127 for 4 h before co-culture with T cells. For in vivo assays by DC transfer method, FLT3L (10 μg/ml in 100 μl PBS) was s.c. injected once daily to WT or Mst1/2ΔDC mice for 9 consecutive days28, and then CD8α+ and CD8α− DCs were sorted and pulsed with 20 mg/ml OVA for 1.5 h, washed and i.v. injected to B2m−/− mice that had received CFSE-labeled CD8+ OT-I (CD45.1+) T cells the day before. B2m−/− mice were sacrificed 3 days after DC immunization, and CFSE dilution of CD8+ OT-I T cells was examined by flow cytometry. In vivo cross-presentation assay using tetramer detection methods was performed according to previous reports29,30. Briefly, B2m−/− splenocytes were osmotically loaded with 10 mg/ml OVA (Worthington Biochemical Corporation), washed, irradiated at 13.5 Gy, and 1.5×10⁷ cells were i.v. injected to mice. After 8 days, spleens were harvested and analyzed by Kb-OVA tetrameter staining.
RNA and immunoblot analyses
Real-time PCR analysis was performed as previously described with primers and probe sets from Applied Biosystems31. Immunoblots were performed and quantified as described previously12, using the following antibodies: NF-κB2 (#4882), RelB (#4954), p-Mst1/2 (#3681), p-Yap (Ser127) (D9W2I), Lats1 (C66B5), Mst1 (D8B9Q), Mst2 (#3952), Actin (8H10D10), p-DRP1 (Ser637) (#4867), p-S6 (2F9), c-Myc (#9402s) (all from Cell Signaling Technology), OPA1 (NB110-55290SS, Novus Biologicals) and MitoProfile® Total OXPHOS Rodent WB Antibody Cocktail (MS604, MitoSciences).
Co-immunoprecipitation of Mst1 associated complexes from splenic CD8α+ DCs
WT splenic CD8α+ DCs (after in vivo FLT3L expansion to obtain sufficient cells) were lysed in lysis buffer (25 mM Tris-HCl pH 7.5, 130 mM NaCl, 20 mM NaF, 1% Triton X-100, 2 mM EDTA) and pre-cleaned via incubating with 40 μl Protein A/G beads (50% vol/vol slurry, sc-2003) for 2 h. The Mst1 associated complexes were immunoprecipitated with Mst1 antibody (EP1465Y, Abcam), which had pre-coupled with Protein A/G Sepharose beads for 4 h at 4°C. After 3 times of wash with the lysis buffer, the immune complexes were analyzed by immunoblotting with PRA Cα/β (#515741, R&D), Traf3 (#4729, Cell Signaling Technology), and Mst1 antibodies.
Super resolution fluorescence microscopy
Stochastic optical reconstruction microscopy (STORM) was performed as recently described32. Briefly, sorted DC subsets were seeded onto Poly-L-Lysine coated chamber slides (Ibidi USA) and allowed to settle for 30 min prior to fixation with 4% paraformaldehyde followed by treatment with sodium borohydride to quench free reactive groups. Cells were permeabilized for 3 min in buffer (50 mM Tris-HCl, pH 8.0, 50 mM NaCl) containing 0.1% Triton-100 prior to blocking in buffer containing 2% BSA and 0.05% Tween-20. Samples were incubated overnight in TBS buffer containing BSA and anti-Tom20 (Santa Cruz; sc-11415, 1:500 dilution) and subsequently detected with CF647 labeled secondary antibody (Biotium). Three-dimensional STORM acquisition was facilitated using an N-STORM system (Nikon Instruments) comprised of a 100× 1.49NA TIRF objective and an astigmatic lens inserted into the light path, before collection using an iXon DU897 ultra EMCCD camera with frame rate of 109 f.p.s. and EM gain of 17 mHz at 16 bit, as previously described32. Images were processed using algorithms as previously described33 and incorporated into Elements imaging software (Nikon Instruments).
Transmission electron microscopy
Sorted DC subsets were pelleted by centrifugation and fixed in 0.1 M sodium cacodylate buffer, pH 7.4, containing 2.5% glutaraldehyde and 2% paraformaldehyde. Samples were post-fixed in 2% osmium tetroxide in 0.1 M cacodylate buffer with 0.15% potassium ferrocyanide, followed by dehydration to propylene oxide and embedding in epoxy resin. TEM images of ultrathin (80 nm) sections were acquired using a FEI Tecnai 20 200 KV FEG electron microscope.
Metabolic assays via Seahorse
Oxygen consumption rates (OCR) and extracellular acidification rates (ECAR) were measured in XF media under basal conditions and in response to 1 μM oligomycin, 1.5 μM fluoro-carbonyl cyanide phenylhydrazone (FCCP) and 500 nM rotenone using an XF96 Extracellular Flux Analyzer (EFA) (Seahorse Bioscience).
Whole and phosphoproteome profiling by multiplex TMT-LC/LC-MS/MS
Protein extraction, digestion, labeling and pooling
Whole and phosphoproteome profiling was performed as recently described34. CD8α+ and CD8α− DCs were sorted from WT spleen as described above. Cells were washed twice with ice cold PBS and cell pellets from 6 samples (n = 3 per cell type) were lysed in fresh lysis buffer (50 mM HEPES, pH 8.5, 8 M urea and 0.5% sodium deoxycholate) respectively. The protein concentration of lysate was quantified by BCA protein assay (Thermo Fisher Scientific). Proteins (100 μg) from each sample were loaded and run on a 10% SDS-PAGE gel until all samples were inside of the gel. The gel was stained and each sample was sliced and further chopped into 1 mm3 pieces. After gel detaining, the proteins were reduced with 5 mM dithiothreitol at 37°C for 30 min and alkylated with 10 mM iodoacetamide at room temperature in the dark for 30 min. Proteins were then digested in-gel with trypsin in 50 mM HEPES overnight at 37°C and the protein to trypsin ratio (w/w) was 50:1. Peptides for each sample were extracted, dried and labeled with 6-plex TMT reagents following manufacturer’s instruction. Finally, the TMT labeled samples were equally mixed.
Offline basic pH reverse phase liquid chromatography
The mixture of the 6 TMT-labeled samples was desalted, dried and solubilized in 60 μl of buffer A (10 mM ammonium formate, pH 8) and separated on an XBridge C18 column (3.5 μm particle size, 4.6 mm × 25 cm, Waters) into 44 fractions with an 88 min gradient from 15% to 45% buffer B (95% acetonitrile, 10 mM ammonium formate, pH 8, flow rate of 0.4 ml/min). Each fraction was dried for whole proteome analysis.
Acidic pH reverse phase liquid chromatography coupled with tandem MS
The analysis was performed based on our optimized platform35. For whole proteome analysis, the dried peptides were reconstituted in 5% formic acid, loaded on a reverse phase column (75 μm × 30 cm, 1.9 μm C18 resin (Dr. Maisch GmbH, Germany)) interfaced with a Q-Exactive HF mass spectrometer (ThermoFisher Scientific). Peptides were eluted by 12-36% buffer B gradient in 2.5 h (buffer A: 0.2% formic acid, 3% DMSO; buffer B: buffer A plus 67% acetonitrile, flow rate of 0.25 μl/min). The column was heated at 65°C by a butterfly portfolio heater (Phoenix S&T) to reduce backpressure. Mass spectrometer was operated in data-dependent mode with a survey scan in Orbitrap (60,000 resolution, 1×10⁶ AGC target and 50 ms maximal ion time) and 20 MS/MS high resolution scans (60,000 resolution, 1×10⁵ AGC target, 105 ms maximal ion time, HCD, 35 normalized collision energy, 1.0 m/z isolation window, and 20 s dynamic exclusion). All raw data are available upon request and will be deposited in public databases upon manuscript acceptance.
Proteomics data analysis
The analysis was performed by our in-house JUMP search engine which has been used in the data processing of numerous publications34. Briefly, acquired MS/MS raw files were converted into mzXML format and searched by the JUMP algorithm against a composite target/decoy database to estimate FDR. The target protein database was downloaded from the Uniprot mouse database (52,490 protein entries) and the decoy protein database was generated by reversing all target protein sequences. Searches were performed with 10 ppm mass tolerance for both precursor ions and product ions, fully tryptic restriction, two maximal missed cleavages and the assignment of a, b, and y ions. TMT tags on lysine residues and peptide N termini (+229.162932 Da) and carbamidomethylation of cysteine residues (+57.021 Da) were used for static modifications and oxidation of methionine residues (+15.99492 Da) were used for dynamic modification. The assigned peptides were filtered by mass accuracy, minimal peptide length, matching scores, charge state and trypticity to reduce protein FDR to below 1%.
TMT-based protein quantification
The analysis was performed by in-house JUMP software suite as previously reported13. In brief, TMT reporter ion intensities of each PSM were extracted and the PSMs with very low intensity were removed. The raw intensities were then corrected based on isotopic distribution of each labeling reagent and loading bias. The mean-centered intensities across samples were calculated and protein relative intensities were derived by averaging related PSMs. Finally, protein absolute intensities were determined by multiplying the relative intensities by the grand-mean of three most highly abundant PSMs.
Gene expression profiling and bioinformatics analysis
Total, CD8α+ and CD8α− DCs (n = 4 per genotype) were isolated from spleen as described above. RNA was obtained with an RNeasy Micro Kit according to the manufacturer’s instructions (Qiagen). RNA samples were then analyzed with the Mouse Gene 2.0 ST Signals array. Differentially expressed transcripts were identified by ANOVA (Partek Genomics Suite version 6.5), and the Benjamini-Hochberg method was used to estimate the FDR as described36. GSEA was performed as described36.
Batch effects removal of combined gene expression data
We combined multiple batches of microarray gene expression profiles of total (n = 15), CD8α+ (n = 4) and CD8α− (n = 4) DCs, and removed batch effects by using ‘removeBatchEffect’ function in limma37. PCA plot of the corrected microarray profiles (Extended Data Fig. 1a) indicated significant differences among the three groups of DCs.
NetBID algorithm
We and others have demonstrated that important signaling proteins might not change at individual mRNA expression levels6,7,38, and existing network-based methods6,7,38–41 to infer master regulators are largely based on transcriptomics data only. In order to identify the true underlying signaling drivers of CD8α+ DCs in an unbiased and systematic manner, we developed the data-driven Network-based Bayesian Inference of Drivers (NetBID) algorithm by integrating transcriptomics (mRNA), whole proteomics (wProtein) and phosphoproteomics (pProtein) data. First, we collected a cohort of baseline transcriptomics profiles of total DCs and reverse engineered a DC-specific signaling interactome or DCI, using an improved version of ARACNE42, an information theory-based algorithm for regulatory network inference. The data-driven DCI resulted in 20,846 nodes and 660,929 edges. Second, we focused on kinase signaling networks in DCI and calculated activity scores of all kinase candidates (n = 289 present in all three platforms) in mRNA, wProtein and pProtein profiles of CD8α+ and CD8α− DCs using z-normalization and z-statistic43,44. We then used a Bayesian linear modeling approach45 to identify differentially activated kinases by comparing profiles of CD8α+ with CD8α− DCs at mRNA, wProtein and pProtein levels separately. Finally, we integrated three differential activity scores by unsigned Stouffer’s method46 and identified 36 kinase drivers that were differentially activated between CD8α+ and CD8α− DCs at mRNA, wProtein and pProtein levels with cutoffs of FDR at 0.01 and network size at 50. Remarkably, most of the 36 kinases themselves had little changes between CD8α+ and CD8α− DCs or even reduced in CD8α+ DCs, and would likely be missed by conventional differential expression approaches. Mst1 and a few other Hippo kinases were confirmed to have higher activity in CD8α+ DCs, indicating the power of NetBID to identify ‘hidden’ drivers.
Signaling pathway enrichment of identified kinase drivers
To identify any known signaling pathways enriched by the 36 NetBID-inferred kinase drivers of CD8α+ DCs, we used Fisher’s exact test against all pathways with ‘SIGNALING’ in their names from MSigDB47 (v6.0). We manually curated the Hippo signaling kinases using the latest literature9 as we observed a significant number of known Hippo kinases present in the 36 kinase driver list, which turned out to be more significant than all existing signaling pathways in the database. This also suggests the limitation of knowledge-based pathway databases.
Retroviral generation and transduction of FLT3L-BMDCs
Retroviruses were produced by transfection of Plat-E cells with an empty pCLXSN (GFP) vector or the same vector encoding NIK(Δ78-84) mutant, along with pCL-Eco packaging vectors. NIK(Δ78-84) lacks Traf3-binding motif and is potent in activating the non-canonical NF-κB pathway19. BM cells were cultured with FLT3L for 1 day, then cells were 'spin-infected' (2,500 rpm) for 180 min at 30°C. After spin, fresh DC medium containing FLT3L was added to the cells and cells were cultured according to standard procedure described above.
Statistical analysis for small-scale immunological experiments
Data were analyzed using Prism 6 software (GraphPad) by two-tailed Student’s t-test or one-way or two-way ANOVA as noted in figure legends. P < 0.05 was considered significant. Data are presented as mean ± s.e.m.
Software and data availability
NetBID software package is available at https://github.com/jyyulab/NetBID. Microarray data are available via Gene Expression Omnibus under accession number GSE100772. Proteomics data are available via ProteomeXchange (http://www.proteomexchange.org/) with identifier PXD006875.
Extended Data
Extended Data Figure 1. NetBID analysis for the reconstruction of DC signaling interactome (DCI), network and enrichment analyses of top kinase drivers, and identification and validation of Stk4 (Mst1) regulons.
a, PCA plot of baseline microarray gene expression profiles of total DCs (blue, n = 15; used for de novo DCI reconstruction), CD8α+ and CD8α− DCs (green and red, respectively, n = 4 each; used for differential expression analysis) after removal of batch effects. b, Top 36 hub kinases that are differentially activated in CD8α+ relative to CD8α− DCs inferred by NetBID. Left, the NetBID panel indicates the significance level (color coded by z score; labeled values are P values) of the driver network in integrated analysis, transcriptomics (mRNA), whole proteomics (wProtein) and phosphoproteomics (pProtein) data, respectively. Right, differential expression of the drivers (color coded by z score; labeled values are signed fold changes). The Venn diagram shows the enrichment of Hippo pathway kinases in the top putative kinase drivers. c, Network interactions of top 36 kinase drivers of CD8α+ DCs. d, Top signaling pathways enriched by 36 NetBID-inferred kinase drivers (P < 0.01, number of overlapped genes > 2). e, Known kinases in Hippo signaling (Meng Z et al, Genes Dev. 30:1–17, 2016) and analysis by NetBID. f, Stk4-mediated gene network (n = 140) from DCI computationally inferred from baseline gene expression profiles of total DCs by NetBID. The width of an edge is proportional to the pairwise mutual information of connected nodes. g, h, Enrichment of predicted Mst1 signaling regulons (f) in differentially expressed genes between Mst1/2-deficient (Mst1/2ΔDC) and Wild-type CD8α+ DCs (g) or CD8α− DCs (h). Pval.GSEA indicates the P value of GSEA; Pval.Stk4 and FC.Stk4 indicate the P value and signed fold change of Stk4 expression (insert).
Extended Data Figure 2. T-cell homeostasis in mice with DC-specific deletion of Hippo pathway genes.
a, b, Total cellularity (a) or T-cell numbers (TCRβ+CD8+ and TCRβ+CD4+) (b) of the spleen, peripheral lymph nodes (PLN) and mesenteric lymph nodes (MLN) of WT and Mst1/2ΔDC mice (n = 5 mice per genotype). c, Flow cytometry analysis of splenic CD4+ and CD8+ T-cell populations (upper) and frequencies of total CD4+ and CD8+ T cells in spleen, PLN and MLN (lower) of WT and Mst1/2ΔDC mice (n = 8 mice per genotype). d, CD44 and CD62L expression on splenic CD4+ and CD8+ T cells of WT and Mst1/2ΔDC mice. e, CD44 and IFN-γ expression in splenic CD4+ and CD8+ T cells. f–k, Flow cytometry analysis of CD4+ and CD8+ populations, expression of CD44 and CD62L, or CD44 and IFN-γ in CD4+ and CD8+ T cells from spleen of WT and Lats1/2ΔDC (f–h) or Yap/TazΔDC mice (i–k). l–n, Frequencies of CD44hlghCD62Llow effector/memory cells (l) and CD44+IFN-γ+ cells (m) in splenic CD4+ and CD8+ T cells and frequencies of splenic CD4+ and CD8+ T cells (n) of WT (n = 9), Cd11cCreStk4fl/flStk3+/+ (n = 5), Cd11cCreStk4+/+Stk3fl/fl (n = 4), Cd11cCreStk4fl/+Stk3fl/fl (n = 5) and Cd11cCreStk4fl/flStk3fl/+ (n = 4) mice. Numbers in quadrants or gates indicate percentage of cells. Error bar indicates SEM. NS, not significant; *P < 0.05; **P < 0.01; two-tailed unpaired Student’s t-test in a–c; one-way ANOVA in l–n. Data summarize two (i–k), three (f–h), four (a, b, d, e), six (c) or eight (l–n) Independent experiments.
Extended Data Figure 3. Analysis of Mst1 and Mst2 deletion in DCs and lymphocytes from Mst1/2ΔDC mice and T-cell homeostatic status in mixed bone marrow (BM) chimeras.
a, Realtime PCR (upper and middle) and immunoblot (lower) analyses of Stk4 and Stk3 mRNA and protein expression in CD4+ T cells, CD8+ T cells and B cells from WT and Mst1/2ΔDC mice (n = 3 mice per genotype). b, Real-time PCR analysis ofMst1 and Mst2 expression in splenic CD8α+ and CD8α− DCs from WT and Mst1/2ΔDC mice (n = 3 for accessing Mst2 expression in Mst1/2-deficient CD8α+ DCs, n = 4 for others). c, d, BM cells from WT or Mst1/2ΔDC CD45.2.2+ mice were mixed with cells from CD45.1.2+ (spike) mice at a 1:1 ratio and transferred into lethally irradiated CD45.1.1+ mice. After 6-8 weeks, BM chimeras were analyzed for the expression of CD44, CD62L and IFN-γ (c) and frequencies of CD44highCD62Llow effector/memory cells and CD44+IFN-γ+ cells (d) in splenic CD8+ T cells derived from WT or Mst1/2ΔDC donor BM cells (CD45.2.2+) or spike cells CD45.1.2+ (n = 5 mice per genotype). Numbers in quadrants indicate percentage of cells. Error bar indicates SEM. **P < 0.01; two-tailed unpaired Student’s t-test in a, b, d. Data summarize two (a, b) or three (c, d) independent experiments.
Extended Data Figure 4. In vivo T-cell responses in WT and Mst1/2ΔDC mice challenged with tumor, pathogen or cognate antigen.
a, b, Flow cytometry analysis of IFN-γ expression (left) and frequencies of IFN-γ+ cells (right) in CD8+ (a) and CD4+ (b) T cells from draining lymph node (DLN) and tumor tissues of WT and Mst1/2ΔDC mice challenged with MC38 tumor cells (n = 7 for WT, n = 5 for Mst1/2ΔDC for DLN; n = 4 for WT, n = 8 for Mst1/2ΔDC for tumor tissues). c, Flow cytometry analysis of PD-1 expression on CD8+ (upper) and CD4+ (lower) T cells from DLN and tumor tissues of WT and Mst1/2ΔDC mice challenged with MC38 tumor cells. d, Flow cytometry analysis of LAG3 and TIM3 expression of CD8+ (upper) and CD4+ (lower) T cells from DLN of WT and Mst1/2ΔDC mice challenged with MC38 tumor cells. e, Flow cytometry of H-2Kb-OVA+ CD8+ T cells in the blood from WT and Mst1/2ΔDC mice infected with LM-OVA. f, Flow cytometry (left) and frequencies (right) of IFN-γ+ and TNF-α+ cells of PMA and ionomycin-stimulated CD8+ T cells in the blood from WT and Mst1/2ΔDC mice infected with LM-OVA (n = 5 for WT, n = 4 for Mst1/2ΔDC). Numbers in quadrants or gates indicate percentage of cells. g, CFSE dilution of donor OT-I T cells in OVA-immunized mice. Numbers in quadrants or gates indicate percentage of cells. Error bar indicates SEM. *P < 0.05; **P < 0.01; two-tailed unpaired Student’s t-test in a, b, f. Data summarize two (a–e, g) independent experiments.
Extended Data Figure 5. Altered homeostasis of Mst1/2-deficient DCs.
A, Detailed gating strategy for flow cytometry of splenic conventional DCs (cDC), CD8α+ cDC (CD8α+CD11b−), CD8α− cDC (CD8α−CD11b+) and pDC populations in WT and Mst1/2ΔDC mice. MHC-II, MHC class II. B, Frequencies and cell numbers of splenic DC populations in WT and Mst1/2ΔDC mice as gated in a (n = 5 mice per genotype). C, Flow cytometry analysis of CD40, CD70, CD80, CD86, H-2Kb, MHC-II, 4-1BBL, OX40L and PD-L1 expression on splenic CD8α+ and CD8α− DCs as gated in a. d, Flow cytometry (left) of CD45.1.2+ BM cell-derived and CD45.2.2+ WT or Mst1/2ΔDC donor BM cell-derived splenic cDC, CD8α+ cDC, CD8α− cDC and pDC populations in mixed chimeras and frequencies (right) of CD8α+ cDCs in total cDCs and pDCs in spleen derived from WT or Mst1/2ΔDC donor BM cells in mixed chimeras (n = 5 mice per genotype). E, Normalized chimerism for the indicated DC subsets in mixed BM chimeras. The percentage of indicated DC subsets was normalized by that of B cells from same mice. The chimerism of WT was set as 1 (n = 5 mice per genotype). F, Flow cytometry analysis of donor (WT or Mst1/2ΔDC, CD45.2.2+) and spike (CD45.1.2+) BM cell percentages in the BM mixture before transfer. Numbers in gates indicate percentage of cells. Error bar indicates SEM. *P < 0.05; **P < 0.01; two-tailed unpaired Student’s t-test in b, d, e. Data summarize four (a–c) or three (d, e) independent experiments.
Extended Data Figure 6. Homeostasis of DCs after deletion of Hippo pathway genes.
A, Frequencies of splenic cDC, CD8α+ cDC, and pDC populations in WT (n = 9), Cd11cCreStk4fl/flStk3+/+ (n = 5), Cd11cCreStk4+/+Stk3fl/fl (n = 4), Cd11cCreStk4fl/+Stk3fl/fl (n = 5) and Cd11cCreStk4fl/flStk3fl/+ (n = 4) mice. b, c, Flow cytometry of splenic cDC, CD8α+ cDC, CD8α− cDC and pDC populations in WT and Lats1/2ΔDC (b), or Yap/TazΔDC (c) mice. Numbers in gates indicate percentage of cells. Data summarize two (b), three (c) or eight (a) independent experiments.
Extended Data Figure 7. Role of Mst1/2 in selectively programming functions of CD8α+ DCs and CD24hi FLT3L-BMDCs to prime CD8 T cells.
a, Frequency of CFSElow cells of donor OT-I T cells in WT (n = 5), Mst1/2ΔDC (n = 5), Batf3−/−: WT (n = 5) or Batf3−/−:Mst1/2ΔDC (n = 6) mixed chimeras immunized with OVA. b, CFSE-labeled OT-I T cells (CD45.1+) were transferred to B2m−/− mice followed by immunization one day later with OVA-pulsed CD8α+ or CD8α− splenic DCs isolated from WT or Mst1/2ΔDC mice (following DC expansion by FLT3L), and CFSE dilution of OT-I cells was examined 3 days after DC immunization. Shown are representative flow cytometry histogram of CFSE dilution and frequency of CFSElow cells in donor OT-I T cells (gated on CD45.1+CD45.2−) from spleen of B2m−/− mice (n = 4 for Mst1/2-deficient CD8α− DC, n = 3 for all others). c, d, CD8α+ (c) or CD8α− DCs (d) from WT and Mst1/2ΔDC mice were fed with 0 or 50 μg/ml soluble OVA conjugated with FITC for 1 h at 37°C or 4°C. Cells were then collected and OVA uptake was evaluated by flow cytometry. Numbers in graphs indicate the mean fluorescence intensity of OVA-FITC. e, Flow cytometry (upper) and quantification (lower, n = 4 per genotype) of apoptotic CD8α+ or CD8α− DCs examined by Annexin V (left) and active caspase 3 (right) staining in freshly isolated splenocytes from WT and Mst1/2ΔDC mice. f, CD8α+ (upper) or CD8α− DCs (lower) from WT and Mst1/2ΔDC mice were cultured overnight for analysis of cell viability by 7-AAD staining. Quantification of the percentage of 7-AAD negative live cells is shown (n = 3 per genotype). g, Thymidine incorporation of OT-II T cells cultured with OVA protein- or OVA(323-339) peptide-pulsed CD8α+ or CD8α− DCs (n = 13 derived from 5 mice for Mst1/2-deficient CD8α+ DC/OVA(323-339) group, n = 15 derived from 5 mice for all other groups). h–j, Thymidine incorporation of OT-I (left) or OT-II (right) T cells cultured with OVA protein-pulsed CD24high FLT3L-BMDCs (h), CD24low FLT3L-BMDCs (i), or GM-CSF-derived BMDCs (j) from WT and Mst1/2ΔDC mice for 72 h (n = 14 from 5 mice for Mst1/2-deficient GM-CSF-BMDC/OT-I group, n = 15 from 5 mice for all other groups). k, Relative thymidine incorporation of OT-I T cells cultured with OVA protein- or OVA(257-264) peptide-pulsed splenic CD8α+ DCs pretreated with vehicle or Mst1/2 inhibitor (XMU-MP-1) for 4 h. Thymidine incorporation of OT-I T cells cultured with vehicle-treated DCs in each group was set as 1 (n = 3 per group). l, Relative thymidine incorporation of OT-I T cells cultured with OVA protein- or OVA(257-264) peptide-pulsed CD8α+ DCs from WT and Lats1/2ΔDC mice (n = 14 derived from 5 mice for WT, n = 15 derived from 5 mice for Lats1/2ΔDC). Thymidine incorporation of OT-I T cells cultured with WT DCs in each group was set as 1. m, Relative thymidine incorporation of OT-I T cells cultured with OVA protein-pulsed WT or Yap/TazΔDC splenic CD8α+ DCs that were pre-treated with vehicle or Mst1/2 inhibitor (n = 3 derived from two mice per genotype). Thymidine incorporation of OT-I T cells cultured with vehicle-treated DCs was set as 1. Numbers in gates indicate percentage of cells. Error bar indicates SEM. *P < 0.05; **P < 0.01; two-tailed unpaired Student’s t-test in a, b, e–l; two-way ANOVA in m. Data summarize two (a–d, g–j), three (e, f, k, 1) or four (e) independent experiments.
Extended Data Figure 8. Analysis of mitochondrial profiles of Mst1/2-, Lats1/2- and mTOR-deficient DCs.
a, Functional annotations of upregulated metabolic pathways according to KEGG and Hallmark databases in CD8α+ DCs (compared to CD8α− DCs) profiled by proteomics. b, ECAR of splenic CD8α+ and CD8α− DCs (Oligo, oligomycin; FCCP, carbonyl cyanide p-trifluoromethoxyphenylhydrazone). c, Flow cytometry analysis of mitochondrial mass and membrane potential of WT splenic CD8α+ and CD8α− DCs by Mitotracker and TMRM (Tetramethylrhodamine, methyl ester) staining, respectively. Numbers in graph indicate the mean fluorescence intensity. d, Relative thymidine incorporation of OT-I T cells cultured with OVA protein- or OVA(257-264) peptide-pulsed CD8α+ and CD8α− DCs pre-treated with vehicle or metabolic inhibitors. Values after culture with vehicle-treated DCs were set as 1. e, Thymidine incorporation of OT-I T cells cultured with OVA protein- or OVA(257-264) peptide-pulsed splenic CD8α+ DCs from WT and mTORΔDC mice for 72 h (n = 12 from 4 mice per genotype). f, Flow cytometry analysis of mitochondrial mass and mitochondrial membrane potential of WT and Mst1/2ΔDC splenic CD8α+ and CD8α− DCs by Mitotracker and TMRM staining, respectively. Numbers in graph indicate the mean fluorescence intensity. g, Transmission electron microscopy analysis of mitochondria of splenic CD8α− DCs from WT or Mst1/2ΔDC mice. Arrows indicate mitochondria. h, Immunoblot analysis of expression of NDUFB8 (complex I), SDHB (complex II), UQCRC2 (complex III), MT-CO1 (complex IV) and ATP5A (complex V) in CD8α+ and CD8α− DCs. i, Flow cytometry analysis of mitochondrial mass and mitochondrial membrane potential of WT and Lats1/2ΔDC splenic CD8α+ and CD8α− DCs by Mitotracker and TMRM staining, respectively. Numbers in graph indicate the mean fluorescence intensity. j, Immunoblot analysis of p-S6 and c-Myc protein in CD8α+ and CD8α− DCs of WT and Mst1/2ΔDC mice. k, Immunoblot analysis of NDUFB8 (complex I), SDHB (complex II), UQCRC2 (complex III), MT-CO1 (complex IV) and ATP5A (complex V) protein in CD8α+ and CD8α− DCs of WT and mTORΔDC mice. Error bar indicates SEM. *P < 0.05; **P < 0.01; one-way ANOVA in d; two-tailed unpaired Student’s t-test in e. Data summarize two (e, f, h–k), three (b, d) or four (c) independent experiments.
Extended Data Figure 9. Selective regulation of IL-12 signaling and expression by Mst1/2 in CD8α+ DCs.
a, Venn diagram showing the overlap of top 28 upregulated (Mst1/2ΔDC vs WT) pathways by GSEA between CD8α+ and CD8α− DCs. Briefly, transcriptional profiles of Mst1/2-deficient CD8α+ and CD8α− DCs were compared to their respective WT counterparts by GSEA, and then upregulated pathways (FDR < 0.05) were identified in CD8α+ DCs (Mst1/2ΔDC vs WT) and CD8α− DCs (Mst1/2ΔDC vs WT) and used to generate Venn diagram. The top 28 upregulated pathways in Mst1/2-deficient CD8α+ and CD8α− DCs (compared to their respective WT counterparts) were largely shared (24/28) between the two DC subsets. b, List of the significantly upregulated (FDR < 0.05) 24 pathways (out of 28) shared by Mst1/2-deficient CD8α+ and CD8α− DCs (compared to their respective WT counterparts), as revealed by GSEA. c, List of the significantly downregulated (FDR < 0.05) pathways determined by GSEA (arranged in the order by their FDR values) in Mst1/2-deficient CD8α+ DCs (vs WT cells). NES, normalized enrichment score. d, Il12b expression in WT CD8α+ and CD8α− DCs. e, Relative IL-12 p40 cytokine concentration in the supernatant of LPS-treated CD8α+ and CD8α− DCs from WT and Mst1/2ΔDC mice (n = 4 per genotype for CD8α+ DCs, n = 3 per genotype for CD8α− DCs). IL-12 p40 cytokine concentration of WT DCs was set as 1. f, Real-time PCR analysis of Il12b mRNA expression in WT splenic CD8α+ and CD8α− DCs treated with vehicle or Mst1/2 inhibitor (XMU-MP-1) (n = 4 per treatment). g, Il12b expression in FLT3L-BMDCs (n = 4 for WT CD24high BMDCs, n = 5 for other groups). h, i, Real-time PCR analysis of Il1a, Il1b, Il6, Il10 and Ifnb1 mRNA expression in splenic CD8α+ (h) and CD8α− DCs (i) from WT and Mst1/2ΔDC mice (n = 4 mice per genotype). j, k, Frequencies of CD44highCD62Llow (j) and CD44+IFN-γ+ cells (k) in splenic CD4+ and CD8+ T cells from WT (n = 5), Mst1/2ΔDC (n = 5), Il12a−/− (n = 6) and Mst1/2ΔDCIl12a−/− (n = 6) mice. WT and Mst1/2ΔDC groups were the same as those shown in Fig. 1d, e. Error bar indicates SEM. *P < 0.05; **P < 0.01; unpaired Student’s t-test in d, f–i; two-tailed paired Student’s t-test in e; one-way ANOVA in j, k. Data summarize two (d, g), three (e), four (j, k) or five (f) independent experiments.
Extended Data Figure 10. Mst/Hippo signaling integrates mitochondrial metabolism and non-canonical NF-KB/IL-12 signaling in CD8α+ DCs.
a, Relative thymidine incorporation of OT-I T cells cultured with OVA protein- or OVA(257-264) peptide-pulsed splenic CD8α+ DCs (left) or CD8α− DCs (right) from WT and Il12a−/− mice (n = 9 derived from 3 mice for WT, n = 12 derived from 4 mice for Il12a−/−). Thymidine incorporation of OT-I T cells cultured with WT DCs in each group was set as 1. b, Real-time PCR analysis of NF-κB2 (left) or RelB (right) mRNA expression in splenic CD8α+ DCs from WT and Mst1/2ΔDC mice (n = 3 mice per population). c, NF-κB2 and RelB expression in control- or NIKΔ78-84-transduced WT CD11c+B220− FLT3L-BMDCs. d, Flow cytometry analysis of mitochondrial membrane potential of WT or Mst1/2-deficient CD24hi FLT3L-BMDCs transduced with control (left) or NIK(Δ78-84) (right) virus. Numbers in graph indicate the mean fluorescence intensity. e, Thymidine incorporation of OT-I T cells cultured with OVA protein-pulsed WT or Mst1/2-deficient CD24high FLT3L-BMDCs transduced with control or NIK(Δ78-84) virus (n = 6 derived from 3 mice for WT/control group, n = 8 derived from 3 mice for Mst1/2ΔDC/control group, n = 4 derived from 3 mice per genotype for NIK(Δ78-84) group). f, FLT3L-expanded splenic CD8α+ DC lysate was immunoprecipitated with anti-Mst1 antibody and blotted with anti-Traf3. Mst1 blot was from the same experiment as Fig. 3f. g, Immunoblot analysis of Traf3 protein in splenic CD8α+ and CD8α− DCs from WT and Mst1/2ΔDC mice. h, Real-time PCR analysis of Il12b expression in WT CD8α+ DCs treated with vehicle, metformin or oligomycin as indicated in figures (n = 3 per group). Il12b expression of vehicle-treated DCs was set as 1. i, Flow cytometry analysis of mitochondrial membrane potential (upper) and mitochondrial mass (lower) of different concentrations of IL-12-treated WT splenic CD8α+ DCs by TMRM and Mitotracker staining. Numbers in graph indicate the mean fluorescence intensity. j, Flow cytometry analysis of mitochondrial membrane potential and mitochondrial mass of WT and Il12a−/− splenic CD8α+ DCs by TMRM (Tetramethylrhodamine, methyl ester) and Mitotracker staining. k, Flow cytometry analysis of mitochondrial membrane potential and mitochondrial mass of WT and NIK-deficient (Map3k14−/−) splenic CD8α+ DCs by TMRM and Mitotracker staining. l, Immunoblot analysis of p-Lats1/2, p-Yap and p-Mst1/2 proteins in WT splenic CD8α+ DCs treated with FLT3L for the indicated times. m, CD8α+ DC number from spleen of WT and Mst1/2ΔDC mice treated with or without FLT3L for 10 days. n, Flow cytometry analysis of mitochondrial mass of human CD141+ DCs treated with vehicle or Mst1/2 inhibitor (XMU-MP-1) by Mitotracker staining. o, Real-time PCR analysis of Il12b mRNA expression in human CD141+ (equivalent to mouse CD8α+ DCs) and CD1c+ DCs (equivalent to mouse CD8α− DCs) treated with vehicle or Mst1/2 inhibitor (XMU-MP-1) (n = 5 per for CD141+ DC, n = 4 for CD1c+ DC). Error bar indicates SEM. *P < 0.05; **P < 0.01; two-tailed unpaired Student’s t-test in a, b, m, o; two-way ANOVA in e. Data summarize two (a, d–g, i, j, 1, n, o) or three (h, k, m) independent experiments. p, Brief schematics of non-canonical Hippo signaling in orchestrating CD8α+ DC function. Mst/Hippo signaling integrates metabolic and IL-12 cytokine signaling in CD8α+ DCs through controlling mitochondrial dynamics and non-canonical NF-κB signaling. This regulation is independent of canonical Hippo signaling in organ size control and tumor suppression.
Acknowledgments.
The authors acknowledge N. Chapman for critical reading of the manuscript, R. Johnson for Stk4 and Stk3 floxed mice, E. Olson for Yap and Taz floxed mice, S.C. Sun for NIKΔ78-84 construct, M. Hendren and A. KC for animal work, SJCRH Electron Microscopy core resource for EM experiment, and Immunology FACS core facility for sorting. This work was supported by NIH AI105887, AI101407, CA176624, CA221290, NS064599 (to H.C.), and AG047928 (to J.P.).
Footnotes
The authors declare no competing financial interests.
References
- 1.Merad M, Sathe P, Helft J, Miller J & Mortha A The dendritic cell lineage: ontogeny and function of dendritic cells and their subsets in the steady state and the inflamed setting. Annu. Rev. Immunol 31, 563–604 (2013). [DOI] [PMC free article] [PubMed] [Google Scholar]
- 2.Murphy KM Transcriptional Control of Dendritic Cell Development. Annu. Rev. Immunol 34, 93–119 (2016). [DOI] [PMC free article] [PubMed] [Google Scholar]
- 3.Pearce EJ & Everts B Dendritic cell metabolism. Nat. Rev. Immunol 15, 18–29 (2015). [DOI] [PMC free article] [PubMed] [Google Scholar]
- 4.O’Neill LAJ & Pearce EJ Immunometabolism governs dendritic cell and macrophage function. J. Exp. Med 213, 15–23 (2016). [DOI] [PMC free article] [PubMed] [Google Scholar]
- 5.Dudziak D et al. Differential antigen processing by dendritic cell subsets in vivo. Science 315, 107–111 (2007). [DOI] [PubMed] [Google Scholar]
- 6.Piovan E et al. Direct Reversal of Glucocorticoid Resistance by AKT Inhibition in Acute Lymphoblastic Leukemia. Cancer Cell 24, 766–776 (2013). [DOI] [PMC free article] [PubMed] [Google Scholar]
- 7.Rodriguez-Barrueco R et al. Inhibition of the autocrine IL-6–JAK2–STAT3–calprotectin axis as targeted therapy for HR−/HER2+ breast cancers. Genes Dev. 29, 1631–1648 (2015). [DOI] [PMC free article] [PubMed] [Google Scholar]
- 8.Huang G et al. Signaling via the kinase p38α programs dendritic cells to drive TH17 differentiation and autoimmune inflammation. Nat Immunol 13, 152–161 (2012). [DOI] [PMC free article] [PubMed] [Google Scholar]
- 9.Meng Z, Moroishi T & Guan K-L Mechanisms of Hippo pathway regulation. Genes Dev. 30, 1–17 (2016). [DOI] [PMC free article] [PubMed] [Google Scholar]
- 10.Hildner K et al. Batf3 deficiency reveals a critical role for CD8α+ dendritic cells in cytotoxic T cell immunity. Science 322, 1097–1100 (2008). [DOI] [PMC free article] [PubMed] [Google Scholar]
- 11.Mashayekhi M et al. CD8α+Dendritic Cells Are the Critical Source of Interleukin-12 that Controls Acute Infection by Toxoplasma gondii Tachyzoites. Immunity 35, 249–259 (2011). [DOI] [PMC free article] [PubMed] [Google Scholar]
- 12.Naik SH et al. Cutting Edge: Generation of Splenic CD8+ and CD8− Dendritic Cell Equivalents in Fms-Like Tyrosine Kinase 3 Ligand Bone Marrow Cultures. J. Immunol 174, 6592–6597 (2005). [DOI] [PubMed] [Google Scholar]
- 13.Cogliati S et al. Mitochondrial cristae shape determines respiratory chain supercomplexes assembly and respiratory efficiency. Cell 155, 160–171 (2013). [DOI] [PMC free article] [PubMed] [Google Scholar]
- 14.Buck MDD et al. Mitochondrial Dynamics Controls T Cell Fate through Metabolic Programming. Cell 166, 63–76 (2016). [DOI] [PMC free article] [PubMed] [Google Scholar]
- 15.Mishra P & Chan DC Metabolic regulation of mitochondrial dynamics. J. Cell Biol 212, 379–387 (2016). [DOI] [PMC free article] [PubMed] [Google Scholar]
- 16.Valenzuela J, Schmidt C & Mescher M The roles of IL-12 in providing a third signal for clonal expansion of naive CD8 T cells. J. Immunol 169, 6842–6849 (2002). [DOI] [PubMed] [Google Scholar]
- 17.Sun SC The non-canonical NF-κB pathway in immunity and inflammation. Nat. Rev. Immunol 17, 545–558 (2017). [DOI] [PMC free article] [PubMed] [Google Scholar]
- 18.Katakam AK et al. Dendritic cells require NIK for CD40-dependent cross-priming of CD8+ T cells. Proc. Natl. Acad. Sci 112, 14664–14669 (2015). [DOI] [PMC free article] [PubMed] [Google Scholar]
- 19.Sasaki Y et al. NIK overexpression amplifies, whereas ablation of its TRAF3-binding domain replaces BAFF:BAFF-R-mediated survival signals in B cells. Proc. Natl. Acad. Sci 105, 10883–10888 (2008). [DOI] [PMC free article] [PubMed] [Google Scholar]
- 20.Bachem A et al. Superior antigen cross-presentation and XCR1 expression define human CD11c + CD141 + cells as homologues of mouse CD8 + dendritic cells. J. Exp. Med 207, 1273–1281 (2010). [DOI] [PMC free article] [PubMed] [Google Scholar]
- 21.Lu L et al. Hippo signaling is a potent in vivo growth and tumor suppressor pathway in the mammalian liver. Proc. Natl. Acad. Sci 107, 1437–1442 (2010). [DOI] [PMC free article] [PubMed] [Google Scholar]
- 22.Xin M et al. Hippo pathway effector Yap promotes cardiac regeneration. Proc. Natl. Acad. Sci 110, 13839–13844 (2013). [DOI] [PMC free article] [PubMed] [Google Scholar]
- 23.Wang Y et al. Transforming growth factor beta-activated kinase 1 (TAK1)-dependent checkpoint in the survival of dendritic cells promotes immune homeostasis and function. Proc. Natl. Acad. Sci 109, E343–E352 (2012). [DOI] [PMC free article] [PubMed] [Google Scholar]
- 24.Jongbloed SL et al. Human CD141 + (BDCA-3) + dendritic cells (DCs) represent a unique myeloid DC subset that cross-presents necrotic cell antigens. J. Exp. Med 207, 1247–1260 (2010). [DOI] [PMC free article] [PubMed] [Google Scholar]
- 25.Fan F et al. Pharmacological targeting of kinases MST1 and MST2 augments tissue repair and regeneration. Sci. Transl. Med 8, 352ra108 (2016). [DOI] [PubMed] [Google Scholar]
- 26.Wang D et al. A small molecule promotes mitochondrial fusion in mammalian cells. Angew. Chemie - Int. Ed. 51, 9302–9305 (2012). [DOI] [PubMed] [Google Scholar]
- 27.Cassidy-Stone A et al. Chemical Inhibition of the Mitochondrial Division Dynamin Reveals Its Role in Bax/Bak-Dependent Mitochondrial Outer Membrane Permeabilization. Dev. Cell 14, 193–204 (2008). [DOI] [PMC free article] [PubMed] [Google Scholar]
- 28.Maraskovsky E et al. Dramatic increase in the numbers of functionally mature dendritic cells in Flt3 ligand-treated mice: multiple dendritic cell subpopulations identified. J. Exp. Med 184, 1953–62 (1996). [DOI] [PMC free article] [PubMed] [Google Scholar]
- 29.den Haan JM, Lehar SM & Bevan MJ CD8(+) but not CD8(−) dendritic cells crossprime cytotoxic T cells in vivo. J. Exp. Med 192, 1685–96 (2000). [DOI] [PMC free article] [PubMed] [Google Scholar]
- 30.Kretzer NM et al. RAB43 facilitates cross-presentation of cell-associated antigens by CD8α + dendritic cells. J. Exp. Med 213, 2871–2883 (2016). [DOI] [PMC free article] [PubMed] [Google Scholar]
- 31.Wang Y et al. Tuberous sclerosis 1 (Tsc1)-dependent metabolic checkpoint controls development of dendritic cells. Proc. Natl. Acad. Sci 110, E4894–903 (2013). [DOI] [PMC free article] [PubMed] [Google Scholar]
- 32.Liedmann S et al. Viral suppressors of the RIG-I-mediated interferon response are pre-packaged in influenza virions. Nat Commun 5, 5645 (2014). [DOI] [PMC free article] [PubMed] [Google Scholar]
- 33.Huang B, Wang W, Bates M & Zhuang X Three-Dimensional Super-Resolution Imaging by Stochastic Optical Reconstruction Microscopy. Science 319, 810–813 (2008). [DOI] [PMC free article] [PubMed] [Google Scholar]
- 34.Tan H et al. Integrative Proteomics and Phosphoproteomics Profiling Reveals Dynamic Signaling Networks and Bioenergetics Pathways Underlying T Cell Activation. Immunity 46, 488–503 (2017). [DOI] [PMC free article] [PubMed] [Google Scholar]
- 35.Wang H et al. Systematic optimization of long gradient chromatography mass spectrometry for deep analysis of brain proteome. J. Proteome Res 14, 829–838 (2015). [DOI] [PMC free article] [PubMed] [Google Scholar]
- 36.Zeng H et al. mTORC1 couples immune signals and metabolic programming to establish T(reg)-cell function. Nature 499, 485–90 (2013). [DOI] [PMC free article] [PubMed] [Google Scholar]
- 37.Ritchie ME et al. limma powers differential expression analyses for RNA-sequencing and microarray studies. Nucleic Acids Res. 43, e47 (2015). [DOI] [PMC free article] [PubMed] [Google Scholar]
- 38.Putcha P et al. HDAC6 activity is a non-oncogene addiction hub for inflammatory breast cancers. Breast Cancer Res 17, 149 (2015). [DOI] [PMC free article] [PubMed] [Google Scholar]
- 39.Wang K et al. Genome-wide identification of post-translational modulators of transcription factor activity in human B cells. Nat. Biotechnol. 27, 829–837 (2009). [DOI] [PMC free article] [PubMed] [Google Scholar]
- 40.Alvarez MJ et al. Functional characterization of somatic mutations in cancer using network-based inference of protein activity. Nat. Genet 48, 838–847 (2016). [DOI] [PMC free article] [PubMed] [Google Scholar]
- 41.Lefebvre C et al. A human B-cell interactome identifies MYB and FOXM1 as master regulators of proliferation in germinal centers. Mol. Syst. Biol 6, 377 (2010). [DOI] [PMC free article] [PubMed] [Google Scholar]
- 42.Margolin AA et al. ARACNE: An algorithm for the reconstruction of gene regulatory networks in a mammalian cellular context. BMC Bioinformatics 7, s7 (2006). [DOI] [PMC free article] [PubMed] [Google Scholar]
- 43.Efron B & Tibshirani R On testing the significance of sets of genes. Ann. Appl. Stat 1, 107–129 (2007). [Google Scholar]
- 44.Irizarry RA, Wang C, Zhou Y & Speed TP Gene set enrichment analysis made simple. Stat. Methods Med. Res 18, 565–575 (2009). [DOI] [PMC free article] [PubMed] [Google Scholar]
- 45.Gelman A et al. Bayesian Data Analysis, Third Edition (Chapman & Hall/CRC Texts in Statistical Science). CRC Press; (2013). [Google Scholar]
- 46.Riley JW et al. The American Soldier: Adjustment During Army Life. Am. Sociol. Rev 14, 557 (1949). [Google Scholar]
- 47.Subramanian A et al. Gene set enrichment analysis: a knowledge-based approach for interpreting genome-wide expression profiles. Proc. Natl. Acad. Sci. U. S. A 102, 15545–50 (2005). [DOI] [PMC free article] [PubMed] [Google Scholar]


