Abstract
Although vaccination is an effective measure in reducing the risk of bovine respiratory disease complex (BRDC) in cattle, BRDC losses remain significant. Increasing the efficacy of vaccination depends on elucidating the protective immune response to different antigens included in vaccines, determining the best timing for vaccination, and understanding the impact of the age of the calf on vaccination. This study measured the serum antibodies present in calves following vaccination against 4 viruses commonly associated with BRDC: bovine viral diarrhea virus type 1 and 2 (BVDV1 and BVDV2), bovine respiratory syncytial virus (BRSV), and bovine herpesvirus 1 (BHV1). Serum antibody titers were measured in more than 1,600 calves at 3-wk intervals starting at the time of the first vaccination. This first vaccination occurred at weaning for approximately half of the individuals and 3 wk before weaning for the other half. Dam age (years), time of weaning (initial vaccination or booster vaccination), and age of calf within year–season (days within year–season) classification all were found to have a significant effect on measured traits such as the initial titer and overall response. An increased initial titer was negatively correlated with each response trait (initial, booster, and overall response). Calves that were weaned at initial vaccination had greater overall antibody response to BVDV1 and BVDV2 compared with calves weaned 3 wk before initial vaccination. In contrast, calves given their initial vaccination 3 wk before weaning had greater overall antibody response to BRSV and BHV1 compared with calves that were vaccinated at weaning. Furthermore, the circulating antibody titer at which each virus needed to be below for an individual calf to positively respond to vaccination was determined (log2 titer of 0.38 for BVDV1, 1.5 for BVDV2, 3.88 for BRSV, and 1.5 for BHV1). This information can be used to improve vaccination protocols to allow for a greater response rate of individuals to vaccination and, hopefully, improved protection.
Keywords: beef cattle, bovine respiratory disease complex, immune response, vaccination, weaning
INTRODUCTION
As one of the most costly diseases in the beef cattle industry, bovine respiratory disease complex (BRDC) results in an estimated loss of more than US$750 million a year due to morbidity, mortality, reduced growth performance, and reduced carcass quality (Snowder et al., 2007; Schneider et al., 2009). Vaccines vary in efficacy (Theurer et al., 2015), resulting in reduced overall herd immunity when calves are grouped in feedlots. Maternally derived antibodies passively obtained through colostrum are vital for early calf health (Roth, 2008) and assist protection but present barriers to vaccination. Calves may not mount a vaccination antibody response if maternal antibody levels are too high (Niewiesk, 2014), and if too low, calves may be at risk before vaccination induces protective immunity. As such, vaccination should occur at a time when calves can positively respond but still remain protected by maternal antibodies.
Environmental stressors are often associated with an altered immune state (Salak-Johnson and McGlone, 2007; Wein et al., 2016). Weaning has been shown to lower the immune response in calves and, therefore, may reduce the effectiveness of vaccination depending on its timing (Wilson et al., 2017).
This study built on previous work (Downey et al., 2013) with vaccination against bovine viral diarrhea virus type 2. By examining response to vaccination traits to 4 viruses associated with BRDC (bovine viral diarrhea virus type 1 [BVDV1], bovine viral diarrhea virus type 2 [BVDV2], bovine respiratory syncytial virus [BRSV], and bovine herpesvirus 1 [BHV1]), it was possible to identify environmental commonalities associated with immune response to vaccination. The objectives were to identify management and environmental factors that 1) impact the level of BVDV1, BVDV2, BRSV, and BHV1 circulating maternal antibodies at initial vaccination; 2) influence the rate of BVDV1 and BVDV2 maternal antibody decay prior to initial vaccination; and 3) influence response to vaccination against BVDV1, BVDV2, BRSV, and BHV1 to improve vaccination practices.
MATERIALS AND METHODS
The Iowa State University Animal Care and Use Committee (IACUC) approved all animal work before the conduction of this study.
Animals
Purebred American Angus calves (n = 2,834) from the Iowa State University (Ames,, IA) herd were used for this study. Not all individuals had a recorded response to vaccination phenotype records for each of the 4 viral antigens due to samples being analyzed in batches according to contemporary group and differences in time between samples being analyzed for each antigen. Due to these time differences, only a subset of the total herd number could be used when examining response to vaccination for a given virus. Phenotypic data (BW, ages, infectious bovine keratoconjunctivitis classification score [Lepper et al., 1992], and weaning status) were collected on each animal when serum samples were taken. Calves were born in either of 2 seasons (spring or fall) across multiple years (2006 to 2012 and 2014). The number of calves with recorded measurements was, on average, about 350 per year, with more individuals in the spring season compared with the fall season. The only exceptions to this were the years 2012 and 2014, in which only spring-born calves had measurements and the average number of calves was 226 per year.
Vaccination
Calves were vaccinated with a modified live vaccine (Bovi-Shield Gold 5; Zoetis Inc., Parsippany NJ). This vaccine contained antigens of 4 viruses that are associated with bovine respiratory disease: BVDV1, BVDV2, BRSV, and BHV1. Bovine parainfluenza 3 virus was also part of the modified live vaccine but was not included in this study. The vaccine was administered, per the manufacturer's recommendation, to the calves at 2 separate time points, designated initial vaccination (wk 0) and booster vaccination (wk 3). Calves were given the initial vaccine either at the time of weaning or 3 wk before, which resulted in weaning at the booster vaccination. This was done to evaluate the effect of weaning as a stressor on response to vaccination (Fig. 1).
Figure 1.
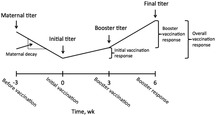
Timeline of serum sample collection. Prevaccination time point (−3 wk) samples were tested for only bovine viral diarrhea virus type 1 and bovine viral diarrhea virus type 2.
Dams of the calves studied received standard herd vaccinations during the course of this study. They received vaccinations approximately 40 d prior to breeding and again at the pregnancy check in the fall. These dam vaccination dates would correspond to approximately 100 d prior to and 3 wk after initial vaccination of the calves.
Serum Sample Collection
Serum samples were collected at 3 time points. The first sample was collected at initial vaccination (wk 0), the second sample was collected at booster vaccination (wk 3), and the third sample was collected 6 wk after initial vaccination. Additionally, a subset of the total population used for this study had serum samples collected 3 wk prior to the initial vaccination (wk −3; subsets of n = 622 for BVDV1 and n = 1,137 for BVDV2). Blood was collected from the jugular and allowed to coagulate overnight at 4°C. Tubes were centrifuged at 1,800 × g, 20 minutes at room temperature, after which serum was collected and separated into multiple 1.5-mL tubes and frozen at −20°C.
Viral Neutralization
Viral neutralization assays were performed to quantify the level of neutralizing antibodies present in serum against 4 viruses: BVDV1, BVDV2, BRSV, and BHV1. Viral neutralization assays used the following virus strains: cytopathic BVDV1 strain Singer and cytopathic BVDV2 strain A125-C (both obtained from the National Animal Disease Center, USDA-ARS, Ames, IA) and BRSV strain ATCC VR-794 and BHV1 strain Cooper (both obtained from the National Veterinary Services Laboratory, Ames, IA; Fulton et al., 2000). Viral neutralization assays were performed as previously described (Bolin and Ridpath, 1990; Downey et al., 2013) with a few modifications among viruses. For BVDV1, 5 replicates were tested for each serum sample. For BVDV2, 5 replicates were tested for each serum sample for animals born before 2014 and 3 replicates were tested for individuals born in 2014. All serum samples were diluted 1:4 to 1:2,048. For the BRSV and BHV1 assays, 2 replicates were tested for each serum sample, and serum samples were diluted between 1:8 and 1:2,048. Two-fold dilutions of serum were done using PBS. The titer was recorded for each calf as the log2 reciprocal of the greatest dilution at which neutralizing antibodies were detected and was based on the Spearman–Kärber method for initial calculation (Finney, 1978). A cell control and viral control were run alongside BVDV1 and BVDV2. A cell control, positive serum control, and negative serum control were run for BRSV and BHV1. The antibody titer score was recorded as the average log2 reciprocal of the greatest dilution that neutralized a virus across 5 replicates. A modified calculation was done for samples with 3 replicates. An average log2 reciprocal was taken across the 2 replicates for BHV1 and BRSV. If all wells within the first dilution showed a cytopathic effect, a titer score of 0 was given for the calf. Not all samples were available for analysis for antibodies to each of the 4 viruses, which resulted in different subsets of individuals being tested for each virus.
Response Traits
Seven antibody titer traits were analyzed. The maternal antibody titer level at wk −3 and maternal decay (rate of change between wk −3 and 0) were analyzed for only BVDV1 (622 cattle) and BVDV2 (1,137 cattle). Maternal antibody decay was defined as the difference between wk −3 and 0 divided by the difference in calf age between the 2 serum collection dates (22 d average calf age difference for both BVDV1 and BVDV2). This was not exactly 21 d for each calf, because all individuals in a single location had samples taken at the same time to minimize number of times interacting with the herd.
The initial antibody titer level was defined as the log2 antibody titer score observed at wk 0. The initial vaccination response (IVR) was defined as the difference between the antibody titer level observed at wk 3 (booster vaccination time point) and at wk 0 (initial vaccination time point). The booster vaccination response (BVR) was defined as the difference in the antibody titer level observed between wk 6 (booster response time point) and 3 (booster vaccination time point). The overall vaccination response (OVR) was defined as the difference in the antibody titer level observed between wk 6 (booster response time point) and 0 (initial vaccination time point). The final antibody titer level was defined as the log2 antibody titer score observed at wk 6 (Tait et al., 2013; Fig. 1).
Statistical Analysis
Environmental and systemic factors were evaluated to determine their potential effect on response to vaccination traits. Year–season classification was considered a single variable for the purpose of this study, as previously described (Downey et al., 2013). Age within year–season was fit as a covariate. Additional contemporary group categories (date of serum batch analyzed, lab technician analyzing data, and farm) were fit as covariates but showed no statistical significance.
Prevaccination and initial antibody titer levels were analyzed using the following statistical model:
in which yijklm was the prevaccination or initial antibody titer for calf m. Overall mean = µ, YSi is the year–season classification (i = 2006–S, 2006–F, 2007–S, 2007–F, 2008–S, 2008–F, 2009–S, 2009–F, and 2010–S included for BVDV1, BRSV, and BHV1; 2010–F included for BVDV1; and 2011–S, 2011–F, 2012–S, and 2014–S but not 2006–S and 2006–F included for BVDV2, in which S is spring season and F is fall season), DAj is the dam age (j = 2 to 11 yr of age. Ages 12 to 14 included for BVDV2), and Sexk = calf sex (k = bull, steer, or heifer); these were fit as fixed effects in the model. Dam ID, IDl, for calf m, which was fit as a random effect to account for multiple progeny. Birth weight, BiWm, for calf m and Am(YSi) = calf age at pre-vaccination or initial vaccination time point within year-season classification were fit as covariate effects. The error term, eijklm was assumed to be normally distributed (mean = 0 and variance = σ2e). Variables were systematically removed from the model until only variables with P < 0.05 remained in the models. This resulted in a model with only significant factors and IDl.
Maternal antibody decay rate was analyzed using the following statistical model:
in which yijklm was the maternal antibody decay rate in titer level per day for calf m. Overall mean = µ, YSi = year–season classification (i = 2006–S, 2006–F, 2007–S, 2007–F, 2008–S, 2008–F, 2009–S, 2009–F, and 2010–S included for BVDV1, BRSV, and BHV1; 2010–F included for BVDV1; and 2011–S, 2011–F, 2012–S, and 2014–S but not 2006–S and 2006–F included for BVDV2, in which S is spring season and F is fall season, DAj is the dam age (j = 2 to 11 yr of age; ages 12 to 14 included for BVDV2), and Sexk is the calf sex (k = bull, steer, or heifer); these were fit as fixed effects in the model. Dam ID, IDl, for calf m, which was fit as a random effect to account for multiple progeny. Calf age within year-season classification at pre-vaccination, Am(YSi) and Tm is the prevaccination antibody titer level for calf m, which were fit as covariate effects. The error term, eijklm, was assumed to be normally distributed (mean = 0 and variance = σ2e). Variables were removed from the model systematically until only variables with P < 0.05 remained in the model. This resulted in a model with only significant factors and IDl.
Response to vaccination traits (IVR, BVR, OVR, and final antibody titer) were analyzed using the following statistical model:
 |
in which yijklmno is the IVR, BVR, OVR, or final antibody level measured on calf o. Overall mean = µ, YSi is the year–season classification (i = 2006–S, 2006–F, 2007–S, 2007–F, 2008–S, 2008–F, 2009–S, 2009–F, and 2010–S included for BVDV1, BRSV, and BHV1; 2010–F included for BVDV1; and 2011–S, 2011–F, 2012–S, and 2014–S but not 2006–S and 2006–F included for BVDV2, in which S is spring and F is fall), Sexj is the calf sex (k = bull, steer, or heifer), Wk is the weaning time (k = weaned at initial or booster vaccination); PEl is the pinkeye classification at weaning (l = 0 for unaffected and 1 for affected), and DAm = dam age (j = 2 to 11 yr of age; ages 12 to 14 included for BVDV2), which were fit as fixed effects in the model. Dam ID, IDl, for calf m, was fit as a random effect to account for multiple progeny. Initial antibody level, To, for calf o for IVR, OVR, and final antibody level and booster antibody level for BVR; (To × To) = quadratic effect for IVR, OVR, and final antibody level and booster antibody level for BVR; Ao(YSi) is the calf age at vaccination (o = calf age at wk 6 for final antibody level, age at initial vaccination for IVR and OVR, and age at wk 3 for BVR) within year–season classification; and ADGo = average daily gain for each of the 3 response variables (not fit for final antibody level) were fit as covariate effects. The error term, eijklm, was assumed to be normally distributed (mean = 0 and variance = σ2e). Variables were removed from the model systematically until only variables with P < 0.05 remained in the models. This resulted in a model with only significant factors and IDl.
Clustering
Clustering of animals within a given virus category was done with SSClust3.0 (Ma et al., 2006). The program was run with a chain number of 5, threshold of 0.1, and a cluster number of 2+ for each population of individuals for each of the 4 viruses. Visual outputs from clustering analysis allowed for identification of subgroups of calve that responded differently to vaccination across the course of the study.
RESULTS
The average age at initial vaccination was 138 d for BVDV1, 127 d for BVDV2, and 136 d for BHV1 and BRSV (SD 31.3, SD 35.2, and SD 29.6, respectively). The average weight of calves at initial vaccination was 145.45 kg for BVDV1, 139.48 kg for BVDV2, and 150.51 kg for BRSV and BHV1 (SD 5.1, SD 5.6, and SD 5.1, respectively). The average age and weight of calves varied among the different antigens due to differences in the number of individuals with recorded serum titers for each antigen, which resulted in different total numbers of calves for each antigen group. The proportion of male calves to female calves was relatively equal, with males being slightly more common (864 males for BVDV1, 1,191 males for BVDV2, and 849 males for BRSV and BHV1 and 791 females for BVDV1, 1,041 females for BVDV2, and 783 females for BRSV and BHV1). Table 1 shows the number of animals tested for antibodies against each virus per time point as well as the mean, SD, and range for antibody titer, BW, and age at each time point.
Table 1.
Means for titer, calf age, and calf weight at 4 time points for bovine viral diarrhea virus type 1 (BVDV1), bovine viral diarrhea virus type 2 (BVDV2), bovine respiratory syncytial virus (BRSV), and bovine herpesvirus 1 (BHV1)
| Item | No. of calves | Titer, log2 | Range | SD | Age, d | SD | Range | BW, kg | SD |
|---|---|---|---|---|---|---|---|---|---|
| BVDV1 | |||||||||
| Before vaccination1 | 622 | 2.68 | 0–12.3 | 2.68 | 111.8 | 27.9 | 28–169 | 133.4 | 30.6 |
| Initial vaccination | 1,648 | 2.14 | 0–10.5 | 2.15 | 138.0 | 29.4 | 54–205 | 149.2 | 34.5 |
| Booster vaccination | 1,488 | 1.5 | 0–9.3 | 1.7 | 158.6 | 29.7 | 76–229 | 173.8 | 39.7 |
| Final | 1,348 | 2.3 | 0–9.3 | 1.8 | 177.9 | 29.1 | 99–250 | 190.1 | 40.0 |
| Decay,2 titer units/d | 622 | −0.023 | 0.06 | ||||||
| BVDV2 | |||||||||
| Before vaccination1 | 1,137 | 4 | 0–10.5 | 2.32 | 109.1 | 28.7 | 28–165 | 145.3 | 34.1 |
| Initial vaccination | 2,177 | 3.24 | 0–11.2 | 2.38 | 127.0 | 35.0 | 30–205 | 143.2 | 37.5 |
| Booster vaccination | 1,927 | 2.5 | 0–11.3 | 1.98 | 152.9 | 31.4 | 57–229 | 164.3 | 39.7 |
| Final | 1,917 | 4.17 | 0–9.16 | 1.91 | 174.9 | 30.9 | 78–250 | 182.3 | 42.6 |
| Decay,2 titer units/d | 1,137 | −0.041 | 0.045 | ||||||
| BRSV | |||||||||
| Initial vaccination | 1,632 | 1.08 | 0–6 | 1.81 | 136.3 | 29.6 | 53–205 | 150.5 | 36.1 |
| Booster vaccination | 1,310 | 3.73 | 3–6 | 0.81 | 151.1 | 28.0 | 76–229 | 170.9 | 39.1 |
| Final | 1,483 | 5 | 3–6.46 | 0.89 | 177.3 | 35.0 | 99–250 | 189.5 | 40.3 |
| BHV1 | |||||||||
| Initial vaccination | 1,621 | 0.87 | 0–6 | 1.45 | 136.3 | 29.6 | 53–205 | 150.3 | 36.1 |
| Booster vaccination | 1,351 | 2.1 | 0–6 | 1.79 | 156.8 | 29.7 | 76–229 | 170.4 | 38.9 |
| Final | 1,377 | 2.98 | 0–6.58 | 2.3 | 177.5 | 34.0 | 99–250 | 189.6 | 40.2 |
Viral neutralization titers to BRSV and BHV1 were not measured in prevaccination samples; therefore, results for before vaccination and decay are reported for only BVDV1 and BVDV2.
Titer reported as titer per day change for maternal decay.
Prevaccination and initial vaccination antibody titers were affected by year–season, dam age, birth weight, and age within year–season (Table 2). Dam age was positively correlated with increased initial titer levels for all viruses with the exception of BHV1 (Fig. 2). For BVDV1, the maternal antibody titer increased as dam age increased up to 8 yr of age. The spike in maternal antibody titer was likely due to the large SE that resulted from low numbers of representative dams at this age. Bovine viral diarrhea virus type 2, BRSV, and BHV1 titer levels increased as dam age increased up to 7 yr of age. Initial antibody titers decreased (P < 0.05), although at varying rates among the 4 viruses, as calf age increased (Fig. 3). Supplemental Figs. 1-4 show the aforementioned trends without averaging across year-season classification.
Table 2.
Significance for fixed effects relating to initial antibody titer, prevaccination antibody titer, and maternal decay for bovine viral diarrhea virus type 1 (BVDV1) and bovine viral diarrhea virus type 2 (BVDV2)1
| Item | Initial | Before vaccination | Decay |
|---|---|---|---|
| BVDV1 | |||
| Year–season | <0.0001 | 0.0012 | 0.471 |
| Dam age | <0.0001 | <0.0001 | 0.0012 |
| Sex | 0.2431 | 0.2201 | 0.9292 |
| Birth weight | 0.0006 | 0.0012 | –2 |
| Age(year–season) | <0.0001 | <0.0001 | 0.2002 |
| Prevaccination level | – | – | <0.0001 |
| BVDV2 | |||
| Year–season | <0.0001 | 0.004 | <0.0001 |
| Dam age | <0.0001 | <0.0001 | 0.0012 |
| Sex | 0.099 | 0.3292 | 0.1383 |
| Birth weight | <0.0001 | 0.0136 | – |
| Age(year–season) | <0.0001 | <0.0001 | <0.0001 |
| Prevaccination level | – | – | <0.0001 |
Viral neutralization titers to bovine respiratory syncytial virus and bovine herpesvirus 1 were not measured in prevaccination samples; therefore, results are reported for only BVDV1 and BVDV2.
“–” = variable not tested.
Figure 2.
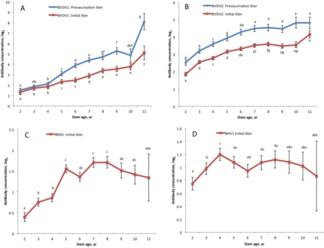
Average initial antibody concentration by dam age in years for (A) bovine viral diarrhea virus type 1 (BVDV1), (B) bovine viral diarrhea virus type 2 (BVDV2), (C) bovine respiratory syncytial virus (BRSV), and (D) bovine herpesvirus 1 (BHV1). Prevaccination titers by dam age included for BVDV1 and BVDV2. a–hDifferent letters indicate significantly different dam ages at P < 0.05.
Figure 3.
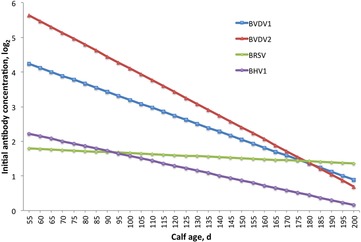
Initial antibody titer (wk 0) by calf age in days averaged across year–season classification for bovine viral diarrhea virus type 1 (BVDV1), bovine viral diarrhea virus type 2 (BVDV2), bovine respiratory syncytial virus (BRSV), and bovine herpesvirus 1 (BHV1) and extrapolated between 50 and 200 d of age.
Maternal Decay
The maternal antibody decay rate was evaluated for BVDV1 and BVDV2. No prevaccination data was collected for BRSV or BHV1, so the rate of decay of serum antibodies before the first vaccination could not be determined. Year–season classification, dam age, sex, age within year–season classification, and prevaccination levels significantly affected the decay rate of the BVDV2 maternal antibody level. For BVDV1, only dam age, age within year–season, and prevaccination levels were significant (Table 2). The rate of decay of the BVDV1 maternal antibody level generally decreased as dam age increased. In contrast, the rate of decay of the BVDV2 maternal antibody level remained relatively constant across dam age (Table 3). Calf age was inversely correlated with the rate of decay for both BVDV1 and BVDV2, with older calves having a greater rate of decay than younger calves (Fig. 4). Supplemental Figs. 5 and 6 show maternal decay not averaged across year-season classification. For BVDV1 and BVDV2, prevaccination maternal antibody titers were inversely correlated with the rate of decay. A 1-unit increase in the prevaccination maternal antibody titer corresponded to a 0.01698 titer units/d decrease in maternal antibody decay rate for BVDV1 and a 0.01139 titer units/d decrease for BVDV2 (P < 0.0001).
Table 3.
Rate of maternal antibody decay by dam age for bovine viral diarrhea virus type 1 (BVDV1) and bovine viral diarrhea virus type 2 (BVDV2)
| BVDV1 | BVDV2 | ||||
|---|---|---|---|---|---|
| Dam age, yr | Rate of decay | SE | Dam age, yr | Rate of decay | SE |
| 2a | −0.01911 | 0.008584 | 2a | −0.06558 | 0.004561 |
| 3b | −0.04109 | 0.007251 | 3b | −0.05428 | 0.003819 |
| 4b | −0.03863 | 0.007018 | 4b | −0.04727 | 0.003845 |
| 5ab | −0.0339 | 0.009137 | 5b | −0.05251 | 0.004357 |
| 6a | −0.00956 | 0.009723 | 6bc | −0.04466 | 0.00471 |
| 7a | −0.00958 | 0.009905 | 7cd | −0.03717 | 0.00474 |
| 8a | −0.00292 | 0.01236 | 8bde | −0.0435 | 0.005412 |
| 9a | −0.00307 | 0.01422 | 9ab | −0.04938 | 0.005677 |
| 10ac | 0.0232 | 0.02755 | 10ab | −0.05465 | 0.008574 |
| 11c | 0.06686 | 0.03497 | 11ce | −0.02878 | 0.00935 |
| 12abc | −0.05348 | 0.02315 | |||
| 13abc | −0.0683 | 0.03974 | |||
| 14abc | −0.0554 | 0.03959 | |||
Different superscripts indicate significantly different estimates (P < 0.05) within a single virus analyzed.
Figure 4.
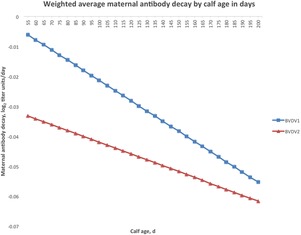
Weighted average of maternal antibody decay rate (titer units/d) by prevaccination age of calf for bovine viral diarrhea virus type 1 (BVDV1) and bovine viral diarrhea virus type 2 (BVDV2) and extrapolated between 50 and 200 d of age.
Response to Vaccination
Response to vaccination may be influenced by factors other than circulating maternal antibodies. Therefore, other environmental factors were evaluated for their effect on initial response to vaccination, booster response to vaccination, overall response to vaccination, and final antibody titer. All factors in model [3] were tested, and the results can be found in Table 4. Sex was significant only for the initial vaccination titer for BRSV. Average daily gain of the calf was only significantly associated with the initial response of BVDV1 vaccination. The observed baseline titer, that is, the antibody titer at the first time point used to calculate a vaccination trait (e.g., the titer at wk 0 for IVR, OVR, and final antibody titer or the wk-3 antibody titer for BVR) was significant for every trait with the exception of the final antibody titer for BRSV and the IVR for BVDV1. Age within year–season classification was significant for all traits. Weaning date was significant for many traits, and individuals were classified as either weaned at wk 0 or weaned at wk 3. Weaning classification was associated with increased overall antibody response to BVDV1 and BVDV2 when calves were weaned at initial vaccination. Weaning classification was also associated with increased OVR in BRSV and BHV1 when calves were weaned at booster vaccination (see, for example, results for calves receiving initial vaccination at weaning and having a dam aged 5 yr old, in Fig. 5). Supplemental Figs. 7-9 show significance for IVR, BVR, and final antibody titer. Pink eye occurrence was statistically significant for only a few time points across all 4 viruses (BVDV1 final titer level; BVDV2 IVR, OVR, and final titer level; and BHV1 IVR).
Table 4.
Class effects and covariates associated with initial response, booster response, overall response, and final antibody titer for bovine viral diarrhea virus type 1 (BVDV1), bovine viral diarrhea virus type 2 (BVDV2), bovine respiratory syncytial virus (BRSV), and bovine herpesvirus 1 (BHV1)
| Item | Initial response | Booster response | Overall response | Final antibody level |
|---|---|---|---|---|
| BVDV1 | ||||
| Year–season | 0.05 | 0.0823 | 0.0047 | <0.0001 |
| Sex | 0.3856 | 0.904 | 0.984 | 0.9507 |
| Pink eye | 0.6824 | 0.2001 | 0.116 | 0.013 |
| Dam age | 0.0034 | 0.0256 | 0.0024 | 0.029 |
| Wean | 0.2726 | 0.0526 | 0.0004 | 0.0022 |
| Titer | 0.2605 | <0.0001 | <0.0001 | <0.0001 |
| Titer × titer | <0.0001 | <0.0001 | <0.0001 | <0.0001 |
| Age(year–season) | <0.0001 | <0.0001 | 0.0003 | <0.0001 |
| ADG | 0.0015 | 0.7861 | 0.7427 | –1 |
| BVDV2 | ||||
| Year–season | 0.0007 | <0.0001 | <0.0001 | <0.0001 |
| Sex | 0.8879 | 0.0573 | 0.2283 | 0.2379 |
| Pink eye | 0.0055 | 0.2236 | 0.0195 | 0.0181 |
| Dam age | 0.0518 | <0.0001 | <0.0001 | <0.0001 |
| Wean | <0.0001 | 0.0746 | 0.0012 | 0.0005 |
| Titer | <0.0001 | <0.0001 | <0.0001 | <0.0001 |
| Titer × titer | <0.0001 | <0.0001 | <0.0001 | <0.0001 |
| Age(year–season) | <0.0001 | <0.0001 | <0.0001 | <0.0001 |
| ADG | 0.3792 | 0.3478 | 0.1834 | – |
| BRSV | ||||
| Year–season | <0.0001 | <0.0001 | <0.0001 | <0.0001 |
| Sex | 0.0311 | 0.1712 | 0.2633 | 0.2362 |
| Pink eye | 0.1375 | 0.5948 | 0.766 | 0.9354 |
| Dam age | 0.6456 | 0.04 | 0.0002 | <0.0001 |
| Wean | 0.5632 | <0.0001 | <0.0001 | <0.0001 |
| Titer | <0.0001 | <0.0001 | <0.0001 | 0.4414 |
| Titer × titer | 0.931 | 0.585 | 0.1151 | 0.124 |
| Age(year–season) | <0.0001 | <0.0001 | <0.0001 | <0.0001 |
| ADG | 0.9364 | 0.1578 | 0.958 | – |
| BHV1 | ||||
| Year–season | <0.0001 | <0.0001 | <0.0001 | <0.0001 |
| Sex | 0.0751 | 0.7596 | 0.4038 | 0.4557 |
| Pink eye | 0.0128 | 0.6701 | 0.6821 | 0.7563 |
| Dam age | <0.0001 | 0.0352 | 0.0021 | 0.0002 |
| Wean | 0.0004 | <0.0001 | <0.0001 | <0.0001 |
| Titer | <0.0001 | <0.0001 | <0.0001 | <0.0001 |
| Titer × titer | 0.7269 | 0.8379 | <0.0001 | <0.0001 |
| Age(year–season) | <0.0001 | <0.0001 | <0.0001 | <0.0001 |
| ADG | 0.3721 | 0.387 | 0.2336 | – |
“–” = not tested for column trait.
Figure 5.
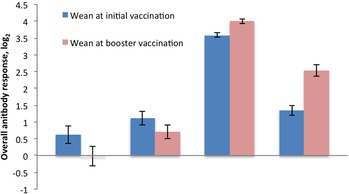
Change in average overall antibody response by weaning time point for bovine viral diarrhea virus type 1 (BVDV1), bovine viral diarrhea virus type 2 (BVDV2), bovine respiratory syncytial virus (BRSV), and bovine herpesvirus 1 (BHV1). A,BSignificant differences between weaning classification are represented with different letters above error bars (P < 0.05).
The effect of calf age at first vaccination within year–season classification was averaged across all year–seasons for a given virus and time point and compared among the 4 viruses. This was done to help account for birthing conditions, which can vary considerably between spring and late summer/early fall in the Midwestern United States. For IVR, an increase in calf age resulted in a lower IVR for all viruses with the exception of BVDV1, which slightly increased as calf age increased (Fig. 6A). Booster vaccination response increased with calf age for all 4 viruses (Fig. 6B). Overall vaccination response increased with calf age for all viruses, with the exception of BRSV, which exhibited a slight decrease in OVR with increased age (Fig. 6C). The final titer increased with calf age for BVDV1 and BVDV2 yet decreased with age for BRSV and BHV1 (Fig. 6D). Supplemental figures 10-13 show the aforementioned trends when not averaged across year-seasons.
Figure 6.
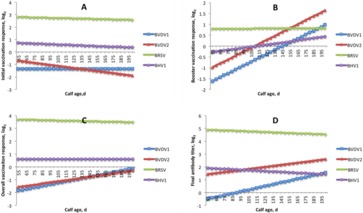
Estimated response traits and final antibody titers by calf age in days for bovine viral diarrhea virus type 1 (BVDV1; n = 1,654), bovine viral diarrhea virus type 2 (BVDV2; n = 2,231), bovine respiratory syncytial virus (BRSV; n = 1,631), and bovine herpesvirus 1 (BHV1; n = 1,631). (A) Initial vaccination response, (B) booster vaccination response, (C) overall vaccination response, and (D) final antibody titer. Covariates of weaning at initial vaccination: pink eye = yes and dam age = 5 yr. The slope indicates the weighted average effect of age and the vertical shift indicates the weighted average year–season effect.
The observed baseline titer, that is, the antibody titer at the start of a response to a vaccination trait (e.g., the titer score at wk 0 for IVR, OVR, and final antibody titer or the wk-3 antibody titer for BVR) was also averaged across all year–season classifications and compared among the 4 viruses (Fig. 7). Supplemental figures 14-17 show the same trends but not averaged across year-season. For all 4 response to vaccination traits (IVR, BVR, OVR, and final antibody titer level), antibody titers decreased as their respective baseline titers increased. To have a positive IVR, initial antibody level (wk 0) needed to be below 1.5 for BVDV2 and BHV1 but below 0.38 for BVDV1 and 3.88 for BRSV (Fig. 7A). To have a positive BVR, the wk-3 antibody level needed to be below 1.73 for BVDV1, below 3.32 for BVDV2, below 4.50 for BRSV, and below 2.38 for BHV1 (Fig. 7B). To have a positive OVR, the wk-0 antibody level needed to be below 1.55 for BVDV1, below 2.71 for BVDV2, below 4.12 for BRSV, and below 1.29 for BHV1 (Fig. 7C). The final antibody titer decreased for all viruses as the wk-0 antibody concentration increased. Bovine respiratory syncytial virus also saw a decrease in the final antibody titer as the wk-0 antibody concentration increased but at a slow decline compared with the other 3 viruses, with a theoretical final antibody titer score of 0 only when initial antibody levels are at 184.92 titer units (Fig. 7D). Figures 6 and 7 show trends for calves aged 55 to 200 d of age, although the true age range for each virus at each time point can be seen in Table 1.
Figure 7.
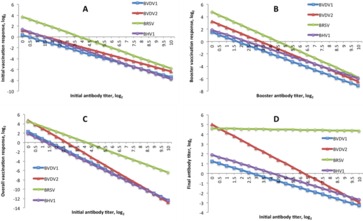
Response traits and final antibody titers normalized by starting titer for bovine viral diarrhea virus type 1 (BVDV1; n = 1,654), bovine viral diarrhea virus type 2 (BVDV2; n = 2,231), bovine respiratory syncytial virus (BRSV; n = 1,631), and bovine herpesvirus 1 (BHV1; n = 1,631). (A) Initial vaccination response, (B) booster vaccination response, (C) overall vaccination response, and (D) final antibody titer. Covariates of weaning at initial vaccination: pink eye = yes and dam age = 5 yr. The slope indicates the weighted average effect of base titer and the vertical shift indicates the weighted average year–season effect.
The overall antibody titer level trend was plotted for each virus across the 3 (or 4) serum collection time points (Fig. 8). The overall trend was fit using model [1], and all nonsignificant factors were removed before being fit. Each time point had age within year–season classification fit as the average age of calves with records. For BVDV1 and BVDV2, sex and birth weight were included in the final model, whereas for BRSV and BHV1, they were not significant. Titers to BVDV1 and BVDV2 were observed to decrease from wk −3 to 3 and then increase from wk 3 to 6. Titers to BRSV and BHV1 increased from wk 0 to 6.
Figure 8.
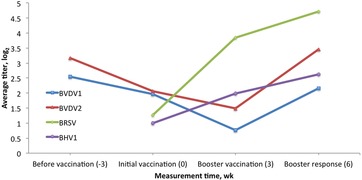
Average titer over time for each of 4 viruses. Trend fit using model [1] and removing any nonsignificant factors. BVDV1 = bovine viral diarrhea virus type 1; BVDV2 = bovine viral diarrhea virus type 2; BRSV = bovine respiratory syncytial virus; BHV1 = bovine herpesvirus 1.
Titer curves for each virus across all individuals are shown in Fig. 9. The average titer across time is plotted as green lines, whereas individuals are plotted as gray lines. Figure 10 shows the titer curves for individual animals that had a titer of 0 for BVDV1, BVDV2, and BHV1 at wk 6. Bovine respiratory syncytial virus was included for the sake of comparison by plotting only individuals with a final titer level of 3, because no individual failed to seroconvert for BRSV at wk 6. There were 367, 100, and 468 calves that had a titer of 0 against BVDV1, BVDV2, and BHV1, respectively, at wk 6.
Figure 9.
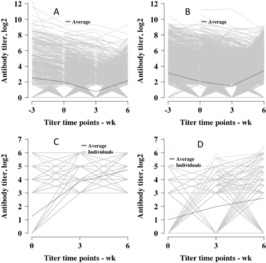
Titers across serum collection time points. (A) Bovine viral diarrhea virus type 1 (n = 1,654), (B) bovine viral diarrhea virus type 2 (n = 2,231), (C) bovine respiratory syncytial virus (n = 1,631), and (D) bovine herpesvirus 1 (n = 1,631). The average titer level is plotted in green and all individuals are plotted in gray.
Figure 10.
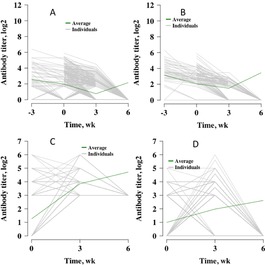
Individuals with a final titer of 0. (A) Bovine viral diarrhea virus type 1 (n = 367), (B) bovine viral diarrhea virus type 2 (n = 100), and (C) bovine herpesvirus 1 (n = 468). Average titer level across all individuals measured is plotted in green. (D) Bovine respiratory syncytial virus (n = 132) shows individuals with the minimum titer calculated at wk 6 (3 on a log2 scale). Although it is not the same trend as shown in panels A, B, and C, it was included to allow comparison.
Of the 367 individuals that had a final titer of 0 for BVDV1, 107 of these calves had a titer of 0 at all time points, 119 calves did not obtain a titer of 0 until wk 6, 96 calves had a titer of 0 by wk 3, and 19 calves obtained and maintained a titer of 0 by wk 0 (required prevaccination data), whereas 26 calves exhibited titers that oscillated or had missing data at wk 0 or 3. Of the 100 individuals that had a final titer of 0 for BVDV2, 9 of these calves had a titer of 0 at all time points, 57 calves did not obtain a titer of 0 until wk 6, 27 calves had a titer of 0 by wk 3, and 3 calves obtained and maintained a titer of 0 by wk 0 (required prevaccination data), whereas 4 calves exhibited titers that oscillated or had missing data at wk 0 or 3. Of the 468 individuals that had a final titer of 0 for BHV1, 227 of these calves had a titer of 0 at all time points, 62 caves did not obtain a titer of 0 until wk 6, 70 calves had a titer of 0 by wk 3, and 109 calves obtained and maintained a titer of 0 by wk 0 (required prevaccination data), whereas 109 calves exhibited titers that oscillated or had missing data at wk 0 or 3. Oscillating titers for these plots was defined as a titer change from positive to 0 to positive or from 0 to positive to 0 at some point across all measurement time points. One hundred thirty-two individuals were shown that had a final titer of 3 (the lowest recorded titer score at wk 6) for BRSV.
Titer trends for each virus were plotted across time with SSClust3.0 (Ma et al., 2006). The mean curve for each cluster was obtained and plotted as a black line, alongside a 95% confidence interval in red. Curves for the 4 clusters within BVDV1 can be seen in Fig. 11. Interpolation between time points can be seen between each of the 4 time points (before vaccination [−3 wk], initial vaccination [0 wk], booster vaccination [3 wk], and booster response [6 wk]). The y-axis represents the proportional titer level compared with a base level of 1 determined by SSClust3.0 for each cluster. Additional trends for the other 3 viruses can be found in supplemental figures 18-20.
Figure 11.
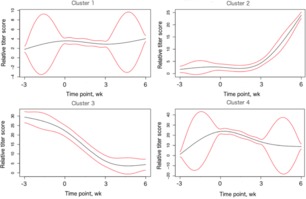
Trends within individuals with measured bovine viral diarrhea virus type 1 data. Four clusters were generated, with n = 163 calves for cluster 1, n = 524 calves for cluster 2, n = 136 calves for cluster 3, and n = 809 calves for cluster 4. The x-axis shows titer measurement time points (before vaccination, initial vaccination, booster vaccination, and booster response). The y-axis represents average titer of cluster, calculated proportional to other time points, with a score of 1 being the reference. Black lines represent mean titer trends and red lines represent the 95% confidence interval.
DISCUSSION
An individual's titer can be indicative of immunological health and, therefore, may be useful for determining which individuals are more responsive to vaccination protocols and, therefore, better contributors to herd immunity in livestock (Bryson et al., 1999; Ellis et al., 2001; Lee et al., 2015). By using 4 viruses commonly associated with BRDC, we showed that there are various factors that impact response to vaccination in prefeedlot calves and that these factors may not be the same for all viruses. Although we measured responses to all 4 viruses from only 1,273 calves, for some viruses, we report results for more calves, when they were available. The inclusion of additional data from more calves did not significantly alter observed results.
Maternally derived antibodies serve an important purpose in protection for calves during their early developmental lifetime, but the suppressive effects of maternal antibodies on antibody response may hamper the ability to determine the calf's own immunological response for an individual as measured by seroconversion (Fulton et al., 2004; Guzman and Taylor, 2015). Maternal antibody decay was examined for both BVDV1 and BVDV2 by determining the rate of decay in antibody titers from 3 wk before the initial vaccination to the initial vaccination at wk 0. The rate of decay for BVDV2 titers were always greater than for BVDV1 titers at a given calf age, although the change in the rate of decay as calves aged was greater for BVDV1 than for BVDV2. The greater rate of decay for BVDV2 was likely due to greater average maternal antibody titer levels compared with BVDV1 (O'Neill et al., 2006). It may also be due, in part, to fewer calves (622) with prevaccination data for BVDV1 than the number with prevaccination data for BVDV2 (1,137); however, this is purely speculative in nature. The rate of maternal antibody decay increased with calf age, which was consistent with other studies on circulating maternal antibodies (Kirkpatrick et al., 2008) and closely followed a previous work examining maternal decay and BVDV2 titers (Downey et al., 2013). Rates of decay for both BVDV1 and BVDV2 indicated that by the initial vaccination at wk 0, many individuals had low enough circulating maternally derived antibodies to mount a response to vaccination. The level of circulating maternally derived antibodies was directly related to calf and dam age. Higher birth weights were found to be significantly associated with higher maternally derived antibody levels at initial vaccination, although their actual effect was minor compared with other factors. All discussion on observed response to vaccination must be tempered with the knowledge that circulating maternally derived antibodies may still have been binding to antigens. Therefore, the observed responses may have been different if calves had no maternal antibodies at the time of vaccination.
Weaning has been associated with increased stress in calves, and stress has been implicated in negatively affecting the immune response of individuals (Hulbert and Moisa, 2016). To determine the effect of weaning stress, approximately half of the calves used for this study were weaned at initial vaccination (wk 0) with the other half weaned at booster vaccination (wk 3). Results indicate that titers to BVDV1 and BVDV2 increased significantly more when calves received their initial vaccination at the time of weaning; in contrast, titers to BHV1 and BRSV increased significantly more when calves received their initial vaccination 3 wk before weaning. However, it is important to remember that titers for different calves were included in the model describing the responses to BVDV1/BVDV2 and BHV1/BRSV. Therefore, it may not be valid to make a comparison between the responses to BVDV1/BVDV2 and the responses to BRSV/BHV1. The same calves were included in the models describing BRSV and BHV1, so comparison between the responses to those viruses may be more appropriate. Another source of potential stress was infection by pink eye. The occurrence of pink eye was statistically associated with lowered antibody titers, indicating that calves' ability to respond to vaccination was negatively impaired.
A decrease in the initial antibody titer score for BVDV1 and BVDV2 was likely linked to greater baseline titer values, that is, the antibody titer score at wk 0, compared with BRSV and BHV1. Increased calf age was associated with greater OVR for all viruses with the exception of BRSV (rate of titer score increase as calf age increased was different for BVDV1, BVDV2, and BHV1). This was in agreement with a previous study that focused solely on BVDV2 (Downey et al., 2013). The decrease in the initial antibody titer is understandable as the lower maternal antibodies found in older individuals would allow for the immune system to respond with increased antibody production to the presence of viruses (Munoz-Zanzi et al., 2002). For an antibody response to be mounted in the presence of viral antigens, it appears that an individual's circulated antibodies to that antigen must be below a specific threshold. If circulating antibodies are above this threshold, they may bind the viral antigens while reducing stimulation of the individual's immune system, as seen by decreasing titer levels for individuals with high initial vaccination titers. Changes in trends for each response variable as the base titer level increased (e.g., titer score at wk 0 for IVR, OVR, and final antibody level or wk-3 antibody titer level for BVR) were obtained to assist in identifying antibody response in relation to a respective antibody level at a given time. The intersection of the trend line with the x-axis indicates an observed titer level at which an individual would positively respond to the presence of the virus if circulating antibodies were below the x-value of the intersection or fail to respond if circulating antibodies were above that value. For BVDV1 and BVDV2, the threshold was 0.38 and 1.5 log2 titer, which explains the initial titer score decrease from wk 0 to 3 observed in BVDV1 and BVDV2.
The BRSV titer values remained relatively constant across calf age for all response variables, indicating that there would be a response at any calf age. Although it was not possible to confirm an exact reason for this behavior, it may be due to the ubiquitous nature of BRSV in the environment (Ellis et al., 2005). This would indicate that most calves had already been exposed to BRSV at some point in their early life and, as such, already have the ability to generate antibodies in the presence of the BRSV antigen. This indicated that calves, on average, were always able to respond to the presence of BRSV antigens and that vaccination may not be responsible for these observations.
This ubiquitous nature of BRSV may also explain why every calf seroconverted for BRSV by wk 6. The lowest recorded final antibody titer for BRSV was 3 on the log2 scale, whereas BVDV1, BDVD2, and BHV1 all had some proportion of individuals with a final antibody titer of 0. The minimum possible record above 0 does differ among the 4 viruses, because BRSV and BHV1 had only 2 assay replicates done per viral neutralization dilution compared with the 3 or 5 assay replicates for BVDV1 and BVDV2. This would allow only BRSV and BHV1 to have final titers between 1.7 and 3, at a minimum; however, it would not prevent final titers of 0, as seen in BHV1 observations. Again, the likely presence of BRSV throughout the herd is the most probable cause for why some animals did not seroconvert for the other 3 viruses but every individual measured for antibody response to BRSV managed to seroconvert.
A large amount of variation was found to be present in vaccine responses between individuals, leading to the question of if there were clusters of individuals that exhibited similar responses to vaccination. Average titer trends and the 95% confidence interval for each virus were plotted with SSClust3.0, which identified subsets of individuals (clusters) that exhibited similar responses to selection. These clusters may indicate that there are groups of calves that have different time courses of response to vaccination.
For the proportion of individuals that did not seroconvert to BVDV1, BVDV2, and BHV1 by wk 6, there are individuals that never seroconverted at any time point and those that had recorded antibody titers that dropped to 0 at some time period after the first measurement. The most interesting individuals were those that never seroconverted despite having maternal antibodies and 2 rounds of vaccination. There were 107 individuals that never seroconverted to BVDV1, 9 individuals that never seroconverted to BVDV2, and 227 individuals that never seroconverted to BHV1. This is 6.5, 0.4, and 13.9% of the respective set of animals with records for the given virus studied that failed to seroconvert. One calf failed to seroconvert for both BVDV1 and BVDV2, and 12 calves failed to seroconvert for both BVDV1 and BHV1. There were no calves that failed to seroconvert for both BVDV2 and BHV1 and, consequently, no calves that failed to seroconvert for all 3 viruses. Growth traits did not significantly differ between animals that seroconverted and those that did not, indicating that the development of the calves was not hindered by a lack of immune response up to the point at which serum samples were collected. Although individuals that did not seroconvert still grew normally and may be protected in herds due to herd immunity, these individuals may likely be the most at risk of viral infection (Quevillon et al., 2013).
To address methodology, a reduction in assay replicates occurred in later years of BVDV2 (5 to 3 replicates). Additionally, BHV1 and BRSV were analyzed with only 2 replicates as opposed to 5. Although a reduction in assay replicates is likely to reduce the overall accuracy of recorded measurements, this was done to improve statistical power by increasing the number of individuals with measured serum levels. By improving our power to statistically analyze observed measurements, we are able to better estimate trends in the population. This does lower the ability to analyze individuals on a one-by-one basis; however, this was not the goal of this particular study.
In summary, an individual's response to vaccination was influenced by multiple factors, including initial circulating maternally derived antibodies, time of weaning, and age of the calf. When these factors are considered together, it indicates that calves have, on average, a more positive antibody response to vaccination when they are older, likely due to a reduced quantity of circulating maternally derived antibodies. The time of weaning relative to the initial vaccination impacted the overall antibody response to vaccination for a given virus. Individuals with recorded BVDV1 and BVDV2 titers had more robust overall antibody responses when initially vaccinated at the time of weaning, whereas individuals with recorded BRSV and BHV1 titers had a more robust overall antibody response to vaccination when weaned 3 wk after that initial vaccination. This difference in robustness of response to vaccination indicates that the stress associated with weaning impacts response to vaccination differently for different viruses. It is still important to note that not all individuals had titers recorded for all 4 viruses, and therefore, direct response comparisons cannot be made for every individual and can be made based only on overall herd averages. A proportion of the calf population was identified as nonresponders or individuals that failed to seroconvert at wk 6. No reduced growth or development was associated with that proportion of individuals at the time of serum collection, possibly due to the effect of herd immunity. All of this together helps develop a more beneficial direction under which vaccinations could be administered.
Footnotes
This work was supported by Pfizer Animal Genetics.
LITERATURE CITED
- Bolin S. R., Ridpath J. F. 1990. Range of viral neutralizing activity and molecular specificity of antibodies induced in cattle by inactivated bovine viral diarrhea virus vaccines. Am. J. Vet. Res. 51(5):703–707. [PubMed] [Google Scholar]
- Bryson D. G., Adair B. M., McNulty M. S., McAliskey M., Bradford H. E., Allan G. M., Evans R. T., Forster F. 1999. Studies on the efficacy of intranasal vaccination for the prevention of experimentally induced parainfluenza type 3 virus pneumonia in calves. Vet. Rec. 145(2):33–39. doi: 10.1136/vr.145.2.33 [DOI] [PubMed] [Google Scholar]
- Downey E. D., Tait R. G., Jr, Mayes M. S., Park C. A., Ridpath J. F., Garrick D. J., Reecy J. M. 2013. An evaluation of circulating bovine viral diarrhea virus type 2 maternal antibody level and response to vaccination in Angus calves. J. Anim. Sci. 91(9):4440–4450. doi: 10.2527/jas.2012-5890 [DOI] [PubMed] [Google Scholar]
- Ellis J., West K., Konoby C., Leard T., Gallo G., Conlon J., Fitzgerald N. 2001. Efficacy of an inactivated respiratory syncytial virus vaccine in calves. J. Am. Vet. Med. Assoc. 218(12):1973–1980. doi: 10.2460/javma.2001.218.1973 [DOI] [PubMed] [Google Scholar]
- Ellis J. A., West K. H., Waldner C., Rhodes C. 2005. Efficacy of a saponin-adjuvanted inactivated respiratory syncytial virus vaccine in calves. Can. Vet. J. 46(2):155–162. [PMC free article] [PubMed] [Google Scholar]
- Finney D. J. 1978. Statistical method in biological assay. 3rd ed.Oxford Univ. Press, High Wycombe, England. [Google Scholar]
- Fulton R. W., Briggs R. E., Payton M. E., Confer A. W., Saliki J. T., Ridpath J. F., Burge L. J., Duff G. C. 2004. Maternally derived humoral immunity to bovine viral diarrhea virus (BVDV) 1a, BVDV1b, BVDV2, bovine herpesvirus-1, parainfluenza-3 virus bovine respiratory syncytial virus, Mannheimia haemolytica and Pasteurella multocida in beef calves, antibody decline by half-life studies and effect on response to vaccination. Vaccine 22(5–6):643–649. doi: 10.1016/j.vaccine.2003.08.033 [DOI] [PubMed] [Google Scholar]
- Fulton R. W., Purdy C. W., Confer A. W., Saliki J. T., Loan R. W., Briggs R. E., Burge L. J. 2000. Bovine viral diarrhea viral infections in feeder calves with respiratory disease: Interactions with Pasteurella spp., parainfluenza-3 virus, and bovine respiratory syncytial virus. Can. J. Vet. Res. 64(3):151–159. [PMC free article] [PubMed] [Google Scholar]
- Guzman E., Taylor G. 2015. Immunology of bovine respiratory syncytial virus in calves. Mol. Immunol. 66(1):48–56. doi: 10.1016/j.molimm.2014.12.004 [DOI] [PubMed] [Google Scholar]
- Hulbert L. E., Moisa S. J. 2016. Stress, immunity, and the management of calves. J. Dairy Sci. 99(4):3199–3216. doi: 10.3168/jds.2015-10198 [DOI] [PubMed] [Google Scholar]
- Kirkpatrick J. G., Step D. L., Payton M. E., Richards J. B., McTague L. F., Saliki J. T., Confer A. W., Cook B. J., Ingram S. H., Wright J. C. 2008. Effect of age at the time of vaccination on antibody titers and feedlot performance in beef calves. J. Am. Vet. Med. Assoc. 233(1):136–142. doi: 10.2460/javma.233.1.136 [DOI] [PubMed] [Google Scholar]
- Lee M., Reed A., Estill C., Izume S., Dong J., Jin L. 2015. Evaluation of BHV-1 antibody titer in a cattle herd against different BHV-1 strains. Vet. Microbiol. 179(3–4):228–232. doi: 10.1016/j.vetmic.2015.06.009 [DOI] [PubMed] [Google Scholar]
- Lepper A. W., Moore L. J., Atwell J. L., Tennent J. M. 1992. The protective efficacy of pili from different strains of Moraxella bovis within the same serogroup against infectious bovine keratoconjunctivitis. Vet. Microbiol. 32(2):177–187. doi: 10.1016/0378-1135(92)90104-2 [DOI] [PubMed] [Google Scholar]
- Ma P., Castillo-Davis C. I., Zhong W., Liu J. S. 2006. A data-driven clustering method for time course gene expression data. Nucleic Acids Res. 34(4):1261–1269. doi: 10.1093/nar/gkl013 [DOI] [PMC free article] [PubMed] [Google Scholar]
- Munoz-Zanzi C. A., Thurmond M. C., Johnson W. O., Hietala S. K. 2002. Predicted ages of dairy calves when colostrum-derived bovine viral diarrhea virus antibodies would no longer offer protection against disease or interfere with vaccination. J. Am. Vet. Med. Assoc. 221(5):678–685. doi: 10.2460/javma.2002.221.678 [DOI] [PubMed] [Google Scholar]
- Niewiesk S. 2014. Maternal antibodies: Clinical significance, mechanism of interference with immune responses, and possible vaccination strategies. Front. Immunol. 5:446. doi: 10.3389/fimmu.2014.00446 [DOI] [PMC free article] [PubMed] [Google Scholar]
- O'Neill R. G., Woolliams J. A., Glass E. J., Williams J. L., Fitzpatrick J. L. 2006. Quantitative evaluation of genetic and environmental parameters determining antibody response induced by vaccination against bovine respiratory syncytial virus. Vaccine 24(18):4007–4016. doi: 10.1016/j.vaccine.2005.11.049 [DOI] [PubMed] [Google Scholar]
- Quevillon E. L., Diaz F., Jaramillo L., Lascurain R., Gutierrez-Pabello J. A., Castaneda F. A., Arriaga C., Perez R., Gonzalez X. E. 2013. Comparison of immune peripheral blood cells in tuberculin reactor cattle that are seropositive or seronegative for Mycobacterium bovis antigens. Vet. Immunol. Immunopathol. 153(3–4):194–201. doi: 10.1016/j.vetimm.2013.02.016 [DOI] [PubMed] [Google Scholar]
- Roth J. A. 2008. Evaluation of cell-mediated immunity. In: Large Animal. Proc. North Am. Vet. Conf., Orlando, FL: p. 49. [Google Scholar]
- Salak-Johnson J. L., McGlone J. J. 2007. Making sense of apparently conflicting data: Stress and immunity in swine and cattle. J. Anim. Sci. 85(13 Suppl).:E81–E88. doi: 10.2527/jas.2006-538 [DOI] [PubMed] [Google Scholar]
- Schneider M. J., Tait R. G., Busby W. D., Reecy J. M. 2009. Evaluation of bovine respiratory disease complex in feedlot cattle: Impact on performance and carcass traits using treatment records and lung lesions score. J. Anim. Sci. 87:1821–1827 [DOI] [PubMed] [Google Scholar]
- Snowder G. D., Van Vleck L. D., Cundiff L. V., Bennett G. L., Koohmaraie M., Dikeman M. E. 2007. Bovine respiratory disease in feedlot cattle: Phenotypic, environmental, and genetic correlations with growth, carcass, and longissimus muscle palatability traits. J. Anim. Sci. 85(8):1885–1892. doi: 10.2527/jas.2007-0008 [DOI] [PubMed] [Google Scholar]
- Tait R. G., Jr, Downey E. D., Mayes M. S., Park C. A., Ridpath J. F., Garrick D. J., Reecy J. M. 2013. Evaluation of response to bovine viral diarrhea virus type 2 vaccination and timing of weaning on yearling ultrasound body composition, performance, and carcass quality traits in Angus calves. J. Anim. Sci. 91(11):5466–5476. doi: 10.2527/jas.2012-5891 [DOI] [PubMed] [Google Scholar]
- Theurer M. E., Larson R. L., White B. J. 2015. Systematic review and meta-analysis of the effectiveness of commercially available vaccines against bovine herpesvirus, bovine viral diarrhea virus, bovine respiratory syncytial virus, and parainfluenza type 3 virus for mitigation of bovine respiratory disease complex in cattle. J. Am. Vet. Med. Assoc. 246(1):126–142. doi: 10.2460/javma.246.1.126 [DOI] [PubMed] [Google Scholar]
- Wein Y., Bar Shira E., Friedman A. 2016. Avoiding handling-induced stress in poultry: Use of uniform parameters to accurately determine physiological stress. Poult. Sci. 96(1):65–73. [DOI] [PubMed] [Google Scholar]
- Wilson B. K., Richards C. J., Step D. L., Krehbiel C. R. 2017. Best management practices for newly weaned calves for improved health and well-being. J. Anim. Sci. 95(5):2170–2182. doi: 10.2527/jas.2016.1006 [DOI] [PubMed] [Google Scholar]


