

Abstract
Gilt progeny (GP) are born and weaned lighter than sow progeny (SP) and have higher rates of mortality. This study aimed to quantify the performance and survival differences between GP and SP throughout the entire production cycle from birth to sale. Furthermore, the study looked at the effects of segregating GP and SP compared with commingling during rearing within common pens. It was hypothesized that GP would be lighter than SP at every age and have lower rates of survival accompanied by higher rates of medication, and that segregating GP and SP would improve the growth and survival of both groups. All progeny born to 109 gilts (parity 1) and 94 sows (parities 2 to 8) were allocated to 4 postweaning treatments at birth: GP separately penned, GP mixed with SP in a common pen (GM), SP separately penned, and SP mixed with GP in a common pen (SM), with littermates split among treatments. The GM and SM pigs were penned together after weaning. Individual live weight of all progeny was recorded at birth (birth weight [BWT]), weaning (28 d; weaning weight [WWT]), 10 wk of age (10-wk weight [10WT]), and sale (22–23 wk; sale weight [SWT]). Individual HCW, backfat depth, loin depth, and dressing percentage were measured at slaughter. All postweaning mortalities and medications were recorded. The GP had a lighter BWT (P = 0.032), WWT (P < 0.001), 10WT (P < 0.001), and SWT (P < 0.001) than SP as well as a lower HCW (P < 0.001) and dressing percentage (P = 0.012). Postweaning performance differences were mostly attributable to the lighter WWT of GP compared with that of SP when WWT was fitted as a covariate. The GP had a higher mortality in the immediate postweaning period (weaning to 10 wk of age; P = 0.028) and from weaning to sale (P = 0.012) than SP, which was also attributable to lower WWT. The GP exhibited a higher incidence of mortality (P = 0.011) due to respiratory tract infection in the grower–finisher period, despite similar medication rates (P = 0.83). Segregation of GP and SP between pens presented no benefit in terms of growth and survival of both groups while requiring added labor and production considerations and, therefore, is not recommended. This study confirms that GP are lighter than SP, on average, at every stage of life from birth to slaughter and that their performance before weaning is an important determinant for whole-of-life performance.
Keywords: gilt progeny, live weight, pig, segregation, sow progeny, weaning
INTRODUCTION
Parity of the dam can be an important factor in determining the growth and survival of the resulting progeny. Progeny of primiparous sows (gilt progeny [GP]) are lighter at birth (Hendrix et al., 1978; Miller et al., 2012a) and weaning (Wilson and Johnson, 1980; Carney-Hinkle et al., 2013) than multiparous sow progeny (SP) and have lower growth rates from birth to market (Kemme et al., 1997; Gatford et al., 2009). Studies show that GP also have higher rates of mortality and require higher rates of medication (Holyoake, 2006; Miller et al., 2012a). The poorer performance of GP relative to SP is not well understood but believed to be due to a number of factors including low birth weight, poor colostrum and/or milk intake (Miller et al., 2012a,b), and insufficient transfer of maternal immunoglobulins (Le Dividich et al., 2005; Pineiro et al., 2008; Cabrera et al., 2012). Previous comparisons of separate and commingled progeny production systems in the United States have found a benefit of segregating GP and SP between farms in terms of more effective pathogen control, reducing costs of production by the use of targeted nutritional and veterinary treatment programs (Moore, 2001; Boyd et al., 2002; Donovan, 2004). The aims of this experiment were to quantify the differences in performance between GP and SP from birth until slaughter in an Australian commercial production system and to evaluate segregated housing of these progeny after weaning as a management technique to improve the performance of both progeny groups. The general hypothesis examined was that GP would be born lighter and grow slower than SP throughout their lifetime and have higher rates of mortality and medication. and that keeping these progeny groups in separate pens would result in improved growth performance and survival of both GP and SP due to reduced pathogen exposure.
MATERIALS AND METHODS
All experimental procedures performed were approved by both the Rivalea (Australia) Animal Care and Ethics Committee (protocol number 15P023) and the Murdoch University Animal Ethics Committee (protocol number N2778/15) in accordance with the Australian Code for the Care and Use of Animals for Scientific Purposes (National Health and Medical Research Council, 2013).
Experimental Design
The entire experiment was conducted under commercial conditions at the largest piggery site of Rivalea (Australia) Pty. Ltd. (Corowa, Australia). A diagrammatic representation of the experimental design and allocation of treatments is shown in Fig. 1. All piglets (Primegro Genetics, Corowa, NSW, Australia) born to 109 primiparous (gilts; parity 1) and 94 multiparous (parities 2 to 8) Large White × Landrace F1 sows (Primegro Genetics) that farrowed over a 10-d period in March 2015 were included in the experiment. This comprised a total of 1,143 GP and 1,019 SP spread over 5 farrowing houses on 3 separate farms (farms 1, 2, and 3) located within a single site at Corowa, NSW, Australia. Piglets were allocated to this project based solely on their dam's parity, farrowing date, and progeny genotype (commercial crossbreed).
Figure 1.
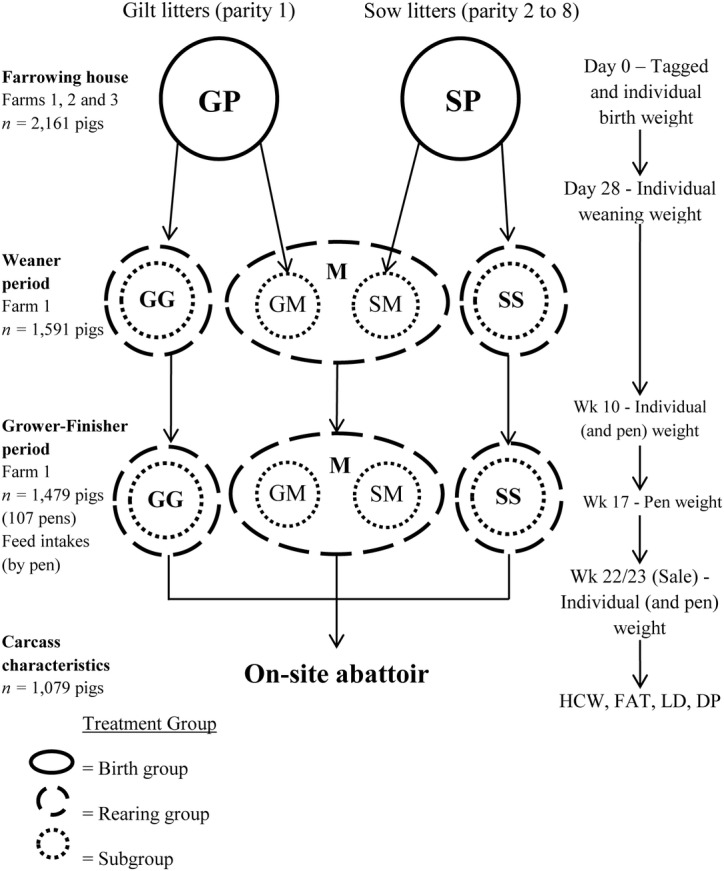
Graphical representation of the experimental procedures used, showing the organization of pigs into treatments and the points of data collection. Birth group treatments are gilt progeny (GP) and sow progeny (SP); rearing group treatments are GP separately penned (GG), SP separately penned (SS), and GP and SP mixed in a common pen (M) and subgroup treatments are GG, SS, GP mixed with SP in a common pen (GM), and SP mixed with GP in a common pen (SM). FAT = carcass fat level measured at the P2 site; LD = carcass loin depth measured at the P2 site; DP = dressing percentage: (HCW/sale weight) × 100.
Piglets were individually identified by ear tag at birth before fostering and randomly assigned to 1 of 4 postweaning treatments at tagging: GP to be reared together after weaning (GP separately penned [GG]), SP to be reared together (SP separately penned [SS]), GP mixed with SP in a common pen (GM), and SP mixed with GP in a common pen (SM). Two-thirds of pigs in each litter were allocated to the segregated treatments (GG and SS), and the other third were allocated to the mixed treatments (GM and SM). Individual live birth weight (BWT) was recorded, along with dam parity, litter size (LS), and farm and shed of birth. Minimal cross-fostering of piglets was performed within progeny groups to standardize LS to between 8 and 12 piglets, such that GP were nursed only by gilts and SP were nursed only by sows for the entire preweaning period. Due to commercial considerations and the experimental design to balance treatment groups, some litters could not be included in the experiment in their entirety. Piglets were individually weighed at weaning (average 27.89 ± 0.05 d of age; weaning weight [WWT]), and ADG during this preweaning period was calculated. After weaning, pigs were transported to a single weaner facility at farm 1 and separately grouped into pens for GG and SS treatments, whereas GM and SM piglets were commingled into common “mixed” pens. For mixed pens (GP and SP mixed in a common pen [M]), the allocation of GM and SM treatments was targeted toward a ratio of 1:1 of each treatment group. All groups shared the same airspace, and pens were divided by steel bars allowing nose-to-nose contact between adjacent pens. Mixed pens were placed between 2 segregated pens, where possible, to minimize direct contact between segregated pens. Pigs from each source farm were kept in separate pens as much as possible, and the source farm or farms of each pen was recorded. These treatment groups were maintained throughout the grower–finisher period, although pen sizes were reduced (see Animal Management).
Pigs were individually weighed at 10 wk of age (10-wk weight [10WT]) and sale (sale weight [SWT]), and ADG was calculated from 4 to 10 wk of age and from 10 wk of age to sale. Average daily gain was additionally calculated from weaning to sale (4 wk to sale) and from birth to sale. Total pen weights were obtained, and an average pig weight was calculated from individual weights at 10 wk of age (average pig weight at 10 wk of age [P10WT]) and sale, with an extra pen weight at 17 wk of age recorded. Total feed consumed was recorded from 10 to 17 wk of age and from 17 wk of age to sale on a pen-by-pen basis, with feed administered and measured using an electronic feed cart fitted with a weigh scale. From these pen data, ADG, ADFI, and G:F were calculated and were represented as averages per pig, with an adjustment for pigs that died during that period. Values were adjusted depending on the number of pigs that were consuming feed each day (“pig days”). The date and reason for any mortalities or removals were recorded throughout the experiment.
At sale, pigs were given individual tattoos for carcass identification. Hot carcass weight was measured on a hanging scale at slaughter, and backfat (measured at the P2 site, 65 mm down the side at the level of the head of the last rib [FAT]) and carcass loin depth measured at the P2 site (LD; 6.5 cm from the midline over the last rib) were measured using a Hennessy Grading Probe (Hennessy Grading Systems Ltd., Auckland, New Zealand). Dressing percentage (HCW/SWT × 100) was calculated, and heavily trimmed carcasses were excluded from the analysis.
Animal Management
Gilts were housed separately from multiparous sows at farms 1 and 3 in static groups of 40 and 10, respectively, but housed together in common pens with parity 1 and 2 sows at farm 2 in dynamic groups of 250 during gestation with approximately 2 m2/sow space allowance. Sows were moved into the farrowing houses approximately 8 d before their expected farrow date and housed in individual farrowing pens. Each farrowing crate or pen was fitted with a drinker nipple for both sows and piglets and a creep area for piglets fitted with a heat lamp. Piglets were given an injection of 200 mg of Fe (Gleptosil; Champion Alstoe Animal Health, Whitby, ON, Canada) and 2 mL of mycoplasma vaccine (RespiSure One; Zoetis Australia Pty. Ltd., NSW, Australia) 2 d after birth, and their tails were docked. All sows were fed a common gestation (averaging 12.9 MJ DE/kg, 13.3% CP, and 0.5% available Lys, as-fed basis) and lactation (14.9 MJ DE/kg, 17.1% CP, and 0.9% available Lys) diet throughout the experiment. Piglets were provided ad libitum access to creep feed (15.3 MJ DE/kg, 21.5% CP, and 1.5% available Lys) and vaccinated against porcine circovirus type 2 (Ingelvac CircoFLEX; Boehringer Ingelheim Pty. Ltd., Sydney, NSW, Australia) approximately 1 wk before weaning.
All 3 farms performed weaning on separate days, and pigs from farm 2 were weaned over 2 d. As such, pigs were separated into sexes and transported to the weaner facility at farm 1 over a 4-d period at weaning. Commercial weaning procedures resulted in litters being mixed and randomly represented between pens, with no more than 6 siblings represented in the same weaner pen. This facility consisted of 2 sheds containing different sized pens (small, approximately 35 pigs/pen, and large, approximately 70 pigs/pen, with a space allowance of 0.22 m2/pig regardless of pen size), each fitted with heat lamps and drinker nipples. During this period, pigs were given ad libitum access to a standard commercial starter diet (averaging 14.1 MJ DE/kg, 17.0% CP, and 1.2% available Lys) for the first 10 d after weaning and standard commercial weaner 1 (14.9 MJ DE/kg, 21.6% CP, and 1.3% available Lys) and weaner 2 (14.5 MJ DE/kg, 21.8% CP, and 1.2% available Lys) diets thereafter. Piglets received an additional vaccination against mycoplasma (Respisure; Zoetis Australia Pty. Ltd.) at 8 wk of age. An autogenous vaccine against Actinobacillus pleuropneumoniae (APP) was administered at 8 wk of age and again at 10, 12, 15, and 18 wk of age.
At approximately 10 wk of age, all pigs were moved into the grower–finisher facility at farm 1 on a single day. Pigs were moved into pens of 14 pigs/pen (approximately 0.66 m2/pig) fitted with drinker nipples, with females and males housed in separate sheds. Pigs that were penned together in the weaner facility were kept together as much as possible when reallocated to grower–finisher pens to avoid remixing, and no more than 5 siblings were represented in the same pen. Individual pig weights at this point (10WT) were taken over the next 3 d. During this period, pigs were given ad libitum access to standard commercial grower (averaging 13.9 MJ DE/kg, 16.2% CP, and 1.0% available Lys) and finisher (averaging 13.5 MJ DE/kg, 13.9% CP, and 0.8% available Lys) diets. Males were immunologically castrated using a GnRH boar taint vaccine (Improvac; Zoetis Australia Pty. Ltd.) given at 13 and 20 wk of age. Individual pigs showing clinical signs of APP infection (shortness of breath, cyanosis, nasal bleeding, etc.) were treated with florfenicol (Selectan; Laboratorios HIPRA, S.A., Girona, Catalonia, Spain) and meloxicam (Metacam; Boehringer Ingelheim Pty. Ltd.) and left in their respective pens. All individual medical treatments were recorded.
Pigs were sent to an on-site abattoir for processing the day after SWT was determined. Females were sold at 22 wk of age and males at 23 wk of age, over 3 separate days each week coinciding with the date on which they were weighed at the start of the grower–finisher period. Therefore, the growth period was identical within sex.
Statistical Analysis
The data were analyzed using 3 model variations (Fig. 1): 1) the birth group model, where treatments were based on the parity of the birth dam, regardless of how progeny were reared after weaning (i.e., GP vs. SP); 2) the rearing group model, based on how the progeny were grouped in pens after weaning (i.e., contrasts among GG, SS, and M); and 3) the subgroup model, where the rearing group model treatment M was split into its 2 separate treatments (i.e., GG, SS, GM, and SM). For the subgroup model, the following contrasts were considered: 1) GG vs. GM and 2) SS vs. SM. Individual performance data were analyzed using the MIXED procedure of SPSS (IBM SPSS version 21.0; IBM, Chicago, IL), with individual pig as the experimental unit.
For all traits and models, both treatment and sex were included as fixed factors. Dam parity group (parity 1, parities 2 to 4, and parity >4) nested within birth group treatment was fitted as a class effect for each trait to test for the effect of the range of multiparous sow parities included in the experiment. The age of the animal at time of live weight measurement was fitted as a covariate for each trait as appropriate. Litter of birth (to account for the impact of both common genes and a common environment before weaning), farm of birth, farrowing shed of birth, weaner pen, finisher pen, and source farm of each pen were tested as random factors in each model where appropriate.
Birth weight was analyzed with and without fitting LS as a covariate. To investigate the impact of earlier live weights on later growth performance, BWT was fitted as a covariate in the analysis of WWT and preweaning ADG to determine how much variation in preweaning growth was attributable to BWT. Similarly, WWT was fitted as a covariate for postweaning performance traits.
Average pen performance data in the grower–finisher period (using the rearing group treatment model) were analyzed as a univariate ANOVA using the GLM procedure of SPSS, with pen as the experimental unit. Therefore, random effects associated with individuals could not be accommodated in the pen ANOVA. For traits within the grower–finisher facility, the number of days between entry to the grower–finisher facility and measurement of 10-wk weight (DAYS) was used as a covariate where appropriate, because pigs were weighed up to 3 d after they entered the facility. As above, models were compared with and without P10WT fitted as a covariate for later traits. Age at sale, nested within sex, was fitted as a covariate for traits recorded at sale or slaughter (SWT, HCW, FAT, etc.) to account for sexes being sold at different ages. Hot carcass weight was fitted as a covariate for FAT and LD.
Postweaning mortality and medication rates were analyzed using a generalized linear mixed model binary logistic regression through the GENLINMIXED procedure of SPSS, with individual pig as the experimental unit. Due to the method for allocation of experimental litters to treatments in the farrowing house, whole litters were not necessarily represented in the experiment, meaning preweaning mortality data were censored and were not able to be analyzed. This was also due to the lack of quality control in recording of preweaning losses, which meant that preweaning mortality data of whole litters was incomplete and, therefore, unreliable. Differences in mortality between GP and SP during the suckling period were, therefore, beyond the scope of this study. During the weaner period (from weaning to 10 wk of age), 4.5% of animals were unable to be identified as having died or not, most likely due to recording error or loss of tag. These animals were, therefore, not included in the analysis of mortality during this period. For the binary logistic regression, WWT of each pig were assigned to quintiles (1 to 5) and this WWT category was fitted as a class effect. This was in order to account for any differences in postweaning mortality that may have been due to differences in weaning weight of the gilt and sow progeny groups.
The number of individual pig observations for each trait and treatment included in the analysis after editing for outliers is presented in Table 1. A P-value < 0.05 was considered significant and P-values between 0.05 and 0.10 were considered a tendency toward significance. Significant differences (P < 0.05) between individual treatment means were determined using a Bonferroni adjustment for multiple pairwise comparisons where appropriate. Estimates are herein reported as least squares means ± SE.
Table 1.
Number of pigs represented in each treatment group for each individual trait (after editing for outliers)
| Model | |||||||
|---|---|---|---|---|---|---|---|
| Birth group2 | Rearing group3 | Subgroup4 | |||||
| Trait1 | GP | SP | GG | SS | M | GM | SM |
| Before weaning (0 to 4 wk) | |||||||
| BWT | 1,143 | 1,019 | 782 | 690 | 690 | 361 | 329 |
| ADG | 834 | 763 | 580 | 512 | 505 | 254 | 251 |
| WWT | 834 | 763 | 580 | 512 | 505 | 254 | 251 |
| Weaner period (4 to 10 wk) | |||||||
| ADG | 756 | 717 | 537 | 483 | 453 | 219 | 234 |
| 10WT | 797 | 737 | 566 | 500 | 468 | 231 | 237 |
| Grower–finisher (10 wk to sale) | |||||||
| ADG | 543 | 533 | 375 | 350 | 351 | 168 | 183 |
| SWT | 546 | 533 | 375 | 350 | 354 | 171 | 183 |
| Lifetime (0 wk to sale) | |||||||
| Wean to sale ADG | 523 | 523 | 355 | 341 | 350 | 168 | 182 |
| Birth to sale ADG | 546 | 533 | 375 | 350 | 354 | 171 | 183 |
| Carcass | |||||||
| HCW | 535 | 520 | 367 | 341 | 347 | 168 | 179 |
| FAT | 540 | 525 | 371 | 345 | 349 | 169 | 180 |
| LD | 539 | 525 | 370 | 345 | 349 | 169 | 180 |
| DP | 535 | 520 | 367 | 341 | 347 | 168 | 179 |
BWT = birth weight; WWT = weaning weight (approximately 4 wk of age); 10WT = 10-wk weight; SWT = sale weight; FAT = carcass fat level measured at the P2 site; LD = carcass loin depth measured at the P2 site; DP = dressing percentage: (HCW/SWT) × 100.
GP = gilt progeny; SP = sow progeny.
GG = GP separately penned; SS = SP separately penned; M = GP and SP mixed in a common pen.
GM = GP mixed with SP in a common pen; SM = SP mixed with GP in a common pen.
RESULTS
For all traits and all model variations, the random effects of farm and shed of birth, weaner and finisher pen, and source farm of each pen were not significant (P > 0.10) and were, therefore, omitted from the models for the analyses. Dam parity nested within birth group treatment was not significant for any traits and was, therefore, also not included in any models. Litter of birth had a significant effect on all traits in the mixed models analysis except for wean to sale ADG and birth to sale ADG and was, therefore, included in the relevant models. The effect of sex tended toward significance (P = 0.095) for BWT but was not significant for any other traits. Sex was left in the model for each trait but estimates are not reported herein. The treatment × sex interaction was not significant for any traits and was, therefore, omitted from the operational models.
Farrowing House
At birth, GP were 60 g lighter (P = 0.032) than SP (Table 2) and 100 g lighter (1.41 ± 0.02 vs. 1.51 ± 0.02 kg; P = 0.001) after accounting for the effect of LS on BWT, based on contrasts from the birth group model. The subgroup model demonstrated that there were no significant differences in BWT between piglets allocated to the GG and GM (P = 0.27) treatment groups or the SS and SM treatment groups (P = 0.56).
Table 2.
Least squares means (SE), and main treatment effects for the birth group model (gilt progeny [GP] and sow progeny [SP]) from the linear mixed models analysis
| Treatment | |||
|---|---|---|---|
| Trait1 | GP | SP | P-value |
| Before weaning (0 to 4 wk) | |||
| BWT, kg | 1.44 (0.02) | 1.50 (0.02) | 0.032 |
| ADG, g/d | 189 (3) | 221 (3) | <0.001 |
| WWT, kg | 6.77 (0.10) | 7.69 (0.10) | <0.001 |
| Weaner period (4 to 10 wk) | |||
| ADG, g/d | 457 (5) | 499 (5) | <0.001 |
| 10WT, kg | 26.6 (0.3) | 29.2 (0.3) | <0.001 |
| Grower–finisher (10 wk to sale) | |||
| ADG, g/d | 850 (6) | 871 (6) | 0.022 |
| SWT, kg | 99.5 (0.8) | 104.7 (0.8) | <0.001 |
| Lifetime (0 wk to sale) | |||
| Wean to sale ADG, g/d | 732 (4) | 746 (4) | 0.006 |
| Birth to sale ADG, g/d | 638 (3) | 652 (4) | 0.003 |
| Carcass | |||
| HCW, kg | 75.4 (0.6) | 80.0 (0.6) | <0.001 |
| FAT,2 mm | 11.4 (0.1) | 11.5 (0.1) | 0.46 |
| LD,2 mm | 53.3 (0.2) | 53.5 (0.2) | 0.56 |
| DP, % | 75.8 (0.1) | 76.1 (0.1) | 0.012 |
BWT = birth weight; WWT = weaning weight (approximately 4 wk of age); 10WT = 10-wk weight; SWT = sale weight; FAT = carcass fat level measured at the P2 site; LD = carcass loin depth measured at the P2 site; DP = dressing percentage: (HCW/SWT) × 100.
Carcass fat (FAT) and LD corrected for HCW (nested within sex).
During the suckling period, GP grew 32 g/d slower (P < 0.001) than SP and were 920 g lighter (P < 0.001) at weaning (Table 2). They remained 770 g lighter (P < 0.001) after accounting for the lighter BWT of GP, which made a significant (P < 0.001) contribution to the overall WWT model when fitted as a covariate (data not shown). Similarly, preweaning ADG was significantly (P < 0.001) affected by BWT, but the contrasts between GP (190 ± 3 g/d) and SP (219 ± 3 g/d) for ADG remained significantly different (P < 0.001) after adjustment for BWT. The subgroup analysis showed that piglets allocated to the SS treatment were lighter (P = 0.002) at weaning than SM piglets by chance (Table 3). This was taken into account for all subsequent postweaning traits by adjusting for WWT nested within birth group treatment as a covariate. There was no difference (P = 0.34) in WWT between piglets allocated to GG and GM treatments (Table 3).
Table 3.
Least squares means (SE) of continuous individual pig performance traits and between treatment pairwise comparisons for the subgroup model from the linear mixed models analysis
| Subgroup2,3 | P-value4 | |||||
|---|---|---|---|---|---|---|
| Trait1 | GG | SS | GM | SM | GG vs. GM | SS vs. SM |
| Before weaning (0 to 4 wk) | ||||||
| BWT, kg | 1.44 (0.02) | 1.50 (0.02) | 1.42 (0.02) | 1.51 (0.03) | 0.54 | 1.00 |
| ADG, g/d | 190 (3) | 216 (4) | 185 (4) | 229 (4) | 0.26 | <0.001 |
| WWT, kg | 6.81 (0.10) | 7.57 (0.11) | 6.66 (0.12) | 7.94 (0.13) | 0.34 | 0.002 |
| Weaner period (4 to 10 wk) | ||||||
| ADG, g/d | 459 (10) | 491 (11) | 469 (11) | 498 (12) | 0.13 | 0.44 |
| 10WT, kg | 27.2 (0.4) | 28.3 (0.5) | 27.7 (0.5) | 28.8 (0.5) | 0.040 | 0.12 |
| Grower–finisher (10 wk to sale) | ||||||
| ADG, g/d | 822 (15) | 904 (17) | 829 (16) | 897 (18) | 0.96 | 0.82 |
| SWT, kg | 97.3 (1.6) | 106.9 (1.7) | 98.9 (1.6) | 107.1 (1.8) | 0.13 | 1.00 |
| Lifetime (0 wk to sale) | ||||||
| Wean to sale ADG, g/d | 733 (12) | 753 (13) | 720 (13) | 748 (14) | 0.22 | 0.92 |
| Birth to sale ADG, g/d | 644 (11) | 654 (12) | 633 (11) | 648 (12) | 0.68 | 0.28 |
| Carcass | ||||||
| HCW, kg | 74.1 (1.2) | 81.0 (1.4) | 75.4 (1.3) | 81.5 (1.5) | 0.12 | 0.86 |
| FAT,5 mm | 11.9 (0.3) | 10.9 (0.4) | 11.8 (0.3) | 11.3 (0.4) | 1.00 | 0.042 |
| LD,5 mm | 52.4 (0.8) | 54.3 (0.8) | 53.0 (0.8) | 54.5 (0.9) | 0.48 | 1.00 |
| DP, % | 75.9 (0.3) | 75.8 (0.3) | 76.0 (0.3) | 75.9 (0.3) | 1.00 | 1.00 |
BWT = birth weight; WWT = weaning weight (approximately 4 wk of age); 10WT = 10-wk weight; SWT = sale weight (approximately 22.5 wk of age); FAT = carcass fat depth measured at the P2 site; LD = carcass loin depth measured at the P2 site; DP = dressing percentage: (HCW/SWT) × 100.
Subgroup model treatments: GG = gilt progeny (GP) separately penned; SS = sow progeny (SP) separately penned; GM = GP mixed with SP in a common pen; SM = SP mixed with GP in a common pen.
Postweaning performance results obtained from the model correcting for WWT nested within birth group treatment to account for random differences in live weight at weaning before subgroup treatments were applied.
Contrast P-values obtained after a Bonferroni adjustment for multiple comparisons.
Carcass fat (FAT) and LD corrected for HCW (nested within sex).
Weaner Period
Gilt progeny grew slower (P < 0.001) than SP from weaning until 10 wk of age (ADG; Table 2), even after adjusting for WWT (P < 0.001; Fig. 2). There was a tendency (P = 0.090) for M pens (both GP and SP) to grow faster (483 ± 4 g/d) than GG pens (471 ± 5 g/d) and SS pens (478 ± 5 g/d) after adjusting for WWT differences. There were no differences (P > 0.10) in ADG in this period between separate and mixed progeny groups (Table 3).
Figure 2.
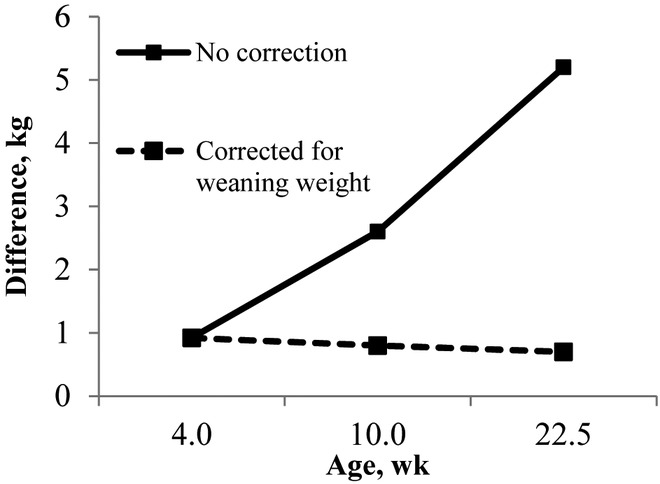
Difference in live weight (in kg) between gilt progeny and sow progeny from weaning (4 wk of age) to sale (22.5 wk of age). Results are shown for the model with no correction and the model with a correction for weaning weight fitted as a covariate.
At 10 wk of age, GP were 2.6 kg lighter (P < 0.001) than their SP counterparts (birth group model; Table 2). This difference reduced to 800 g after accounting for WWT (P = 0.016; Fig. 2). Average weights from M pens were heaviest (28.2 ± 0.2 kg), GG pens were lightest (27.6 ± 0.2 kg), and SS pens were intermediate (27.8 ± 0.2 kg, after accounting for pretreatment WWT differences; P = 0.014). After accounting for pretreatment WWT differences, GM progeny were significantly (P = 0.040) heavier at 10 wk of age than GG progeny but there was no difference (P > 0.10) between SM and SS progeny (Table 3).
Gilt progeny exhibited higher (P = 0.028) rates of mortality in this period than SP (birth group model; 4.2 ± 0.1 vs. 2.2 ± 0.1%, respectively). However, this difference was halved after accounting for WWT5 in the model (2.6 ± 0.7 vs. 1.6 ± 0.5%, respectively; P = 0.11). Main effects of treatment on mortality rates during the weaner phase were not significant (P > 0.10) for the rearing group or subgroup models (data not shown).
Grower–Finisher Period
Gilt progeny grew slower (P = 0.022) than SP between 10 wk of age and sale (ADG; Table 2) and were 5.2 kg lighter at sale (P < 0.001); however, differences were no longer significant when adjusting for WWT (Fig. 2). There were no differences (P > 0.10) among SS, GG, and M pens in the individual MIXED analysis (data not shown). There were no differences (P > 0.10) between separate and mixed progeny groups in terms of ADG in this period (subgroup model) or in terms of SWT (Table 3).
There were no differences (P > 0.10) in overall mortality rates among any of the treatment groups in the grower–finisher period (data not shown). The herd experienced an outbreak of APP at approximately 15 wk of age. Gilt progeny exhibited a higher (P = 0.011) incidence of mortality due to APP infection in the grower–finisher period than SP (8.0 ± 0.0 vs. 6.9 ± 0.0%, respectively); however, rates of medication for treatment of APP symptoms were similar (P = 0.83) between GP (17.1 ± 1.9%) and SP (17.9 ± 2.0%). There was no effect of postweaning subgroup treatment on mortality or APP medication rates (P = 1.00; data not shown).
Pen Performance and Feed Efficiency
Average weight at the start of this period (P10WT) was significantly affected by DAYS (Table 4). Due to differences in ADG before this period among progeny groups, GG pens were lightest, SS pens were heaviest, and M pens were intermediate at the commencement of this period, and therefore, P10WT was used as a covariate for all subsequent traits (Table 4). Pigs in GG pens grew slower (ADG), ate more feed (ADFI), and were less feed efficient (G:F; all P < 0.05) than pigs in SS and M pens in all grower–finisher recording periods (Table 4) except 17 wk to sale, where they grew at the same rate as pigs in the SS and M pens (P > 0.05). However, these differences were no longer significant (P > 0.10) after adjusting for P10WT (Table 4), except for a tendency (P = 0.068) for higher ADG from 10 to 17 wk in SS pens than in GG and M pens and a tendency (P = 0.057) for higher G:F from 10 wk to sale in GG pens than in SS and M pens.
Table 4.
Least squares means (SE) and main penning treatment effect from the univariate ANOVA of average pig performance traits in the grower–finisher period, with pen as the experimental unit
| Treatment4 | |||||
|---|---|---|---|---|---|
| Trait1 | Model2,3 | GG | SS | M | P-value |
| 10 to 17 wk | |||||
| P10WT, kg | y = X + DAYS | 26.2 (0.3)a | 29.2 (0.3)b | 28.6 (0.3)b | <0.001 |
| ADG, g/d | y = X | 728 (6)a | 760 (6)b | 737 (7)a | 0.001 |
| y = X + P10WT | 737 (7) | 753 (7) | 732 (7) | 0.068 | |
| ADFI, g/d | y = X | 1,639 (12)a | 1,748 (13)b | 1,717 (13b | <0.001 |
| y = X + P10WT | 1,680 (13) | 1,719 (12) | 1,698 (12) | 0.13 | |
| G:F, kg:kg | y = X | 0.445 (0.003)a | 0.436 (0.003)ab | 0.430 (0.003)b | 0.003 |
| y = X + P10WT | 0.440 (0.003) | 0.439 (0.003) | 0.432 (0.003) | 0.17 | |
| 17 wk to sale | |||||
| P17WT, kg | y = X | 60.3 (0.5)a | 64.8 (0.5)b | 63.4 (0.5)c | <0.001 |
| y = X + P10WT | 62.7 (0.3) | 63.1 (0.3) | 62.3 (0.3) | 0.16 | |
| ADG, g/d | y = X | 998 (8) | 1,032 (9) | 1,014 (9) | 0.059 |
| y = X + P10WT* | 1,006 (10) | 1,026 (10) | 1,010 (10) | 0.50 | |
| ADFI, g/d | y = X | 2,628 (19)a | 2,753 (21)b | 2,734 (22)b | <0.001 |
| y = X + P10WT | 2,663 (23) | 2,728 (22) | 2,717 (22) | 0.15 | |
| G:F, kg:kg | y = X | 0.380 (0.002)a | 0.372 (0.002)ab | 0.371 (0.003)b | 0.021 |
| y = X + P10WT* | 0.377 (0.003) | 0.374 (0.003) | 0.372 (0.003) | 0.46 | |
| PSWT, kg | y = X | 99.4 (0.6)a | 105.0 (0.6)b | 103.1 (0.7)b | <0.001 |
| y = X + P10WT | 102.1 (0.5) | 103.0 (0.5) | 101.8 (0.5) | 0.21 | |
| 10 wk to sale | |||||
| ADG, g/d | y = X | 845 (5)a | 878 (5)b | 859 (6)ab | <0.001 |
| y = X + P10WT* | 855 (6) | 871 (6) | 854 (6) | 0.11 | |
| ADFI, g/d | y = X | 2,069 (13)a | 2,183 (14)b | 2,164 (15)b | <0.001 |
| y = X + P10WT | 2,112 (14) | 2,152 (14) | 2,143 (14) | 0.19 | |
| G:F, kg:kg | y = X | 0.411 (0.002)a | 0.403 (0.002)b | 0.399 (0.002)b | <0.001 |
| y = X + P10WT | 0.409 (0.002) | 0.405 (0.002) | 0.401 (0.002) | 0.057 | |
| Carcass | |||||
| HCW, kg | y = X | 75.0 (0.5)a | 79.6 (0.5)b | 78.5 (0.5)b | <0.001 |
| y = X + P10WT | 77.1 (0.4) | 78.2 (0.4) | 77.5 (0.4) | 0.22 | |
| FAT,5 mm | y = X + HCW | 11.2 (0.1) | 11.4 (0.1) | 11.6 (0.1) | 0.15 |
| LD,5 mm | y = X + HCW DAYS | 52.6 (0.4) | 53.1 (0.4) | 52.7 (0.4) | 0.77 |
| DP, % | y = X | 75.5 (0.2)a | 75.9 (0.2)ab | 76.0 (0.2)b | 0.11 |
Means within a row with different superscripts significantly differ (P < 0.05) after a Bonferroni adjustment.
P10WT = average pig weight at 10 wk of age, fitted as a covariate in the model; P17WT = average pig weight at 17 wk of age; PSWT = average pig weight at sale (approximately 22.5 wk of age); FAT = carcass fat level measured at the P2 site; LD = carcass loin depth measured at the P2 site; DP = dressing percentage: (HCW/sale weight) × 100.
DAYS = number of days between entry to the grower–finisher facility and measurement of 10-wk weight.
An X in the model equation denotes the basic fixed factors model (treatment + sex), which is consistent for all traits.
Treatment groups: GG = gilt progeny separately penned (n = 40); SS = sow progeny separately penned (n = 35); M = gilt progeny and sow progeny mixed in a common pen (n = 32).
Carcass fat (FAT) and LD corrected for HCW (nested within sex).
Effect of P10WT in the overall model not significant (P > 0.10).
Lifetime Performance and Carcass Characteristics
Consistent with growth results from each period, GP grew slower (P = 0.003) than SP from birth to sale (Table 2), but there were no differences (P > 0.10) in lifetime performance characteristics between separate and mixed groups (GG vs. GM and SS vs. SM; subgroup model; Table 3). Gilt progeny had higher (P = 0.012) rates of mortality in the period from weaning to sale than SP (15.4 ± 0.0 vs. 12.0 ± 0.0%, respectively); however, this was explained, in part, by WWT category (15.2 ± 1.2 vs. 12.3 ± 1.1%, respectively; P = 0.093) when it was fitted as a covariate. There were no mortality or medication rate differences (P > 0.10) between the separate and mixed progeny groups in any of the time periods discussed above (data not shown).
Gilt progeny carcasses were 4.6 kg lighter (P < 0.001) than SP carcasses, with a similar thickness of fat (FAT; P = 0.46) and muscle (LD; P = 0.56) when adjusted for HCW (Table 2). Furthermore, GP had a lower (P = 0.012) dressing percentage than SP (Table 2). There was no difference in HCW between M and SS pens, but GG pens were lighter (P < 0.001) in the rearing group model; however, this difference was no longer significant (P = 0.22) when adjusting for P10WT (Table 4). There were no other carcass differences (FAT, LD, and dressing percentage; P > 0.10) between rearing group treatments in the pen ANOVA (Table 4). Sow progeny were fatter (P = 0.042) in the SS group than in the SM group (FAT; Table 3). There was no difference (P > 0.10) between treatments in the subgroup model in terms of HCW, LD (adjusted for HCW), or dressing percentage (Table 3). If necessary, supplemental material regarding animal numbers and raw data characteristics can be made available on request to the corresponding author.
DISCUSSION
It is important to quantify the performance of progeny from gilt litters compared with that of progeny from sow litters to target management interventions to improve growth performance and survival rates of these animals in the herd. The current results show that GP are born lighter than SP. This is in general agreement with prior studies (Hendrix et al., 1978; Geale et al., 2009; Miller et al., 2012a; Carney-Hinkle et al., 2013); however, these other studies have reported a higher discrepancy in BWT (10–15% lower). Similarly, the finding that GP were 12% lighter than SP at weaning is comparable to those in previous reports using data from different populations (Campbell et al., 1990; Spencer et al., 2003; Geale et al., 2009; Miller et al., 2012a; Carney-Hinkle et al., 2013).
Lower BWT in GP is likely a result of relative immaturity of the gilt at mating resulting in smaller maternal size, which decreases uterine mass (Nielsen et al., 1995) and placental size and thus reduces delivery of nutrients to the conceptus (Gluckman and Hanson, 2004). Gilts are mated at a relatively young age to reduce nonproductive days, which results in gestation and lactation at a time where the gilt is still partitioning energy between her own growth and the growth of her litter (Sinclair et al., 1996; Bunter et al., 2010). Recently, there is evidence to suggest that gilts are under more oxidative stress than multiparous sows during gestation (Roy et al., 2016), which has been linked to interrupted embryonic development, intrauterine growth restriction, and lower piglet BWT (Agarwal et al., 2006; Lykkesfeldt and Svendsen, 2007).
Lighter WWT in GP is a consequence of both lighter BWT and slower preweaning growth rates, and is thought to be mostly a result of decreased colostrum and/or milk production in gilts (Beyer et al., 2007; Devillers et al., 2007; Ngo et al., 2012). This is further evidenced by the increased growth of GP when fostered onto multiparous sows at a young age compared with those suckled by gilts (Pineiro et al., 2008; Geale et al., 2009; Smits and Collins, 2009). Gilts have smaller udders than multiparous sows (Balzani et al., 2016), and any extra energy fed through the lactation diet mostly contributes to growth of the gilt herself rather than increased milk production (Clowes et al., 1998; Pluske et al., 1998; Zak et al., 1998). Furthermore, digestion of nutrients in primiparous sows is not as efficient (Renteria-Flores et al., 2008; Jacyno et al., 2016), which may be as a result of lower intestinal volume (Le Goff and Noblet, 2001; Landgraf et al., 2006) and/or poorer diversity of gastrointestinal tract (GIT) microbial populations (Shi and Noblet, 1993a,b), which are characteristics of lighter BW sows and may, therefore, be of consequence to primiparous sows. These factors may all contribute to suboptimal milk production in gilts and, therefore, undernourishment of GP before weaning.
The fact that preweaning mortality rates between GP and SP were not able to be compared in the current study is unfortunate, because previous published reports are contradictory, with some indicating that GP show lower rates of survival before weaning (Mabry et al., 1983; Holyoake, 2006), others that SP have lower survival rates (Averette et al., 1999; Baxter et al., 2008; Miller et al., 2012a), and others finding no difference (Milligan et al., 2002; Spencer et al., 2003; Gourdine et al., 2004; Carney-Hinkle et al., 2013). However, the statistical power of various studies to detect differences in mortality is sometimes questionable. Furthermore, results were often adjusted for the significant effect of BWT (Milligan et al., 2002; Miller et al., 2012a), which may have altered the outcome and further illustrates the importance of BWT on determining preweaning survival.
Gilt progeny were lighter than SP at every postweaning growth stage up until sale in the current study, with lighter HCW but no differences in body composition as indicated by carcass muscling and fat levels (at a constant HCW). This was in agreement with Edwards et al. (2013), who found that GP were 4.2 kg lighter than SP at 10 wk of age, and Pineiro et al. (2008), who found that GP were significantly lighter than SP at slaughter. Few studies, though, have examined differences in growth performance and carcass quality of GP and SP through to slaughter. Data from the current study shows that GP have a lower dressing percentage than SP at sale, which may be as a result of undernourishment of GP causing preferential growth of the GIT and associated organs rather than skeletal muscle (Ebner et al., 1994; Pluske et al., 2003; Cottrell et al., 2017), but nevertheless should be investigated further.
The finding that GP had decreased survival in the nursery period concurs with other authors (Holyoake, 2006; Miller et al., 2012b; Edwards et al., 2013). Differences in survival rates between GP and SP did not persist to later periods of growth (from 10 wk of age until sale); however, mortality rates in these periods were relatively low and the statistical power to detect differences between treatments is reduced. Few studies have investigated differences in mortality in later growth periods between GP and SP; however, Miller et al. (2012a) found no difference in mortality to sale between GP and SP, in agreement with the current study. This may be due to the decreased importance of maternal immunity in these later stages of life. Despite this, more GP died of APP infection in this later period despite a similar incidence of infection, as indicated by individual medication rates. The observation that GP showed rates of medication similar to those of SP is contrary to previous reports (Holyoake, 2006; Miller et al., 2012b) showing higher rates of medical treatments in GP. This may be the due to the period in which medications were recorded; that is, the current study reported medication rates throughout the whole period from weaning to sale as opposed to shorter periods studied in previous reports. In agreement with the APP-associated mortality in the current study, Edwards et al. (2013) reported that GP showed higher rates of respiratory-related mortality than SP, albeit in the nursery period instead of the grower–finisher period. The present results suggest that APP infection rates of GP may be similar to those of SP, but their reduced immune status may cause them be more severely affected and succumb to infection at a younger age.
Grouping gilts and sows together in gestation may improve the immune competence of gilts due to earlier exposure to pathogens present in the multiparous sow herd. Previous studies (Holyoake, 2006; Miller et al., 2012b; Edwards et al., 2013) do not report whether gilts and sows were commingled on the experimental farms. However, if separation occurred, which is a common practice in gestation group housing systems to facilitate gilt management (Li et al., 2012; Gonyou et al., 2013), this may increase susceptibility of naïve GP to pathogens due to the reduced immune competence of their dams (Klobasa et al., 1985). This, in turn, is likely to cause decreased transfer of maternal immunity to their offspring. In the current study, commingling of gilts with higher parity sows at one of the farms may have resulted in an increase in the immune competence of GP, resulting in reduced mortality rates, which may be a reason why fewer differences were detected between GP and SP than expected. However, this cannot be confirmed from these data. Although farm was included as a factor within the analysis and was found to have no effect on any traits, this factor was not completely balanced and may yet have had an effect that could not be detected given the study design. Additionally, a high herd health status on the experimental site as a result of an extensive vaccination program for both primiparous and multiparous sows and their progeny may have masked some of the expected immunological differences between GP and SP, as a result of relatively low mortality rates in the herd overall.
Reduced postweaning growth rates, live weights, carcass weights, and nursery survival rates of GP were highly attributable to these progeny being born and weaned lighter than their SP counterparts. The lighter the piglet at birth, the lighter it is likely to be at weaning (Winters et al., 1947; Rehfeldt et al., 2008; Beaulieu et al., 2010) and beyond (Quiniou et al., 2002), with light-for-age pigs having less lean mass at sale age, resulting in an increased number of days to market compared with piglets weaned (and born) at heavier weights (Mahan and Lepine, 1991; Dunshea et al., 2003; Rehfeldt et al., 2008). These differences may be as a result of an underdeveloped GIT at weaning in these light-for-age pigs (Pluske et al., 2003; Wiyaporn et al., 2013). Light-for-age pigs had carcass quality (Beaulieu et al., 2010) and backfat levels (Dunshea et al., 2003) similar to pigs born and weaned in higher weight ranges, which is consistent with the findings from the present study. Lower survival rates in the nursery period in GP compared with SP may be due to low birth (and weaning) weights, poorer consumption of colostrum (Ferrari et al., 2014) containing lower levels of maternal immunoglobulins (Inoue et al., 1980; Klobasa and Butler, 1987), and lower circulating IgG concentrations in the piglet (Cabrera et al., 2012), which are all factors that have been shown to highly correlate with both pre- and postweaning mortality (Gardner et al., 1989; Le Dividich et al., 2005; Fix et al., 2010; Devillers et al., 2011; Quesnel et al., 2012). These findings highlight the importance of the preweaning period for giving GP a good start to ensure survival and greater growth performance in later stages of life, up until slaughter.
To the best of the authors' knowledge, the current study is the first large-scale experiment designed to specifically compare whole-of-life growth performance of GP and SP housed both separately and commingled. Generally, GP and SP performed similarly in mixed groups as they did in separated groups in the current study. In fact, contrary to the current hypothesis, GP in mixed pens were approximately 500 g heavier at 10 wk of age than those kept separate from SP and 1.6 kg heavier at sale. More variation in live weight at sale may explain why the latter finding was not found to be significant. A possible explanation for this may be that GP in mixed pens were exposed to less pathogens due to being commingled with healthier, more robust SP. The finding that SP carcasses were fatter when they were mixed with GP may suggest that these SP are able to compete more efficiently with their lighter GP pen-mates for feed. This is supported by the higher feed intake levels in M pens in the grower–finisher period. These findings are in contrast to those from other studies, which may be due to the segregation being between pens on the same farm in close proximity to each other rather than separate farms, as was the case in the data from the United States (Moore, 2001; Boyd et al., 2002; Donovan, 2004). Increased contact between separate and mixed progeny in the current study may have negated this benefit. On the other hand, splitting littermates between separate and mixed treatments would be expected to improve the accuracy of the contrast between these treatments. In light of the current results, separation of GP and SP between pens presents no added benefit, and mixing progeny groups after weaning in favor of separation avoids additional labor and production considerations; however, further research into this concept is needed.
Collectively, these results indicate that the lifetime growth performance of GP is hindered, largely as a result of being born and weaned lighter than progeny born to multiparous sows. Poorer growth and survival in these progeny leads to fewer and lighter pigs reaching market and taking longer to achieve optimal market weight, increasing feed costs and ultimately reducing revenue. Furthermore, we observed that these differences in growth and health performance were not improved by segregation of GP and SP after weaning. Future studies should focus on increasing GP BWT and WWT through interventions to improve their growth in this vital preweaning period.
LITERATURE CITED
- Agarwal A., Gupta S., Sikka S. 2006. The role of free radicals and antioxidants in reproduction. Curr. Opin. Obstet. Gynecol. 18:325–332. doi: 10.1097/01.gco.0000193003.58158.4e [DOI] [PubMed] [Google Scholar]
- Averette L. A., Odle J., Monaco M. H., Donovan S. M. 1999. Dietary fat during pregnancy and lactation increases milk fat and insulin-like growth factor I concentrations and improves neonatal growth rates in swine. J. Nutr. 129:2123–2129. [DOI] [PubMed] [Google Scholar]
- Balzani A., Cordell H. J., Sutcliffe E., Edwards S. A. 2016. Sources of variation in udder morphology of sows. J. Anim. Sci. 94:394–400. doi: 10.2527/jas.2015-9451 [DOI] [PubMed] [Google Scholar]
- Baxter E. M., Jarvis S., D'Eath R. B., Ross D. W., Robson S. K., Farish M., Nevison I. M., Lawrence A. B., Edwards S. A. 2008. Investigating the behavioural and physiological indicators of neonatal survival in pigs. Theriogenology 69:773–783. doi: 10.1016/j.theriogenology.2007.12.007 [DOI] [PubMed] [Google Scholar]
- Beaulieu A. D., Aalhus J. L., Williams N. H., Patience J. F. 2010. Impact of piglet birth weight, birth order, and litter size on subsequent growth performance, carcass quality, muscle composition, and eating quality of pork. J. Anim. Sci. 88:2767–2778. doi: 10.2527/jas.2009-2222 [DOI] [PubMed] [Google Scholar]
- Beyer M., Jentsch W., Kuhla S., Wittenburg H., Kreienbring F., Scholze H., Rudolph P. E., Metges C. C. 2007. Effects of dietary energy intake during gestation and lactation on milk yield and composition of first, second and fourth parity sows. Arch. Anim. Nutr. 61:452–468. doi: 10.1080/17450390701563433 [DOI] [PubMed] [Google Scholar]
- Boyd R. D., Castro G. C., Cabrera R. A. 2002. Nutrition and management of the sow to maximize lifetime productivity. Adv. Pork Prod. 13:47–59. [Google Scholar]
- Bunter K. L., Lewis C. R. G., Hermesch S., Smits R., Luxford B. G. 2010. Maternal capacity, feed intake and body development in sows. In: Proc. 9th World Cong. Genet. Appl. Livest. Prod., Leipzig, Germany: p. 71–78. [Google Scholar]
- Cabrera R. A., Lin X., Campbell J. M., Moeser A. J., Odle J. 2012. Influence of birth order, birth weight, colostrum and serum immunoglobulin G on neonatal piglet survival. J. Anim. Sci. Biotechnol. 3:42. doi: 10.1186/2049-1891-3-42 [DOI] [PMC free article] [PubMed] [Google Scholar]
- Campbell W. J., Brendemuhl J. H., Bazer F. W. 1990. Effect of fructose consumption during lactation on sow and litter performance and sow plasma constituents. J. Anim. Sci. 68:1378–1388. doi: 10.2527/1990.6851378x [DOI] [PubMed] [Google Scholar]
- Carney-Hinkle E. E., Tran H., Bundy J. W., Moreno R., Miller P. S., Burkey T. E. 2013. Effect of dam parity on litter performance, transfer of passive immunity, and progeny microbial ecology. J. Anim. Sci. 91:2885–2893. doi: 10.2527/jas.2011-4874 [DOI] [PubMed] [Google Scholar]
- Clowes E. J., Williams I. H., Baracos V. E., Pluske J. R., Cegielski A. C., Zak L. J., Aherne F. X. 1998. Feeding lactating primiparous sows to establish three divergent metabolic states: II. Effect on nitrogen partitioning and skeletal muscle composition. J. Anim. Sci. 76:1154–1164. doi: 10.2527/1998.7641154x [DOI] [PubMed] [Google Scholar]
- Cottrell J. J., Craig J., Wijesiriwardana U. A., Ty-Ringuet M., Fothergill L., O'Halloran K., Turpin D., Munoz L., Collins C. L., Furness J. B., Dunshea F. R., Pluske J. 2017. The gastrointestinal tract of piglets from first parity sows develops more slowly and is more permeable than piglets from later parity sows. FASEB J. 31(Suppl. 1):792.24. [Google Scholar]
- Devillers N., Farmer C., Le Dividich J., Prunier A. 2007. Variability of colostrum yield and colostrum intake in pigs. Animal 1:1033–1041. doi: 10.1017/S175173110700016X [DOI] [PubMed] [Google Scholar]
- Devillers N., Le Dividich J., Prunier A. 2011. Influence of colostrum intake on piglet survival and immunity. Animal 5:1605–1612. doi: 10.1017/S175173111100067X [DOI] [PubMed] [Google Scholar]
- Donovan T. 2004. How pig flow can affect finishing mortality. In: Proc. A. D. Leman Swine Conf, Minneapolis, MN: p. 128–129. [Google Scholar]
- Dunshea F. R., Kerton D. K., Cranwell P. D., Campbell R. G., Mullan B. P., King R. H., Power G. N., Pluske J. R. 2003. Lifetime and post-weaning determinants of performance indices of pigs. Crop Pasture Sci. 54:363–370. doi: 10.1071/AR02172 [DOI] [Google Scholar]
- Ebner S., Schoknecht P., Reeds P., Burrin D. 1994. Growth and metabolism of gastrointestinal and skeletal muscle tissues in protein-malnourished neonatal pigs. Am. J. Physiol. Regul. Integr. Comp. Physiol. 266:R1736–R1743. [DOI] [PubMed] [Google Scholar]
- Edwards M. V., Campbell R. G., Chapman T., Brouwers H., Pierzynowski S. G., Weström B. R., Prykhod'ko O., Gabor L., Choct M. 2013. Spray-dried porcine plasma and yeast derived protein meal influence the adaption to weaning of primiparous and multiparous sow progeny in different ways. Anim. Prod. Sci. 53:75–86. doi: 10.1071/AN12151 [DOI] [Google Scholar]
- Ferrari C. V., Sbardella P. E., Bernardi M. L., Coutinho M. L., Vaz I. S., Jr, Wentz I., Bortolozzo F. P. 2014. Effect of birth weight and colostrum intake on mortality and performance of piglets after cross-fostering in sows of different parities. Prev. Vet. Med. 114:259–266. doi: 10.1016/j.prevetmed.2014.02.013 [DOI] [PubMed] [Google Scholar]
- Fix J. S., Cassady J. P., Holl J. W., Herring W. O., Culbertson M. S., See M. T. 2010. Effect of piglet birth weight on survival and quality of commercial market swine. Livest. Sci. 132:98–106. doi: 10.1016/j.livsci.2010.05.007 [DOI] [Google Scholar]
- Gardner I. A., Hird D. W., Franti C. E. 1989. Neonatal survival in swine: Effects of low birth weight and clinical disease. Am. J. Vet. Res. 50:792–797. [PubMed] [Google Scholar]
- Gatford K. L., Smits R. J., Collins C. L., Argente C., De Blasio M. J., Roberts C. T., Nottle M. B., Kind K. L., van Wettere W. H. E. J., Owens J. A. 2009. Progeny outcomes following maternal treatment with porcine somatotropin during pregnancy. In: Manipulating Pig Production XII, Cairns, Australia: p. 103. [Google Scholar]
- Geale P. F., Miller Y. J., Dhand N., Holyoake P. K., Sheehy P. A., Wynn P. C. 2009. Rearing dam parity affects piglet preweaning growth rate. In: Manipulating Pig Production XII, Cairns, Australia: p. 45. [Google Scholar]
- Gluckman P. D., Hanson M. A. 2004. Maternal constraint of fetal growth and its consequences. Semin. Fetal Neonatal Med. 9:419–425. doi: 10.1016/j.siny.2004.03.001 [DOI] [PubMed] [Google Scholar]
- Gonyou H. W., Rioja-Lang F., Seddon Y. 2013. Group housing systems: Floor space allowance and group size. National Pork Board, Des Moines, IA. [Google Scholar]
- Gourdine J. L., Renaudeau D., Noblet J., Bidanel J. P. 2004. Effects of season and parity on performance of lactating sows in a tropical climate. Anim. Sci. 79:273–282. doi: 10.1017/S1357729800090135 [DOI] [Google Scholar]
- Hendrix W. F., Kelley K. W., Gaskins C. T., Hinrichs D. J. 1978. Porcine neonatal survival and serum gamma globulins. J. Anim. Sci. 47:1281–1286. doi: 10.2527/jas1978.4761281x [DOI] [PubMed] [Google Scholar]
- Holyoake P. K. 2006. Dam parity affects the performance of nursery pigs. In: 19th Int. Pig Vet. Soc. Congr, Copenhagen, Denmark: p. 149. [Google Scholar]
- Inoue T., Kitano K., Inoue K. 1980. Possible factors influencing the immunoglobulin G concentration in swine colostrum. Am. J. Vet. Res. 41:1134–1136. [PubMed] [Google Scholar]
- Jacyno E., Pietruszka A., Biel W., Kołodziej-Skalska A., Matysiak B., Kawęcka M., Sosnowska A. 2016. Effect of sow age on the apparent total tract digestibility of nutrients in the diet. S. Afr. J. Anim. Sci. 46:230–238. [Google Scholar]
- Kemme P. A., Radcliffe J. S., Jongbloed A. W., Mroz Z. 1997. The effects of sow parity on digestibility of proximate components and minerals during lactation as influenced by diet and microbial phytase supplementation. J. Anim. Sci. 75:2147–2153. doi: 10.2527/1997.7582147x [DOI] [PubMed] [Google Scholar]
- Klobasa F., Butler J. E. 1987. Absolute and relative concentrations of immunoglobulins G, M, and A, and albumin in the lacteal secretion of sows of different lactation numbers. Am. J. Vet. Res. 48:176–182. [PubMed] [Google Scholar]
- Klobasa F., Habe F., Werhahn E., Butler J. E. 1985. The influence of age and breed on the concentrations of serum IgG, IgA and IgM in sows throughout the reproductive cycle. Vet. Immunol. Immunopathol. 10:355–366. doi: 10.1016/0165-2427(85)90024-8 [DOI] [PubMed] [Google Scholar]
- Landgraf S., Susenbeth A., Knap P. W., Looft H., Plastow G. S., Kalm E., Roehe R. 2006. Development of carcass cuts, organs, body tissue and chemical body composition during growth of pigs. Anim. Sci. 82:889–899. doi: 10.1017/ASC2006097 [DOI] [Google Scholar]
- Le Dividich J., Rooke J. A., Herpin P. 2005. Nutritional and immunological importance of colostrum for the new-born pig. J. Agric. Sci. 143:469–485. doi: 10.1017/S0021859605005642 [DOI] [Google Scholar]
- Le Goff G., Noblet J. 2001. Comparative total tract digestibility of dietary energy and nutrients in growing pigs and adult sows. J. Anim. Sci. 79:2418–2427. doi: 10.2527/2001.7992418x [DOI] [PubMed] [Google Scholar]
- Li Y. Z., Wang L. H., Johnston L. J. 2012. Sorting by parity to reduce aggression toward first-parity sows in group-gestation housing systems. J. Anim. Sci. 90:4514–4522. doi: 10.2527/jas.2011-4869 [DOI] [PubMed] [Google Scholar]
- Lykkesfeldt J., Svendsen O. 2007. Oxidants and antioxidants in disease: Oxidative stress in farm animals. Vet. J. 173:502–511. doi: 10.1016/j.tvjl.2006.06.005 [DOI] [PubMed] [Google Scholar]
- Mabry J. W., Coffey M. T., Seerley R. W. 1983. A comparison of an 8- versus 16-hour photoperiod during lactation on suckling frequency of the baby pig and maternal performance of the sow. J. Anim. Sci. 57:292–295. doi: 10.2527/jas1983.572292x [DOI] [PubMed] [Google Scholar]
- Mahan D. C., Lepine A. J. 1991. Effect of pig weaning weight and associated nursery feeding programs on subsequent performance to 105 kilograms body weight. J. Anim. Sci. 69:1370–1378. doi: 10.2527/1991.6941370x [DOI] [PubMed] [Google Scholar]
- Miller Y. J., Collins A. M., Emery D., Begg D. J., Smits R. J., Holyoake P. K. 2012a. Piglet performance and immunity is determined by the parity of both the birth dam and the rearing dam. Anim. Prod. Sci. 53:46–51. doi: 10.1071/AN12063 [DOI] [Google Scholar]
- Miller Y. J., Collins A. M., Smits R. J., Thomson P. C., Holyoake P. K. 2012b. Providing supplemental milk to piglets preweaning improves the growth but not survival of gilt progeny compared with sow progeny. J. Anim. Sci. 90:5078–5085. doi: 10.2527/jas.2011-4272 [DOI] [PubMed] [Google Scholar]
- Milligan B. N., Fraser D., Kramer D. L. 2002. Within-litter birth weight variation in the domestic pig and its relation to pre-weaning survival, weight gain, and variation in weaning weights. Livest. Prod. Sci. 76:181–191. doi: 10.1016/S0301-6226(02)00012-X [DOI] [Google Scholar]
- Moore C. 2001. Segregated production: How far could we go? In: Proc. A. D. Leman Swine Conf, Minneapolis, MN: p. 203–206. [Google Scholar]
- National Health and Medical Research Council 2013. Australian code for the care and use of animals for scientific purposes. 8th ed.National Health and Medical Research Council, Canberra, ACT, Australia. [Google Scholar]
- Ngo T. T., Quiniou N., Heugebaert S., Paboeuf F., Dourmad J. Y. 2012. Effect of parity and number of suckling piglets on milk production of sows. Journ. Rech. Porcine Fr., [C. R.] 44:195–196. [Google Scholar]
- Nielsen M. K., Kittok R. J., Kochera Kirby Y. L. 1995. Uterine mass and uterine blood volume in mice selected 21 generations for alternative criteria to increase litter size. J. Anim. Sci. 73:2243–2248. doi: 10.2527/1995.7382243x [DOI] [PubMed] [Google Scholar]
- Pineiro C., Pineiro M., Morales J. 2008. Effect of gestation and rearing on productive performance of the offspring of primiparous and multiparous sows. Journ. Rech. Porcine Fr., [C. R.] 40:261–262. [Google Scholar]
- Pluske J. R., Kerton D. K., Cranwell P. D., Campbell R. G., Mullan B. P., King R. H., Power G. N., Pierzynowski S. G., Westrom B., Rippe C. 2003. Age, sex, and weight at weaning influence organ weight and gastrointestinal development of weanling pigs. Aust. J. Agric. Res. 54:515–527. doi: 10.1071/AR02156 [DOI] [Google Scholar]
- Pluske J. R., Williams I. H., Zak L. J., Clowes E. J., Cegielski A. C., Aherne F. X. 1998. Feeding lactating primiparous sows to establish three divergent metabolic states: III. Milk production and pig growth. J. Anim. Sci. 76:1165–1171. doi: 10.2527/1998.7641165x [DOI] [PubMed] [Google Scholar]
- Quesnel H., Farmer C., Devillers N. 2012. Colostrum intake: Influence on piglet performance and factors of variation. Livest. Sci. 146:105–114. doi: 10.1016/j.livsci.2012.03.010 [DOI] [Google Scholar]
- Quiniou N., Dagorn J., Gaudré D. 2002. Variation of piglets' birth weight and consequences on subsequent performance. Livest. Prod. Sci. 78:63–70. doi: 10.1016/S0301-6226(02)00181-1 [DOI] [Google Scholar]
- Rehfeldt C., Tuchscherer A., Hartung M., Kuhn G. 2008. A second look at the influence of birth weight on carcass and meat quality in pigs. Meat Sci. 78:170–175. doi: 10.1016/j.meatsci.2007.05.029 [DOI] [PubMed] [Google Scholar]
- Renteria-Flores J. A., Johnston L. J., Shurson G. C., Gallaher D. D. 2008. Effect of soluble and insoluble fiber on energy digestibility, nitrogen retention, and fiber digestibility of diets fed to gestating sows. J. Anim. Sci. 86:2568–2575. doi: 10.2527/jas.2007-0375 [DOI] [PubMed] [Google Scholar]
- Roy C., Lavoie M., Richard G., Archambault A., Lapointe J. 2016. Evidence that oxidative stress is higher in replacement gilts than in multiparous sows. J. Anim. Physiol. Anim. Nutr. 100:911–919. doi: 10.1111/jpn.12462 [DOI] [PubMed] [Google Scholar]
- Shi X. S., Noblet J. 1993a. Contribution of the hindgut to digestion of diets in growing pigs and adult sows: Effect of diet composition. Livest. Prod. Sci. 34:237–252. doi: 10.1016/0301-6226(93)90110-4 [DOI] [Google Scholar]
- Shi X. S., Noblet J. 1993b. Digestible and metabolizable energy values of ten feed ingredients in growing pigs fed ad libitum and sows fed at maintenance level; Comparative contribution of the hindgut. Anim. Feed Sci. Technol. 42:223–236. doi: 10.1016/0377-8401(93)90100-X [DOI] [Google Scholar]
- Sinclair A. G., Edwards S. A., Hoste S., McCartney A., Fowler V. R. 1996. Partitioning of dietary protein during lactation in the Meishan synthetic and European White breeds of pig. Anim. Sci. 62:355–362. doi: 10.1017/S1357729800014673 [DOI] [Google Scholar]
- Smits R. J., Collins C. L. 2009. Progeny reared by their birth dam do not outperform progeny crossfostered to a similar parity dam. In: Manipulating Pig Production XII, Cairns, Australia: p. 143. [Google Scholar]
- Spencer J. D., Boyd R. D., Cabrera R., Allee G. L. 2003. Early weaning to reduce tissue mobilization in lactating sows and milk supplementation to enhance pig weaning weight during extreme heat stress. J. Anim. Sci. 81:2041–2052. doi: 10.2527/2003.8182041x [DOI] [PubMed] [Google Scholar]
- Wilson E. R., Johnson R. K. 1980. Adjustment of 21-day litter weight for number of pigs nursed for purebred and crossbred dams. J. Anim. Sci. 51:37–42. doi: 10.2527/jas1980.51137x [DOI] [Google Scholar]
- Winters L. M., Cummings J. N., Stewart H. A. 1947. A study of factors affecting survival from birth to weaning and total weaning weight of the litter in swine. J. Anim. Sci. 6:288–296. doi: 10.2527/jas1947.63288x [DOI] [PubMed] [Google Scholar]
- Wiyaporn M., Thongsong B., Kalandakanond-Thongsong S. 2013. Growth and small intestine histomorphology of low and normal birth weight piglets during the early suckling period. Livest. Sci. 158:215–222. doi: 10.1016/j.livsci.2013.10.016 [DOI] [Google Scholar]
- Zak L. J., Williams I. H., Foxcroft G. R., Pluske J. R., Cegielski A. C., Clowes E. J., Aherne F. X. 1998. Feeding lactating primiparous sows to establish three divergent metabolic states: I. Associated endocrine changes and postweaning reproductive performance. J. Anim. Sci. 76:1145–1153. doi: 10.2527/1998.7641145x [DOI] [PubMed] [Google Scholar]