Abstract
Methane emission is currently an important trait in studies on ruminants due to its environmental and economic impact. Recent studies were based on short-time measurements on individual cows. As methane emission is a longitudinal trait, it is important to investigate its changes over a full lactation. In this study, we aimed to estimate the heritability of the estimated methane emissions from dairy cows using Fourier-transform infrared spectroscopy during milking in an automated milking system by implementing the random regression method. The methane measurements were taken on 485 Polish Holstein-Friesian cows at 2 commercial farms located in western Poland. The overall daily estimated methane emission was 279 g/d. Genetic variance fluctuated over the course of lactation around the average level of 1,509 (g/d)2, with the highest level, 1,866 (g/d)2, at the end of the lactation. The permanent environment variance values started at 2,865 (g/d)2 and then dropped to around 846 (g/d)2 at 100 d in milk (DIM) to reach the level of 2,444 (g/d)2 at the end of lactation. The residual variance was estimated at 2,620 (g/d)2. The average repeatability was 0.25. The heritability level fluctuated over the course of lactation, starting at 0.23 (SE 0.12) and then increasing to its maximum value of 0.3 (SE 0.08) at 212 DIM and ending at the level of 0.27 (SE 0.12). Average heritability was 0.27 (average SE 0.09). We have shown that estimated methane emission is a heritable trait and that the heritability level changes over the course of lactation. The observed changes and low genetic correlations between distant DIM suggest that it may be important to consider the period in which methane phenotypes are collected.
Keywords: heritability, methane emission, random regression
INTRODUCTION
Methane (CH4) emission is an important trait in studies on ruminants due to its environmental impact. The estimated contribution of the livestock sector to the total anthropogenic greenhouse gas emissions is about 18% globally (Steinfeld et al., 2006) and about 13% in the European Union (Leip et al., 2010). Methane emission is also related to the loss of GE (2 to 12%) provided with the feed (Murray et al., 1976; Johnson et al., 1993).
About 90% of the enteric CH4 is released during eructation events and by breathing (Murray et al., 1976). This opens up a possibility for introducing breath analyzing techniques for quantifying CH4 emissions from ruminants. Recently, a number of breath analyzing techniques using infrared (Garnsworthy et al., 2012a; Lassen et al., 2012; Negussie et al., 2016) or laser techniques (Chagunda et al., 2009) have been introduced. These techniques are noninvasive, fast, and cost effective and may be implemented in a production environment and, thus, meet standards for generating phenotypes for genetic analyses.
Recent studies, based on short-time measurements using noninvasive techniques, showed repeatability ranging from 0.33 to 0.46 (Garnsworthy et al., 2012b; Lassen et al., 2012; Lassen and Løvendahl, 2013; Negussie et al., 2016) and heritability ranging from 0.16 to 0.21 (Lassen and Løvendahl, 2016), indicating a potential for genetic improvement. As CH4 emission is a longitudinal trait, it is important to investigate its changes over a full lactation. This can be facilitated by using random regression models, which enable modelling changes in genetic and permanent environment variance across time (Jamrozik et al., 1997; Strabel and Jamrozik, 2006). In this study, we aim to estimate the heritability of CH4 emission over a full lactation measured using the Fourier-transform infrared spectroscopy (FTIR) technique during milking in an automated milking system (AMS) by implementing the random regression method.
MATERIAL AND METHODS
All animal treatments were approved by the Local Ethical Committee for Experiments on Animals in Poznan, Poland (decision number 64/2012).
The CH4 measurements were taken on Polish Holstein-Friesian cows at 2 commercial farms located in western Poland. Methane emission on Farm 1 was measured during 2 periods: one from December 2, 2014, to February 3, 2016, and the other from June 1, 2016, to September 17, 2016, starting at the ninth day in milk (DIM). On Farm 2, the measurements were taken from February 5, 2016, to March 14, 2016, starting at 5 DIM. The measurements were recorded during milking in an AMS (Lely Astronaut A4; Lely Holding, Maassluis, the Netherlands).
Nutrition
On both farms, the animals were fed ad libitum with a partial mixed ration (PMR) with nutrients covering the 25-kg level of milk yield, and additional production was covered by a concentrate distributed in AMS units depending on the animal's productivity. Farms differed in terms of the applied diet composition and feeding routine. The feeding routine on Farm 1 was the following: 0600 h, morning PMR feeding; 0730 h, feed pushing (pushing the feed from the previous feeding such that cows can reach it); 1130 h, feed pushing and PMR feeding; and 1800 h, feed pushing. On Farm 2, the feeding routine was as follows: 0700 h, morning PMR feeding, and 1700 h, afternoon PMR feeding. Feed pushing was performed several times a day at unspecified time points.
Methane Measurements
Methane concentration was measured using an FTIR analyzer (GASMET 4030; Gasmet Technologies Oy, Helsinki, Finland). Air was sampled at the feeding bin of the AMS unit using a heated sampling line. Measurements were taken continuously and stored in the data set every 5 s as the 5-s averages. Every 24 h, gaseous nitrogen was used to automatically adjust the zero point of the analyzer. Farm 1 was equipped with 3 AMS units and Farm 2 was equipped with 2 AMS units. At each farm, the methane concentration in the AMS units was measured for 24 h. The change between AMS units was performed automatically.
Background concentration was the median value of the CH4 concentration of the closest period preceding the analyzed milking when no cow was milked. Our analyses (results not shown) indicated that median value was a better estimate of the background concentration than the mean value. Observations up to 305 DIM were analyzed. In total, 443,533 milkings with CH4 measurements recorded on 483 cows were available for analysis (for more details, see Table 1).
Table 1.
Data description
| Farm's characteristics | Farm 1 | Farm 2 | ||
|---|---|---|---|---|
| No. of animals with records | 356 | 127 | ||
| No. of measurements | 437,888 | 5,645 | ||
| No. of daily observations | 31,239 | 3,190 | ||
| Measuring period 1 | Dec. 2, 2014 | Feb. 3, 2016 | Feb. 5, 2016 | Mar. 14, 2016 |
| Measuring period 2 | June 1, 2016 | Sept. 17, 2016 | NA1 | NA |
| Lactation | Lactation | |||
|---|---|---|---|---|
| 1 | 2+ | 1 | 2+ | |
| No. of records per lactation | 288,272 | 149,616 | 2,060 | 3,585 |
| No. of cows per lactation | 250 | 165 | 45 | 84 |
| Average measurement period, d | 83 | 64 | 25 | 25 |
| Minimum measurement period, d | 7 | 5 | 5 | 5 |
| Maximum measurement period, d | 171 | 183 | 37 | 35 |
NA = not available.
Daily estimated CH4 emission was quantified in grams per day. First, CH4 emission in liters per day was calculated according to Madsen et al. (2010) as follows: the ratios between CH4 and CO2 concentrations were averaged over each milking and multiplied by the expected CO2 emission (L/d) calculated based on the heat production unit following Pedersen et al. (2008). Then, CH4 emission was converted to grams per day. The conversion was made using the CH4 density of 0.668 g/L (i.e., assuming normal temperature and pressure of 20°C and 101.325 kPa). In this way, multiple daily CH4 outputs per cow were obtained, which were used in further analyses.
The fixed effects were selected based on the likelihood ratio test using a mixed model approach with the random cow effect using the lme4 package (Bates et al., 2015) implemented in the R software (R Development Core Team, 2013).
Genetic components were estimated based on the predicted daily average values for methane per cow. The daily averages for the estimated CH4 were obtained as follows: 1) Each data set was adjusted for the AMS unit and diurnal variation in the estimated CH4 emissions and 2) corrected estimated CH4 emissions were averaged within the same date for each cow. Separate correction for the AMS unit and diurnal variation was performed due to differences between farms (see Fig. 1). The corrections were made based on the following linear regression model:
Figure 1.
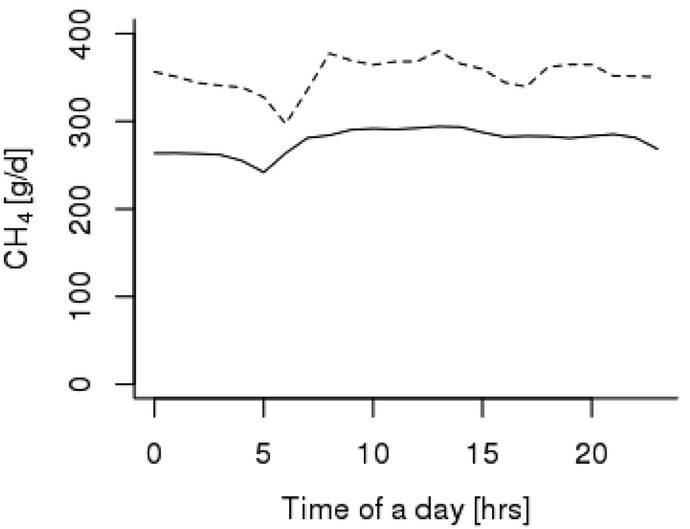
Diurnal variation in CH4 emissions in 2 farms (Farm 1 = solid line and Farm 2 = dashed line).
 |
in which is the estimated CH4 output for each milking of the ith cow milked at the jth AMS unit at time m. Diurnal variation was modeled using a Fourier series approach adopted after Løvendahl and Bjerring (2006) and Lassen et al. (2012):  and
and  are fixed regression coefficients of the Fourier series and
  is 2πs/86,400, in which s is the second of the day in which the measurement was taken. The constant of 86,400 scales s to values ranging from 0 to 1. Initial analyses of the different regression order (not shown here) indicated that the fifth-order regression gave the best fit to the diurnal variation of CH4. The adjustment of the CH4 records was achieved by subtracting the effects of a particular AMS unit and the effect of the diurnal variation for a given milking estimated with Model [1].
The final model to estimate genetic components included random effects, which were selected based on a comparison of the Akaike information criteria and Bayesian information criteria obtained from ASReml 4.1 (Gilmour et al., 2014). The model included the pedigree of the animals with methane records. The random animal and permanent environment effects were included in the model with up to the second level of Legendre polynomials (Kirkpatrick et al., 1990). The overall lactation curve was modeled with third-order polynomials. The final model used to estimate heritability was the following:
 |
in which is the estimated and adjusted average daily CH4 output of the ith cow in the jth lactation, the kth day in milk (DIM), and the lth year–week of the measurement, where year–week of the measurement (YK), where YK are farm specific; βn are fixed regression coefficients. Lactation (LAC) had two levels: 1 and 2+, in which records from up to lactation 8 were included (for detailed distribution of cows with records over lactations, see Table 2). The general lactation curve was modeled using third-order Legendre polynomials. The structure of collected data made it possible to model random animal (animal) and permanent environment (pe) effects with second-order Legendre polynomials.
Table 2.
Number of cows with CH4 records per lactation per location
| Lactation | Farm 1 | Farm 2 |
|---|---|---|
| 1 | 250 | 44 |
| 2 | 138 | 42 |
| 3 | 23 | 19 |
| 4 | 7 | 11 |
| 5 | 1 | 4 |
| 6 | 2 | 3 |
| 7 | 0 | 1 |
| 8 | 1 | 2 |
| 9 | 0 | 1 |
| 2+ | 165 | 83 |
RESULTS AND DISCUSSION
Average CH4 Emission
The overall daily estimated CH4 emission was 279 g/d (SD 63.7). Farm 2 had higher CH4 emissions by about 73 g/d, whereas animals kept on that farm were heavier than on Farm 1 by approximately 125 kg and produced approximately 3 kg more milk (see Table 3 for more details). This may indicate differences in feed intake or efficiency of the cows kept at different farms. To investigate this issue, the individual nutrition data would be necessary, which were, unfortunately, unavailable.
Table 3.
Average methane emissions, fat–protein corrected milk (FPCM) yields, and BW for analyzed farms
| Farm 1 | Farm 2 | Farms jointly | ||||
|---|---|---|---|---|---|---|
| Trait | Mean | SD | Mean | SD | Mean | SD |
| Methane, g/d | 272 | 59.0 | 345 | 70.2 | 279 | 63.7 |
| BW, kg | 544 | 114.8 | 670 | 74.9 | 556 | 117.5 |
| FPCM, kg | 34 | 6.8 | 37 | 8.8 | 34 | 7.1 |
The average daily estimated CH4 emission recorded in the present study is generally lower than in other reports. The findings in the literature are closer to results from Farm 2 than those from Farm 1. For example, Lassen and Løvendahl (2016), who used the same analyzer on Danish Holstein cows, showed the average emission of 315 g/d. Similar CH4 emissions were found with different measuring techniques. For example, Chagunda et al. (2009) showed 357 g/d based on laser measurements on Holstein Friesian cows kept in Scotland. Negussie et al. (2016), who measured emissions using photoacoustic infrared spectroscopy based on 115 cows, reported an emission of 831 g/d (converted from 555 L/d). Grainger et al. (2007), who measured methane on a small sample of Australian Holstein cows kept under experimental conditions, indicated an average daily CH4 emission of 331 g when measured using the SF6 tracer method and 322 g when using respiration chambers. Substantially higher values were reported by Bell et al. (2014; 422 g/d) and Garnsworthy et al. (2012a; 430 g/d).
The differences between the average emissions obtained in the present study and in the literature have to be considered with caution, because using a different density to convert from grams per day to liters per day leads to changes in the magnitude of the differences. For example, at an assumed temperature of 0°C, the methane density is higher (0.716 g/L) and, therefore, the differences between the presented values decrease. In the present study, we assumed normal temperature and pressure of 20°C and 101.325 kPa as the analyzer reports the results standardized to such conditions.
Variation in Cows' Heat Production
The results presented in this study are expressed in grams per day. To obtain this unit, the measured CH4 concentrations were converted according to Madsen et al. (2010), who adopted the heat production unit from Pedersen et al. (2008). In this equation, the information on individual production, BW, and pregnancy length are incorporated to calculate the cow's daily CO2 production. The calculations are made ignoring the existence of between-animal variation in the daily CO2 production. Including such a variance would increase the accuracy of the methane emission phenotype. Yet at the moment, a different method allowing estimatimation of methane production based on the setup used in this study is not available.
Variation in Time
The diurnal variation pattern differed between farms (see Fig. 1). On Farm 1, the pattern was slightly smoother than on Farm 2 (i.e., estimated CH4 emission was less variable over the course of a day). The pattern of diurnal variation reported in this study was similar to the patterns shown by others (Garnsworthy et al., 2012a; Lassen et al., 2012; Bell et al., 2014). In general, the estimated CH4 emission level increased after feeding events and dropped over the night period. The main driver for this pattern is connected with management routines, especially those related to feeding. As management routines differ between farms, diurnal patterns differed as well, as shown in Fig. 1. In the present study, the difference between SD of the hourly estimated CH4 level on both farms was 4 g/d. Therefore, the adjustment for the diurnal variation had to be performed separately, at the farm level. The importance of adjusting the data for the time of day at which the measurement was taken is especially important when an AMS is used. It is possible that cows have individual preferences for the time of milking. Therefore, the evaluation of a cow that would be milked only at the time of the day with a high (or low) CH4 level may be biased if the diurnal variation is not accounted for, and all the daily measurements are simply averaged.
Daily estimated CH4 emission levels fluctuated over the measuring period, as shown in Fig. 2. Higher values were observed in warmer periods than in the colder ones. This seasonal variation, however, has to be interpreted with caution, because herd management changes over the year. In the summer months, cooling fans were used at high temperatures and wind blinds were open, causing an increased air flow in the barn. In contrast, in winter, the airflow in the barn was limited. This may have had some impact on the measurements of methane concentrations. Additionally, some seasonal changes in the diet may have an additional impact on CH4 emission levels.
Figure 2.
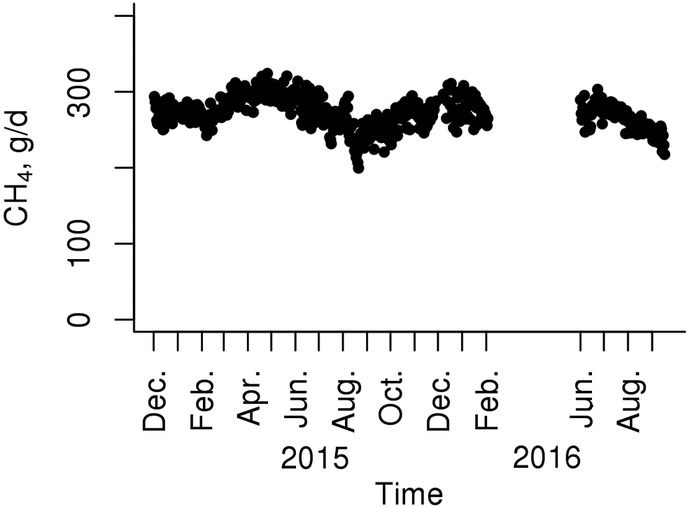
Average estimated daily CH4 emissions over the measuring period (based on Farm 1).
Lactation Pattern
The pattern of daily estimated CH4 emission levels over the course of lactation differed between the first lactation and the other lactations grouped together (see Fig. 3). At the beginning of the first lactation, the CH4 emission level was lower and then rapidly increased at around 20 DIM to rise further, this time steadily, for the remaining part of the lactation. In lactation 2+, the initial estimated CH4 emission level was higher, with a steady decrease during the later stages of lactation. The phenotypic lactation pattern shown here somewhat differs from that presented by Lassen and Løvendahl (2016), which had a shape typical of a lactation curve. In the present study, the phenotypic lactation pattern was based on fewer animals and a smaller number of farms than in the study by Lassen and Løvendahl (2016), which may partly explain the differences. A high variation of the estimated CH4 shown in the present study at the beginning of lactation may be partly attributed to the limited number of observations during that period, especially from the first days of the lactation.
Figure 3.
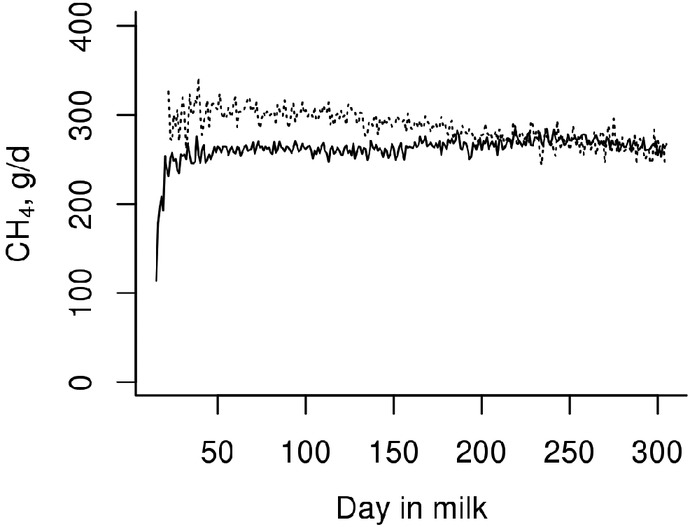
Estimated CH4 emission over the course of lactation 1 (solid line) and lactation 2+ (dashed line) based on observations from Farm 1.
Variance Components
Genetic, permanent environment, and residual variances over the course of lactation, estimated using model [2], are presented in Fig. 4. Genetic variance fluctuated over the course of lactation around the average level of 1,509 (g/d)2, with the highest level, 1,866 (g/d)2, at the end of the lactation. The permanent environment variance values started at 2,865 (g/d)2 and then dropped to around 846 (g/d)2 at 100 DIM to reach the level of 2,444 (g/d)2 at the end of lactation. The residual variance was estimated at 2,620 (g/d)2
Figure 4.
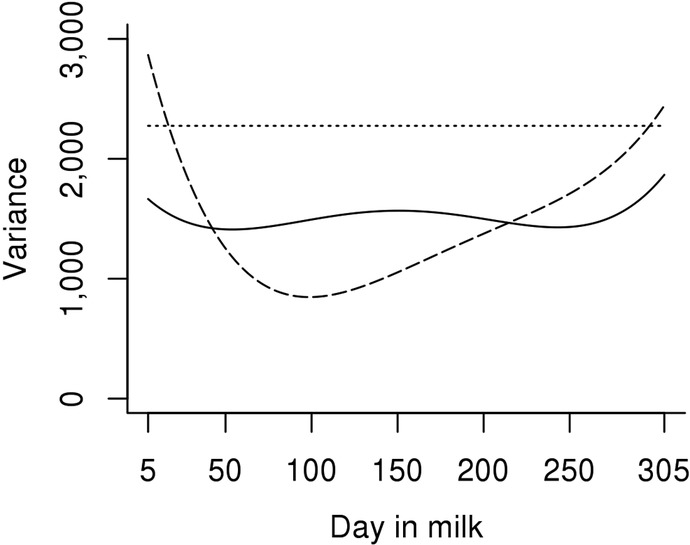
Genetic (solid line), permanent environment (dashed line), and residual (dotted line) variances [(g/d)2] over the course of lactation.
There is a limited number of studies reporting variance components and heritability estimates for direct measurements of CH4 emissions, and to our knowledge, there is no study applying a random regression model to estimate heritability levels at particular DIM (except for studies based on fatty acid composition–based prediction [Vanrobays et al., 2016] or simulation studies [Yin et al., 2015]). A low number of such publications is mainly caused by the fact that it is expensive to obtain a high number of observations from long periods of time, whereas most studies focus on short periods to maximize the number of phenotyped animals. In our study, our aim was to estimate variance components over the course of lactation and genetic relationships between particular DIM. This came at the cost of the number of phenotyped animals. Nonetheless, the present results show that the estimated CH4 emissions may have a different genetic background at different lactation stages. At the beginning of lactation, genetic variance was much higher than at its end. Consecutive DIM that are close to each other in time were highly genetically correlated, whereas correlations between more distant DIM were low. Therefore, we hypothesize that it is important not only to focus on the number of phenotyped animals but also to ensure that individual farms are periodically revisited to collect phenotypes on the same cows at different time points of their lactations. A higher genetic variation at the beginning of lactation observed in this study may suggest that more emphasis should put on the first period of lactation. Random regression models not only provide better modeling of changes in variance components over a full lactation but also produce means for better modeling of individual lactation curves for animals (Jamrozik et al., 1997). This is important, particularly in the light of low genetic correlations between estimated CH4 at different stages of lactation. Ignoring this source of variation and estimation of breeding values based only on selected short time points may be a source of inaccuracy and reduce the value of this trait in selection programs.
The repeatability followed the trend of the permanent environment variance (see Fig. 5), starting at the level of 0.40 at the beginning of the lactation and then dropping to 0.17 in 100 DIM and steadily increasing afterward, reaching 0.35. The average repeatability was 0.25. The repeatability levels reported in the present study are in range of previously reported values (Garnsworthy et al., 2012b; Lassen et al., 2012; Lassen and Løvendahl, 2016; Negussie et al., 2016)
Figure 5.
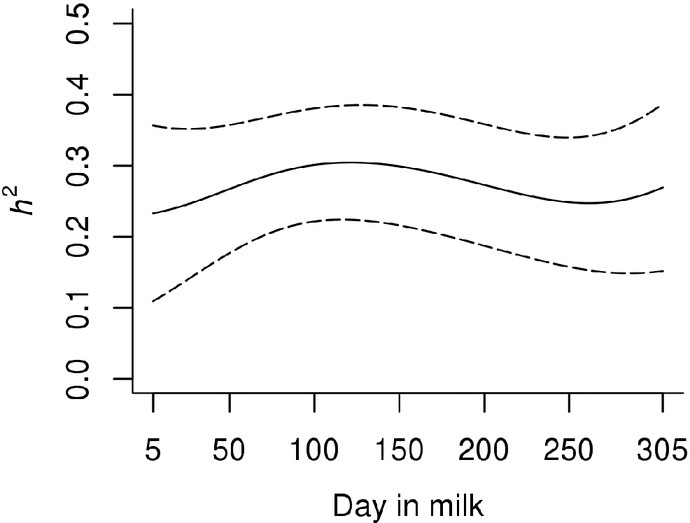
Heritability of estimated CH4 emission over the course of lactation (solid line) with SE (dashed lines).
The heritability level fluctuated over the course of lactation (see Fig. 6), starting at 0.23 (SE 0.12), then increasing to its maximum value of 0.3 (SE 0.08) at 212 DIM, and ending at the level of 0.27 (SE 0.12). The observed fluctuations should be considered with caution, because the changes of the heritability are within the SE of the estimates. Therefore, more data should be collected to confirm these findings. Average heritability was 0.27 (average SE 0.09). The heritability obtained from a simplified model, which included only simple random effects of the animal and permanent environment (i.e., without modeling of the individual lactation curves for random effects), gave a similar estimate of the heritability (0.26 [SE 0.06]). The average heritability presented in this study is similar to the value of 0.21 presented by Lassen and Løvendahl (2016), who analyzed a similar phenotype (CH4 in g/d). Heritability of other phenotypes reported by Lassen and Løvendahl (2013, 2016) ranged from 0.16 to 0.21. Heritability estimates for CH4 emissions predicted from milk fat composition and based on feed intake and maintenance ranged from 0.12 to 0.44 (de Haas et al., 2011; van Engelen et al., 2015; Yin et al., 2015).
Figure 6.
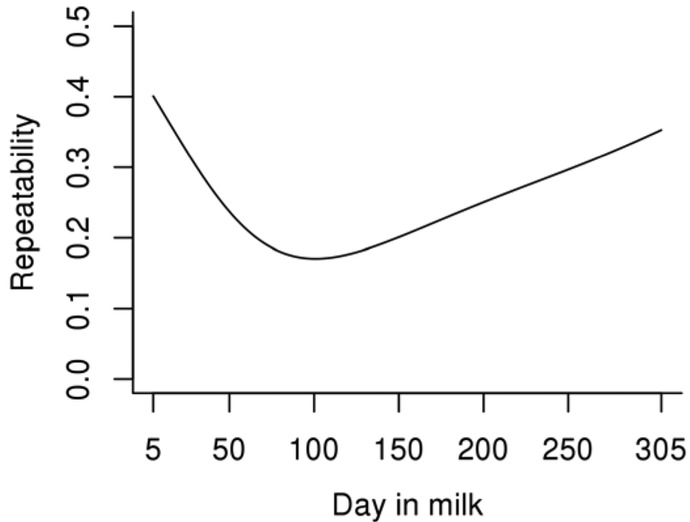
Repeatability of estimated CH4 emission over the course of lactation.
Genetic correlations between particular DIM, as shown in Fig. 7, indicated high similarity between the neighboring DIM (i.e., correlation of 1), which decreased when the distance between DIM increased, reaching 0 at the greatest distances. The average genetic correlation was 0.74. Phenotypic correlations (not shown) were much lower that the genetic ones and averaged 0.39
Figure 7.
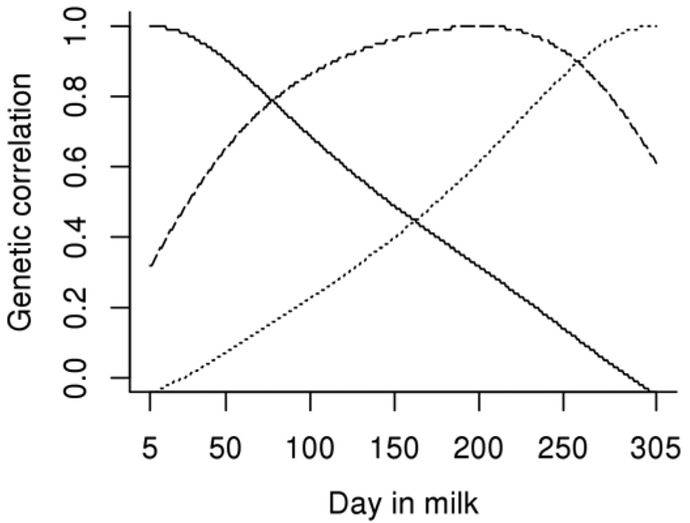
Genetic correlations between CH4 emissions on 5 (solid line), 200 (dashed line), and 305 d in milk (DIM; dotted line) and CH4 emissions on the remaining DIM of lactation.
Conclusion
In this study, we analyzed methane measurements obtained during milking in an AMS with the use of an FTIR analyzer. We have shown that estimated daily CH4 emissions are a heritable trait (0.27 [SE 0.09]) and that the heritability level changes over the course of lactation, ranging from 0.23 (SE 0.12) to 0.30 (SE 0.08). The observed changes and low genetic correlations between distant DIM suggest that it may be important to consider the period in which methane phenotypes are collected.
LITERATURE CITED
- Bates D., Maechler M., Bolker B., Walker S. 2015. Fitting Linear Mixed-Effects Models Using lme4. J. Stat. Softw. 67(1):1–48. doi: 10.18637/jss.v067.i01 [DOI] [Google Scholar]
- Bell M. J., Saunders N., Wilcox R. H., Homer E. M., Goodman J. R., Craigon J., Garnsworthy P. C. 2014. Methane emissions among individual dairy cows during milking quantified by eructation peaks or ratio with carbon dioxide. J. Dairy Sci. 97:6536–6546. doi: 10.3168/jds.2013-7889 [DOI] [PubMed] [Google Scholar]
- Chagunda M. G. G., Ross D., Roberts D. J. 2009. On the use of a laser methane detector in dairy cows. Comput. Electron. Agric. 68:157–160. doi: 10.1016/j.compag.2009.05.008 [DOI] [Google Scholar]
- de Haas Y., Windig J. J., Calus M. P. L., Dijkstra J., de Haan M., Bannink A., Veerkamp R. F. 2011. Genetic parameters for predicted methane production and potential for reducing enteric emissions through genomic selection. J. Dairy Sci. 94:6122–6134. doi: 10.3168/jds.2011-4439 [DOI] [PubMed] [Google Scholar]
- Garnsworthy P. C., Craigon J., Hernandez-Medrano J. H., Saunders N. 2012a. On-farm methane measurements during milking correlate with total methane production by individual dairy cows. J. Dairy Sci. 95:3166–3180. doi: 10.3168/jds.2011-4605 [DOI] [PubMed] [Google Scholar]
- Garnsworthy P. C., Craigon J., Hernandez-Medrano J. H., Saunders N. 2012b. Variation among individual dairy cows in methane measurements made on farm during milking. J. Dairy Sci. 95:3181–3189. doi: 10.3168/jds.2011-4606 [DOI] [PubMed] [Google Scholar]
- Gilmour A., Gogel B., Cullis B., Welham S., Thompson R., Butler D., Cherry M., Collins D., Dutkowski G., Harding S. 2014. ASReml user guide. Release 4.1 structural specification. VSN International Ltd, Hemel Hempstead, UK. [Google Scholar]
- Grainger C., Clarke T., McGinn S. M., Auldist M. J., Beauchemin K. A., Hannah M. C., Waghorn G. C., Clark H., Eckard R. J. 2007. Methane emissions from dairy cows measured using the sulfur hexafluoride (SF6) tracer and chamber techniques. J. Dairy Sci. 90:2755–2766. doi: 10.3168/jds.2006-697 [DOI] [PubMed] [Google Scholar]
- Jamrozik J., Schaeffer L. R., Dekkers J. C. M. 1997. Genetic evaluation of dairy cattle using test day yields and random regression model. J. Dairy Sci. 80:1217–1226. doi: 10.3168/jds.S0022-0302(97)76050-8 [DOI] [PubMed] [Google Scholar]
- Johnson D. E., Hill T. M., Ward G. M., Johnson K. A., Branine M. E., Carmean B. R., Lodman D. W. 1993. Ruminants and other animals. In: Khalil M. A. K. editor, Atmospheric methane: Sources, sinks, and role in global change. Vol. 13. Springer, Berlin Heidelberg, Germany: p. 199–229. doi: 10.1007/978-3-642-84605-2_11 [DOI] [Google Scholar]
- Kirkpatrick M., Lofsvold D., Bulmer M. 1990. Analysis of the inheritance, selection and evolution of growth trajectories. Genetics 124:979–993. [DOI] [PMC free article] [PubMed] [Google Scholar]
- Lassen J., Løvendahl P. 2013. Heritability for enteric methane emission from Danish Holstein cows using a non-invasive FTIR method. Adv. Anim. Biosci. 4:280. [Google Scholar]
- Lassen J., Løvendahl P. 2016. Heritability estimates for enteric methane emissions from Holstein cattle measured using noninvasive methods. J. Dairy Sci. 99:1959–1967. doi: 10.3168/jds.2015-10012 [DOI] [PubMed] [Google Scholar]
- Lassen J., Løvendahl P., Madsen J. 2012. Accuracy of noninvasive breath methane measurements using Fourier transform infrared methods on individual cows. J. Dairy Sci. 95:890–898. doi: 10.3168/jds.2011-4544 [DOI] [PubMed] [Google Scholar]
- Leip A., Weiss F., Wassenaar T., Perez I., Fellmann T., Loudjani P., Tubiello F., Grandgirard D., Monni S., Biala K. 2010. Evaluation of the livestock sector's contribution to the EU greenhouse gas emissions (GGELS) – Final report. http://ec.europa.eu/agriculture/analysis/external/livestock-gas/full_text_en.pdf. (Accessed 1 April 2017.)
- Løvendahl P., Bjerring M. A. 2006. Detection of carryover in automated milk sampling equipment. J. Dairy Sci. 89:3645–3652. doi: 10.3168/jds.S0022-0302(06)72404-3 [DOI] [PubMed] [Google Scholar]
- Madsen J., Bjerg B. S., Hvelplund T., Weisbjerg M. R., Lund P. 2010. Methane and carbon dioxide ratio in excreted air for quantification of the methane production from ruminants. Livest. Sci. 129:223–227. doi: 10.1016/j.livsci.2010.01.001 [DOI] [Google Scholar]
- Murray R. M., Bryant A. M., Leng R. A. 1976. Rates of production of methane in rumen and large-intestine of sheep. Br. J. Nutr. 36:1–14. doi: 10.1079/BJN19760053 [DOI] [PubMed] [Google Scholar]
- Negussie E., Lehtinen J., Mäntysaari P., Bayat A. R., Liinamo A. E., Mäntysaari E. A., Lidauer M. H. 2016. Non-invasive individual methane measurement in dairy cows. Animal 11:890–899. doi: 10.1017/S1751731116002718 [DOI] [PubMed] [Google Scholar]
- Pedersen S., Blanes-Vidal V., Joergensen H., Chwalibog A., Haeussermann A., Heetkamp M. J. W., Aarnink A. J. A. 2008. Carbon dioxide production in animal houses: A literature review. Agric. Eng. Int. 10:BC 08 008. [Google Scholar]
- R Development Core Team 2013. R: A language and environment for statistical computing. The R Foundation for Statistical Computing, Vienna, Austria. [Google Scholar]
- Steinfeld H., Gerber P., Wassenaar T., Castel V., Rosales M., de Haan C. 2006. Livestock's long shadow: Environmental issues and options. Food and Agriculture Organization of the United Nations, Rome, Italy. [Google Scholar]
- Strabel T., Jamrozik J. 2006. Genetic analysis of milk production traits of polish black and white cattle using large-scale random regression test-day models. J. Dairy Sci. 89:3152–3163. doi: 10.3168/jds.S0022-0302(06)72589-9 [DOI] [PubMed] [Google Scholar]
- van Engelen S., Bovenhuis H., Dijkstra J., van Arendonk J., Visker M. 2015. Short communication: Genetic study of methane production predicted from milk fat composition in dairy cows. J. Dairy Sci. 98:8223–8226. doi: 10.3168/jds.2014-8989 [DOI] [PubMed] [Google Scholar]
- Vanrobays M. L., Bastin C., Vandenplas J., Hammami H., Soyeurt H., Vanlierde A., Dehareng F., Froidmont E., Gengler N. 2016. Changes throughout lactation in phenotypic and genetic correlations between methane emissions and milk fatty acid contents predicted from milk mid-infrared spectra. J. Dairy Sci. 99:7247–7260. doi: 10.3168/jds.2015-10646 [DOI] [PubMed] [Google Scholar]
- Yin T., Pinent T., Brügemann K., Simianer H., König S. 2015. Simulation, prediction, and genetic analyses of daily methane emissions in dairy cattle. J. Dairy Sci. 98:5748–5762. doi: 10.3168/jds.2014-8618 [DOI] [PubMed] [Google Scholar]


