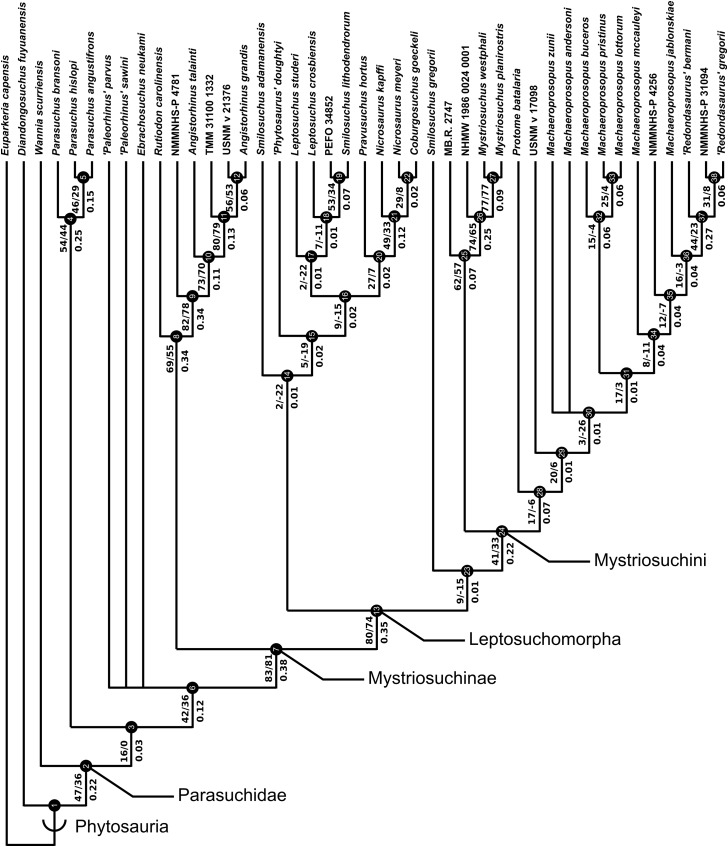
Figure 4. Strict consensus of the three trees resulting from the analysis treatment incorporating discrete characters only (D).
Node numbers are labelled within black circles. Absolute frequencies/frequency differences are presented to the left of the node’s stem; Bremer support values are reported to the right of the node’s stem.

