

Abstract
Autism spectrum disorder (ASD) is characterized neurophysiologically by, among other things, functional connectivity abnormalities in the brain. Recent evidence suggests that the nature of these functional connectivity abnormalities might not be uniform throughout maturation. Comparing between adolescents and young adults (ages 14–21) with ASD and age‐ and IQ‐matched typically developing (TD) individuals, we previously documented, using magnetoencephalography (MEG) data, that local functional connectivity in the fusiform face areas (FFA) and long‐range functional connectivity between FFA and three higher order cortical areas were all reduced in ASD. Given the findings on abnormal maturation trajectories in ASD, we tested whether these results extend to preadolescent children (ages 7–13). We found that both local and long‐range functional connectivity were in fact normal in this younger age group in ASD. Combining the two age groups, we found that local and long‐range functional connectivity measures were positively correlated with age in TD, but negatively correlated with age in ASD. Last, we showed that local functional connectivity was the primary feature in predicting age in ASD group, but not in the TD group. Furthermore, local functional connectivity was only correlated with ASD severity in the older group. These results suggest that the direction of maturation of functional connectivity for processing of faces from childhood to young adulthood is itself abnormal in ASD, and that during the processing of faces, these trajectory abnormalities are more pronounced for local functional connectivity measures than they are for long‐range functional connectivity measures.
Keywords: adolescence, ASD, coherence, development, face processing, MEG, phase amplitude coupling
1. INTRODUCTION
Autism spectrum disorder (ASD) is characterized by a broad range of perceptual and behavioral features including deficits in social communications and stereotyped behaviors (Charman & Baird, 2002; Nadel & Poss, 2007; Wetherby, Watt, Morgan, & Shumway, 2007). While the exact brain bases of ASD remain unknown, abnormal functional connectivity has been extensively documented in ASD across multiple brain regions and a wide range of paradigms, using many different techniques (Belmonte, et al., 2004; Just, Cherkassky, Keller, & Minshew, 2004; Kana, Libero, & Moore, 2011; Khan, et al., 2016, 2015; Mamashli, et al., 2017; Muller, et al., 2011; O'Reilly, Lewis, & Elsabbagh, 2017; Supekar, et al., 2013; Uddin, Supekar, & Menon, 2013). While functional connectivity studies in children and adolescents with ASD do not always consider age as a variable, recent evidence suggests that functional connectivity abnormalities in ASD may vary in magnitude and even in direction across development from childhood to adulthood (Alaerts, et al., 2015; Dajani & Uddin, 2015; Khan et al., 2015; Nomi & Uddin, 2015; Padmanabhan, Lynn, Foran, Luna, & O'Hearn, 2013). Understanding the differences in the developmental trajectories of functional connectivity between ASD and typically developing (TD) individuals is clearly an essential part of building a neurophysiological model of ASD. It is of particular interest to understand how these differences evolve over adolescence, which is likely a critical time not just in typical development, but also in ASD, where it may be a window of increased vulnerability (Di Martino, et al., 2014; Marin, 2016; Picci & Scherf, 2015; Ratto & Mesibov, 2015; Rosenthal, et al., 2013).
One of the domains where functional connectivity abnormalities in ASD have been extensively documented, is face processing. While most studies of face processing in ASD focus on cortical and subcortical activation or response (Dalton, et al., 2005; Hubl, et al., 2003; Pelphrey, Lopez, & Morris, 2009; Perlman, Hudac, Pegors, Minshew, & Pelphrey, 2011; Pierce & Courchesne, 2001; Schultz, et al., 2000), many other studies focused on functional connectivity abnormalities, and cover a wide age range, from childhood (Dominguez, Velazquez, & Galan, 2013; Lynn, et al., 2018) to adulthood (Kleinhans, et al., 2008; Koshino, et al., 2008; Leung, Ye, Wong, Taylor, & Doesburg, 2014). In parallel, in TD, we know that behavioral face processing abilities improve with age (Germine, Duchaine, & Nakayama, 2011; Golarai, Liberman, Yoon, & Spector, 2010; Lawrence, et al., 2008; Song, Zhu, Li, Wang, & Liu, 2015), and that the inter‐regional connectivity increase with age across multiple areas involved in face processing (Cohen Kadosh, Cohen Kadosh, Dick, & Johnson, 2011; Song et al., 2015; Zhou, Liu, Ding, Fu, & Lee, 2016). However, behavioral improvements over adolescence in paradigms such as face memory, lag in ASD (O'Hearn, Schroer, Minshew, & Luna, 2010, 2014).
Here, we sought to investigate whether the maturation trajectories of cortical functional connectivity elicited by a face perception paradigm differ in ASD relative to TD individuals. We have previously shown, using magnetoencephalography (MEG), that ASD adolescents and young adults (ages 14–21) are characterized by abnormally reduced local and long‐range cortical functional connectivity in response to faces within the fusiform face area (FFA), and between the FFA and three other cortical regions. Locally, within the FFA, we found that alpha‐gamma phase‐amplitude coupling (PAC), the coupling between the phase of the alpha rhythm (7–13 Hz) and the amplitude of the gamma rhythm (low gamma, 45–60 Hz, and high gamma, 80–120 Hz), was abnormally reduced in ASD, and that the magnitude of this reduction correlated with ASD severity. In parallel, we found that long‐range functional connectivity was reduced between the FFA and the precuneus, the anterior cingulate cortex (ACC), and the inferior frontal gyrus (IFG), all in the alpha frequency band. The combination of local and long‐range functional connectivity measures was predictive of diagnosis.
To study the maturation trajectories of these measures in TD versus ASD populations, we extended the prior study to younger ages, 7–13, and assessed the same metrics, PAC in the FFA and functional connectivity between the FFA and the precuneous, IFG, and ACC, in the full cohort of 7–21‐year‐old ASD and TD participants, again using MEG. We hypothesized that the maturation trajectory of these functional connectivity measures in the ASD group will be abnormal relative to the TD group.
2. MATERIALS AND METHODS
2.1. Participants
Participants consisted of two groups. The first group were the seventeen subjects with ASD and twenty TD adolescents and young adults, ages 14–21, described in our prior publication (Khan et al., 2013). The second group consisted of 37 newly recruited participants (21 TD, 16 ASD) ages 7–13, and 11 newly recruited participants, ages 14–17 (7 TD, 4 ASD). Subjects with ASD had a prior clinical diagnosis of ASD and met a cutoff of >15 on the Social Communication Questionnaire, Lifetime Version, and ASD criteria on the Autism Diagnostic Observation Schedule (ADOS) (Lord, 1999), administered by trained research personnel who had established inter‐rater reliability. Individuals with autism related medical conditions (e.g., Fragile‐X syndrome, tuberous sclerosis) and other known risk factors (e.g., premature birth) were excluded from the study. All TD participants were below threshold on the Social Communication Questionnaire and were confirmed to be free of any neurological or psychiatric conditions, and of substance use for the past 6 month, via parent and self‐reports. The ASD and TD groups did not differ in verbal and nonverbal IQ, measured with the Kaufman Brief Intelligence Test – II (Kaufman & Kaufman, 2004). Handedness information was collected using Dean Questionnaire (Piro, 1998). Only right‐handed participants were included in the study. All research was in compliance with the MGH institutional review board, and all participants were consented in accordance with the approved protocol. Detailed data on all participants is in Table 1.
Table 1.
Behavioral scores and demographic information for TDs and ASDs
| Age, mean | Verbal IQ, mean | Nonverbal IQ, mean | ADOS (social), mean | |
|---|---|---|---|---|
| TD (n = 48) | 14 | 114 14 | 110 | 0.5 |
| ASD (n = 37) | 14.5 | 109 | 108 | 7.4 |
2.2. Experimental paradigms
The paradigm presented in the MEG room consisted of houses, neutral, fearful, and angry faces. Each stimulus was displayed for 1 s, separated by 1 s of fixation cross baseline (fixation on a cross at the center of the screen). The paradigm was presented in three consecutive runs. To ensure attention, participants were asked to press a button when the same face appeared twice in succession. This was a rare (1/8) occurrence, and all participants performed at ceiling level on the task. We were not concerned about motor‐preparation artifacts from trials involving a button press, because our analysis was always time‐locked to stimulus onset. Therefore, the non‐time‐locked effects from the 16% of trials associated with a motor response would average out to a level no greater than the noise inherent in the data. The face stimuli were collected from three databases: Karolinska Directed Emotional Faces (KDEF) (Lundqvist, Flykt, & Öhman, 1998), NimStim Face Stimulus Set, and Gur (Gur, et al., 2002). The houses stimuli were obtained from the Kanwisher Laboratory database at the Massachusetts Institute of Technology. All stimuli were homogenized for brightness and contrast, and by using an oval black mask. The sequence of stimuli was generated and presented using the psychophysics toolbox (Brainard, 1997; Pelli, 1997), and presented with a projector through an opening in the wall onto a back‐projection screen placed 100 cm in front of the participant inside a magnetically shielded room. There were minor variations in the paradigm design between the prior and current set of participants. In the previously published study (Khan et al., 2013), eight stimuli of the same condition were presented consecutively. In newly recruited cohort, stimuli were presented randomly rather than using a block design. Because the data was analyzed on a trial by trial basis, these design differences are not expected to have impacted the results. To further ensure this, we (a) compared the results in the newly recruited participants ages 14–17, with the prior results, and found no significant difference, and (b) we reanalyzed all of the prior data using the same approach used for the newer design, that is, trial by trial (see below), and got the same results. Lastly, we compared evoked responses on a trial by trial basis, and saw no differences in evoked responses and power when the numbers of trials are controlled across the groups.
2.3. Structural MRI data acquisition and processing
T1‐weighted, high‐resolution, magnetization‐prepared rapid acquisition gradient‐echo (MPRAGE) structural images were acquired on a 3.0 T Siemens Trio whole‐body MRI scanner (Siemens Medical Systems, Erlangen, Germany) using a 32 channel head coil. The in‐plane resolution was 1 × 1 mm2, slice thickness 1.3 mm with no gaps, and a repetition time/inversion time/echo time/flip angle 2,530 ms/1,100 ms/3.39 ms/7°. Cortical reconstruction and parcellations for each subject were generated using Freesurfer (Dale, Fischl, & Sereno, 1999; Fischl, Sereno, & Dale, 1999a). After correcting for topological defects, cortical surfaces were triangulated with dense meshes with ∼130,000 vertices in each hemisphere. For visualization, the surfaces were inflated, thereby exposing the sulci (Dale et al., 1999).
2.4. MEG data acquisition
MEG data were acquired inside a magnetically shielded room (IMEDCO) using a whole‐head VectorView MEG system (Elekta‐Neuromag), comprised of 306 sensors arranged in 102 triplets of two orthogonal planar gradiometers and one magnetometer. The signals were filtered between 0.1 and 200 Hz and sampled at 600 Hz. The position and orientation of the head with respect to the MEG sensor array was recorded continuously with help of four head position indicator (Zaidel, Spivak, Shpigelman, Bergman, & Israel, 2009) coils (Uutela, Taulu, & Hämäläinen, 2001). To allow co‐registration of the MEG and MRI data, the locations of three fiduciary points (nasion and auricular points) that define a head‐based coordinate system, a set of points from the head surface, and the sites of the four head position indicator coils were digitized using a Fastrak digitizer (Polhemus) integrated with the Vectorview system. The electrocardiography (ECG) and electrooculography (EOG) signals were recorded simultaneously to detect heartbeats as well as vertical and horizontal eye movement and blink artifacts, which were later used to identify cardiac and ocular events in signal space projection method. During data acquisition, online averages were computed from artifact‐free trials to monitor data quality in real time. All offline analysis was based on the saved raw data. In addition, 5 min of data from the room void of a subject were recorded before each experimental session for noise estimation purposes.
2.5. MEG data preprocessing and motion correction
MEG data were spatially filtered using the signal space separation method (Elekta‐Neuromag Maxfilter software) to suppress noise generated by sources outside the brain (Taulu, Kajola, & Simola, 2004; Taulu & Simola, 2006). Signal space separation also corrects for head motion between and within runs (Taulu et al., 2004). Cardiac and ocular artifacts were removed by signal space projection (Gramfort, et al., 2014). The data were filtered between 0.1 and 140 Hz. The data were epoched into single trials lasting 1,600 ms, from 400 ms prior to stimulus onset to 1,200 ms after it. Epochs were rejected if the peak‐to‐peak amplitude during the epoch exceeded 1,000 fT/cm and 3,000 fT in any of the gradiometer and magnetometer channels, respectively. For evoked‐response analysis, we filtered the data from 0.5 to 10 Hz and epoched into single trials from −200 ms prior to stimulus onset to 500 ms after it. In this article, we focused on the data of houses and emotional faces, which combines fearful faces and angry faces data. This was motivated by our findings from Khan et al. (2013) as the main difference between TD and ASD group emerged between those two conditions.
2.6. Source estimation
The geometry of each participant's cortical surface was reconstructed from the 3D structural MRI data using FreeSurfer software (http://surfer.nmr.mgh.harvard.edu). The cortical surface was decimated to a grid of 10,242 dipoles per hemisphere, corresponding to a spacing of ∼5 mm between adjacent source locations on the cortical surface. The MEG forward solution was computed using a single‐compartment boundary‐element model (BEM) assuming the shape of the intracranial space (Hämäläinen & Sarvas, 1987). The watershed algorithm was used to generate the inner skull surface triangulations from the T1‐weighted MR images of each participant. Assuming head movements occurred only between runs and to compensate for these movements, the forward solutions for each run were computed and averaged (Uutela et al., 2001). The cortical current distribution was estimated using minimum‐norm estimate (MNE) software (http://www.martinos.org/martinos/userInfo/data/sofMNE.php) and assuming the orientation of the source to be fixed perpendicular to the cortical mesh. The noise–covariance matrix used to calculate the inverse operator was estimated from data collected without a subject present. To reduce the bias of the MNEs toward superficial currents, we used depth weighting, that is, adjusted the source covariance matrix to favor deep source locations (Lin, Belliveau, Dale, & Hämäläinen, 2006).
2.7. Intersubject cortical surface registration for group analysis
Each participant's inflated cortical surface was registered to an average cortical representation (FsAverage in FreeSurfer) by optimally aligning individual sulcal‐gyral patterns computed in freesurfer (Fischl et al., 1999a). We employed a surface based registration technique based on folding patterns because it provides more accurate intersubject alignment of cortical regions than volume‐based approaches (Fischl, Sereno, Tootell, & Dale, 1999b; Van Essen & Dierker, 2007).
2.8. Delineating the FFA
To delineate the right FFA, fusiform gyrus was first identified in each participant using the individual FreeSurfer anatomical parcellation. We will use the term FFA rather than right FFA for simplicity. We used a vertex‐by‐vertex statistical analysis of the evoked response to emotional faces versus the response to evoked houses. The FFA is defined as the region in the fusiform gyrus that responds more strongly to faces than to houses (Kanwisher, McDermott, & Chun, 1997). Accordingly, we mapped the single epochs to fusiform gyrus for each subject using the inverse operator. For each subject, the evoked response for emotional faces was tested against the evoked response to houses, using a paired t test (df = 49) across epochs. FFA boundaries were then manually delineated based on the maximum t values in the fusiform gyrus for each subject with a 50 ms window on each side of the peak.
2.9. FFA evoked response magnitude and latency
Latency and peak of the M170 response to faces (Botzel & Grusser, 1989; Ghuman, et al., 2014; Jeffreys, 1989) were noted manually for each individual, for all subjects and conditions.
2.10. FFA PAC analysis
To compute PAC, artifact free data that was filtered between 0.1 and 144 Hz was mapped to FFA using inverse operator for each participant (both newer and older cohorts). This process results in 2D matrix, which are vertices by time. This would allow us to filter the data on the continuous time series rather than on epoch data. PAC between the alpha band (7–13 Hz) phase and gamma band (40–130 HZ) amplitude was quantified for each vertex in the FFA, for each participant, using the modulation index (MI), which is a statistical score representing the degree of coupling between two time series, one of phase and the other of amplitude (Canolty, et al., 2006). We estimated the phase of frequencies between 7 and 13 Hz (in steps of 1 Hz; termed “phase frequencies”) and amplitudes of frequencies between 40 and 130 Hz (in steps of 10 Hz; termed “amplitude frequencies”) for each vertex of FFA. The instantaneous phase of the slow frequencies and the amplitude of the fast frequencies were extracted using Hilbert transformation. To eliminate edge artifacts caused by filtering and applying the Hilbert transformation, filtering applied on the whole time series for each vertex first. Then epochs extracted from the filtered data. For each of the stimulus conditions, each epoch lasted from 0 ms (stimulus onset) to 1,000 ms after stimulus onset. All epochs in each condition were then concatenated into one vector per vertex. Using this procedure, we prevented spurious PAC due to sharp edges in the data (Kramer, Tort, & Kopell, 2008). Angry faces and fearful faces were merged as emotional faces. As described by Canolty et al. (2006), at each vertex, the MI for that pair of frequencies was computed which corresponds to a z‐score. Note that this approach has been updated to the latest best available methods, relative to our older, published data, which used a different approach. The results obtained when using the updated PAC computation approach, replicated the results of our prior study.
2.11. Time series extraction for coherence and time–frequency analysis
Within each regions of interest (ROI), we avoid signal cancellation by taking into account the polarity mismatches that occur because of MNE estimate spreading across sources whose orientations were not aligned. This was done by flipping the polarity of the signals from sources that were oriented at >90° relative to a principal direction of the cortical normals within each ROI. This process results in 2D matrix which are epochs by time.
2.12. FFA coherence analysis
We computed the coherence between the FFA and three ROIs: left IFG, left ACC, and left precuneus. ROI selection was motivated by our previous publication (Khan et al., 2013), demonstrating significant normalized coherence between TD and ASD in the alpha frequency band (8–12 Hz) between the FFA and those ROIs, using cluster permutation statistics (Khan et al., 2013). ROIs delineation was carried out using FreeSurfer parcallations and cluster permutations statistics, similarly to our prior study. The locations of the ROIs are shown in Supporting Information, Figure S1. Time–frequency decomposition was done in the FFA and in each ROI. The 2D epoched time series within ROIs was convolved with a dictionary of complex Morlet wavelets (each spanning seven cycles), resulting in 3 dimensional complex spectra epoch–time–frequency matrix ( ). The Coherence between FFA and each ROI was computed for alpha frequencies between 8 and 12 Hz. We eliminated the statistical bias due to the non‐Gaussian distribution of coherence values and unequal sample sizes, as well as the problem of spurious coherence (Sekihara, Owen, Trisno, & Nagarajan, 2011), by using normalized coherence, also referred to sometimes as Z‐coherence (Maris, Oostenveld, & Fries, 2007). In this measure, the principal condition (emotional faces, a total of 80 trials per participant) is normalized with respect to a baseline condition (houses, a total of 40 trials per participant), which addresses the bias (Khan et al., 2013; Mamashli et al., 2017).
2.13. FFA power
Power was estimated from −400 to 1,200 ms and from 7 to 120 Hz in time and frequency, respectively.
2.14. FFA delineation overlaps across all subjects
To estimate the overlap of the FFA localization across all subjects, each individual FFA was morphed to the average cortical representation (FsAverage in FreeSurfer). A probability map of FFA was gained by averaging across all subjects.
2.15. Statistical analysis of evoked responses in the FFA
We used a three‐way analysis of variance (ANOVA); 2 (group: TD‐ASD) × 2 (age: children–adolescence) × 2 (condition: faces–houses) to examine differences in peak amplitude and latency of the evoked responses. Peak amplitude comparisons were done once using the peak at actual latency, and once using magnitudes at fixed latency (160–180 ms).
2.16. Evoked response correlation with age
The M170 latency in response to emotional faces, and the normalized M170 peak (emotional faces minus houses) were tested for correlation with age using Pearson's correlation.
2.17. PAC statistical analysis
To compare the PAC values across TD and ASD group, we only considered significant PAC values (p < 0.01) across vertices and each frequency pairs. PAC values then averaged across alpha range for each condition separately. PAC values of houses were then subtracted from emotional faces within TD and ASD. Threshold free cluster statistics used to correct for multiple comparisons and compare the PAC between TD and ASD group. This analysis was done for children and adolescents group separately.
2.18. PAC correlation with age
Correlation analysis was focused on those gamma ranges that demonstrated a significant difference between TD and ASD groups. Mean PAC values within low or high gamma for houses were subtracted from emotional faces. Relative PAC values for all subjects were then correlated with the age using Pearson method for each group. Statistical significance of the correlations between groups (TD vs ASD) was estimated using Fisher r‐to‐z transformation (Fisher, 1915).
2.19. Z‐coherence correlation with age
Following our previous approach (Khan et al., 2013), time intervals found to be significant between TD and ASD were considered. Z‐Coherence in precuneus around 150 ms, IFG around 260 ms, and in ACC around 320 ms were used for each subject and then correlated with age using Pearson correlation. Statistical significance of the correlations between groups was estimated using Fisher r‐to‐z transformation (Fisher, 1915). Bonferroni correction was applied to correct for multiple comparisons by a factor of three as we conduct three between‐group effects test.
2.20. Predicting age using multivariate linear regression model
We tested whether PAC and Z‐coherences from three ROIs can be used to predict age in TD and ASD. We used multivariate linear regression model with 10‐fold cross‐validation method. To assess the performance of the model, coefficients of the models across 10‐fold were first averaged and then the predicted age was correlated with actual age using Pearson method. Feature importance was extracted using the decision tree method. Standard deviation was estimated across 250 trees.
2.21. Coherence and ADOS correlation
PAC and Z‐coherences were each correlated with the ADOS social scores separately using Spearman method. To assess the developmental effect in this correlation, we grouped subjects by five years age windows: 10–15, 11–16, 12–17, …, 16–21 years old. The number of subjects was 13–15 in each age range. Using the Pearson correlation method, we evaluated ADOS and coherence correlations across development.
2.22. Statistical analysis of power
FFA power of emotional faces were compared with houses within each group using cluster‐based statistics that correct for multiple comparisons using a nonparametric method (Maris & Oostenveld, 2007). Statistics were focused in time from 0 to 1,000 ms and in frequency from 7 to 120 Hz selected on logarithmic scale. To compare between the TD and ASD group, power of houses were subtracted from emotional faces within each group and cluster‐based statistics used to compare between group effects. This analysis was done for children and adolescents separately. To check if the PAC results were impacted by power, we correlated age with the alpha (8–12 Hz), low gamma (45–60 Hz), and high gamma (80–120 Hz) amplitude computed within the time interval used for PAC analysis (0–1,000 ms), using Pearson correlations. In addition, we correlated the same amplitudes with PAC, again using the Pearson method, to verify that the PAC results were independent of power measures.
3. RESULTS
3.1. Evoked responses in the FFA
A probabilistic map of FFA localization across all subjects is shown in Figure 1a. There was a significant condition difference (F 1,153 = 5.4, p = .02) but no significant group (TD to ASD) or age (children to adolescence) differences in peak amplitude at fixed latency of evoked responses within the FFA (Figure 1b,c and Supporting Information, Figure S2). Post‐hoc analysis revealed significant a difference in the evoked responses to emotional faces versus evoked responses to houses in adolescence (ages 14–21) in both TD (p = .02) and ASD (p = .02), but there was no such difference in children (ages 7–13) in either group. There was also no significant group difference in evoked response latencies for any condition, or in the peak magnitude of the evoked response (at peak latency or at fixed latency).
Figure 1.

(a) Probability map of FFA location across all subjects. The contour map shows the localization overlap from 50% to 80% across subjects. (b) Averaged evoked responses of emotional faces and houses across all subjects of FFA in TD and ASD for (b) children (ages 7–13) and (c) adolescents (ages 14–21). The shaded area shows one standard error around the mean [Color figure can be viewed at http://wileyonlinelibrary.com]
3.2. Evoked responses and age correlation
Neither evoked response latency nor evoked response peak amplitude, in any condition, were significantly correlated with age, in either group (Supporting Information, Figure S3).
3.3. PAC of emotional faces versus houses
There were no significant group (TD to ASD) differences in PAC in the children's cohort (Figure 2a). In contrast, in adolescents, there were significant group differences between TD and ASD in PAC between the alpha phase and low gamma (45–60 Hz) and high gamma (80–120 Hz) amplitudes (Figure 2b).
Figure 2.
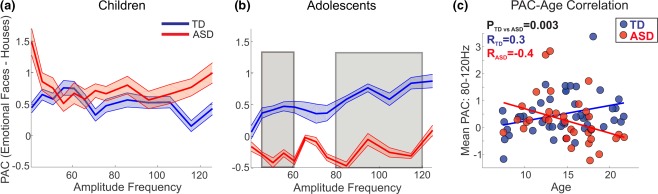
PAC of emotional faces relative to houses, compared between TD and ASD, for (a) children and (b) adolescents. (c) Correlation of age with the mean PAC from 80 to 120 Hz in TD and ASD. A linear model was fitted to each group's data [Color figure can be viewed at http://wileyonlinelibrary.com]
3.4. PAC and age correlation
The normalized (emotional faces to houses) alpha to low‐gamma PAC was not correlated with age in either group. In contrast, the normalized alpha to high‐gamma PAC was correlated with age in both the TD and ASD groups, but in opposite directions. In the TD group, age was positively correlated with normalized PAC (R pearson (n = 43) = 0.3, p = .04), while in the ASD group age was negatively correlated with normalized PAC (R pearson (n = 35) = −0.4, p = .03). There was a highly significant difference between the PAC trajectories for the TD and ASD groups (p = .003).
3.5. Normalized coherence correlation with age
Z‐coherence, the coherence during the viewing of emotional faces, normalized by coherence during viewing of house, was significantly correlated with age in the TD group, for all three ROIs. In ASD, FFA‐IFG Z‐coherence was significantly correlated with age. There was also a trend that did not meet significance for correlations between age and the FFA‐precuneus Z‐coherence and FFA‐ACC Z‐coherence. These results are summarized in Table 2. Group differences for the correlation between age and Z‐coherence (i.e., trajectories) were significant for all the tested ROIs (Figure 3): FFA–ACC: p TD vs ASD = 0.04 corrected, FFA‐IFG: p TD vs ASD = 0.01 corrected, FFA‐precuneus: p TD vs ASD = 0.03 corrected.
Table 2.
Z‐coherence correlation with age in TD and ASD groups
| FFA‐ACC (R Pearson; p) | FFA‐IFG (R Pearson; p) | FFA‐Precuneus (R Pearson; P) | |
|---|---|---|---|
| TD (n = 48) | 0.4; 007 | 0.3; 0.04 | 0.3; 0.06 |
| ASD (n = 37) | −0.3; 0.04 | −0.2; 0.2 | −0.2; 0.2 |
Figure 3.

Correlation between age and Z‐coherence (normalized coherence, faces relative to houses) between the FFA and (a) AAC, (b) IFG, and (c) precuneus. R and corrected p values are noted on each panel [Color figure can be viewed at http://wileyonlinelibrary.com]
3.6. Age prediction by PAC and Z‐coherences
The four measured functional connectivity metrics (PAC and three Z‐coherence values) predicted the age of participants using a multivariate linear regression model within each group (TD: R pearson (n = 43) = 0.6, p = .0001; ASD: R pearson (n = 35) = 0.6, p = .0001; Figure 4a). The most important feature in predicting age in the ASD group was PAC, whereas all the metrics had relatively equal contributions to the model in the TD group (Figure 4b).
Figure 4.
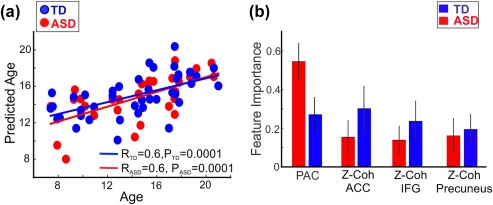
(a) Performance of multivariate linear regression model in TD and ASD. (b) Feature importance in TD and ASD. The error bar was computed using the standard deviation across 250 trees [Color figure can be viewed at http://wileyonlinelibrary.com]
3.7. Correlation between MEG metrics and ASD severity
As in our prior published study on the older group (Khan et al., 2013), there was no correlation between any of the long‐range coherence measures, and the severity of ASD as measured on the ADOS. Using only the older age group (14–21), PAC‐ADOS correlation results were in agreement with those of our prior study (Khan et al., 2013), showing a significant correlation between ASD severity as measured on the ADOS (social score), and normalized PAC (Figure 5a). In contrast, local functional connectivity in the FFA measured using PAC did not correlate with ASD severity in the younger age group. To test the effect of age more carefully, we correlated the PAC measure with ASD severity within the ASD group, using subsets of the group defined by a sliding 5‐year age window. Correlation between PAC and the ADOS social score became more significant as the age window increased from 10–15 to 16–21 years (R pearson (n = 7) = −0.98, p = .0001; Figure 5b,c).
Figure 5.
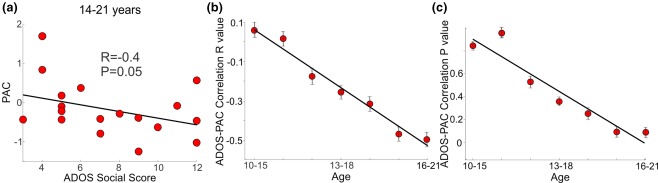
(a) ADOS‐PAC correlation for ASD participants ages 14–21. (b) ADOS–PAC correlation R value and (c) p value across development using sliding five year age windows. Standard error bars for panels b and c were computed using bootstrapping [Color figure can be viewed at http://wileyonlinelibrary.com]
3.8. Power
There were no significant group (TD vs ASD) or condition (houses vs emotional faces) differences in alpha, low gamma, or high gamma power. Furthermore, the normalized power (emotional faces condition relative to houses condition) was not correlated with age for any of the considered frequency bands (alpha, low gamma, and high gamma), for either group (TD or ASD; Supporting Information, Figure S4). Lastly, as expected, the normalized power (emotional faces relative to house) was not correlated with the normalized PAC (Supporting Information, Figure S5).
4. DISCUSSION
The goal of this study was to investigate the maturational trajectory of local and long‐range functional connectivity in ASD during face processing, using MEG. We found that, contrary to our prior study in an older age group (14–21), all the tested functional connectivity measures were normal in the younger ASD group (ages 7–13). Combining across the two age groups, we found that the tested local and long‐range functional connectivity measures were positively correlated with age in the TD group, but negatively correlated with age in the ASD group. A machine learning model revealed that local functional connectivity is the primary feature when predicting age in the ASD group, whereas all the tested features contributed roughly equally to age prediction in the TD group. Lastly, we found that the correlation between ASD severity as measured with ADOS and local functional connectivity increased with maturation.
Our results are consistent with a divergence from normal development of top–down functional connectivity in ASD. The method we used to measure local functional connectivity, phase–amplitude coupling (PAC), has been proposed as a mechanism for exchanging information between the slower global dynamics of cortical networks and faster local dynamics (Canolty & Knight, 2010; Fries, 2005, 2009; Lega, Burke, Jacobs, & Kahana, 2016). More specifically, the coupling of gamma power to alpha phase in visual processing has been suggested as a top–down controlled gating mechanism (Bonnefond & Jensen, 2015). In parallel, alpha oscillations are associated with top–down functional inhibition (Jensen & Mazaheri, 2010; Mathewson, Gratton, Fabiani, Beck, & Ro, 2009). In the context of this study of face processing, the ACC, IFG, and precuneus are all known to exert top–down effect on the FFA (Li, et al., 2009; Righart, Andersson, Schwartz, Mayer, & Vuilleumier, 2010). It is well known that top–down functional connectivity matures substantially during adolescence (Casey, Getz, & Galvan, 2008; Fornari, Rytsar, & Knyazeva, 2014; Goldenberg & Galvan, 2015; Khan, et al., 2018; Sole‐Padulles, et al., 2016). Given the combination of these studies, our results are consistent with the interpretation that top–down influences on the maturation of the FFA develop abnormally in ASD. This deviation from a typical developmental trajectory likely influences not just long‐range functional connectivity between the FFA and other regions in ASD, but also the development of local processing within the FFA, leading to reduced PAC. Lastly, impaired development of top–down mechanism in ASD is in line with previous reports suggestion abnormal top–down influences during face processing in ASD (Golarai, Grill‐Spector, & Reiss, 2006; Puce, Allison, & McCarthy, 1999).
Another parallel interpretation of the results stems from the mechanisms underlying PAC that involve parvalbumin‐expressing interneurons. Studies have consistently found underdeveloped parvalbumin‐expressing interneurons in ASD using mouse models of autism (Han, et al., 2012; Nakai, et al., 2014) and postmortem brains (Hashemi, Ariza, Rogers, Noctor, & Martinez‐Cerdeno, 2017). GABAergic interneurons have a protracted developmental period, from early embryonic stages all the way to adulthood, and in particular are known to undergo maturational changes during adolescence (Caballero & Tseng, 2016; Hoftman & Lewis, 2011). Abnormalities in the GABAergic circuitry during maturation can affect synaptic circuit and consequently abnormal cortical wiring (Le Magueresse & Monyer, 2013; Penzes, Buonanno, Passafaro, Sala, & Sweet, 2013). Failure of these mechanisms to develop normally during adolescence in ASD would likely contribute to the abnormal maturation trajectory results we observed here.
5. CONCLUSIONS
In summary, we investigated the maturational trajectory of local and long‐range functional connectivity in TD and ASD from age 7 to 21, during face processing. Alpha‐gamma PAC within the FFA, and alpha band normalized coherence (emotional faces vs houses) between the FFA and the IFG, ACC and precuneus were estimated from MEG data. We found that both local functional connectivity measured using PAC, and long‐range functional connectivity measures using band limited coherence, were positively correlated with age in the TD group, but negatively correlated with age in the ASD group. A machine learning model showed that PAC is the primary feature for predicting age in the ASD group. Considering the top–down influence of the IFG, ACC, and precuneus on the FFA during face processing, our results are consistent with the interpretation that top–down mediated maturation of functional connectivity is abnormal in ASD. In combination, our findings also provide additional support to the idea that adolescence is potentially a period of increased vulnerability in ASD relative to late childhood, susceptible to further developmental derailment of brain development (Di Martino et al., 2014; Marin, 2016; Picci & Scherf, 2015; Ratto & Mesibov, 2015; Rosenthal et al., 2013). These findings therefore underscore the need for additional studies on ASD therapies and treatments that would target specifically this second period of increased vulnerability, a period of time, which may occasionally be overlooked relative to younger ages in ASD.
Supporting information
Additional Supporting Information may be found online in the supporting information tab for this article.
Supporting Information
ACKNOWLEDGMENTS
This work was supported by grants from the Nancy Lurie Marks Family Foundation (TK, SK), Autism Speaks (TK), The Simons Foundation (SFARI 239395, TK), The National Institute of Child Health and Development (NICHD), National Institutes of Health (R01HD073254, TK), The National Institute of Biomedical Imaging and Bioengineering (NIBIB), National Institutes of Health (R01EB009048 & U01EB023820, MSH), and The National Science Foundation (NSF1042134, MSH). This research was carried out in part at the Athinoula A. Martinos Center for Biomedical Imaging at the Massachusetts General Hospital, using resources provided by the Center for Functional Neuroimaging Technologies, P41EB015896, a P41 Biotechnology Resource Grant supported by the National Institute of Biomedical Imaging and Bioengineering (NIBIB), National Institutes of Health. This work also involved the use of instrumentation supported by the NIH Shared Instrumentation Grant Program and/or High‐End Instrumentation Grant Program (S10RR014978). Article needs to be deposited in PMC.
Mamashli F, Khan S, Bharadwaj H, et al. Maturational trajectories of local and long‐range functional connectivity in autism during face processing. Hum Brain Mapp. 2018;39:4094–4104. 10.1002/hbm.24234
Funding information Nancy Lurie Marks Family Foundation; Autism Speaks; The Simons Foundation, Grant/Award Number: SFARI 239395; The National Institute of Child Health and Development, Grant/Award Number: R01HD073254; The National Centre for Research Resources, Grant/Award Number: P41EB015896; National Institute for Biomedical Imaging and Bioengineering, Grant/Award Number: 5R01EB009048; Cognitive Rhythms Collaborative: A Discovery Network, Grant/Award Number: NFS 1042134
REFERENCES
- Alaerts, K. , Nayar, K. , Kelly, C. , Raithel, J. , Milham, M. P. , & Di Martino, A. (2015). Age‐related changes in intrinsic function of the superior temporal sulcus in autism spectrum disorders. Social Cognitive and Affective Neuroscience, 10(10), 1413–1423. [DOI] [PMC free article] [PubMed] [Google Scholar]
- Belmonte, M. K. , Allen, G. , Beckel‐Mitchener, A. , Boulanger, L. M. , Carper, R. A. , & Webb, S. J. (2004). Autism and abnormal development of brain connectivity. Journal of Neuroscience, 24(42), 9228–9231. [DOI] [PMC free article] [PubMed] [Google Scholar]
- Bonnefond, M. , & Jensen, O. (2015). Gamma activity coupled to alpha phase as a mechanism for top‐down controlled gating. PLoS One, 10(6), e0128667. [DOI] [PMC free article] [PubMed] [Google Scholar]
- Botzel, K. , & Grusser, O.‐J. (1989). Electric brain potentials evoked by pictures of faces and non‐faces: A search for “face‐specific” EEG‐potentials. Experimental Brain Research, 77(2), 349–360. [DOI] [PubMed] [Google Scholar]
- Brainard, D. H. (1997). The psychophysics toolbox. Spatial Vision, 10(4), 433–436. [PubMed] [Google Scholar]
- Caballero, A. , & Tseng, K. Y. (2016). GABAergic function as a limiting factor for prefrontal maturation during adolescence. Trends in Neurosciences, 39(7), 441–448. [DOI] [PMC free article] [PubMed] [Google Scholar]
- Canolty, R. T. , Edwards, E. , Dalal, S. S. , Soltani, M. , Nagarajan, S. S. , Kirsch, H. E. , … Knight, R. T. (2006). High gamma power is phase‐locked to theta oscillations in human neocortex. Science, 313(5793), 1626–1628. [DOI] [PMC free article] [PubMed] [Google Scholar]
- Canolty, R. T. , & Knight, R. T. (2010). The functional role of cross‐frequency coupling. Trends in Cognitive Sciences, 14(11), 506–515. [DOI] [PMC free article] [PubMed] [Google Scholar]
- Casey, B. J. , Getz, S. , & Galvan, A. (2008). The adolescent brain. Developmental Review, 28(1), 62–77. [DOI] [PMC free article] [PubMed] [Google Scholar]
- Charman, T. , & Baird, G. (2002). Practitioner review: Diagnosis of autism spectrum disorder in 2‐ and 3‐year‐old children. Journal of Child Psychology and Psychiatry, 43(3), 289–305. [DOI] [PubMed] [Google Scholar]
- Cohen Kadosh, K. , Cohen Kadosh, R. , Dick, F. , & Johnson, M. H. (2011). Developmental changes in effective connectivity in the emerging core face network. Cerebral Cortex, 21(6), 1389–1394. [DOI] [PMC free article] [PubMed] [Google Scholar]
- Dajani, D. R. , & Uddin, L. Q. (2015). Local brain connectivity across development in autism spectrum disorder: A cross‐sectional investigation. Autism Research. [DOI] [PMC free article] [PubMed] [Google Scholar]
- Dale, A. M. , Fischl, B. , & Sereno, M. I. (1999). Cortical surface‐based analysis. I. Segmentation and surface reconstruction. NeuroImage, 9(2), 179–194. [DOI] [PubMed] [Google Scholar]
- Dalton, K. M. , Nacewicz, B. M. , Johnstone, T. , Schaefer, H. S. , Gernsbacher, M. A. , Goldsmith, H. H. , … Davidson, R. J. (2005). Gaze fixation and the neural circuitry of face processing in autism. Nature Neuroscience, 8(4), 519–526. [DOI] [PMC free article] [PubMed] [Google Scholar]
- Di Martino, A. , Fair, D. A. , Kelly, C. , Satterthwaite, T. D. , Castellanos, F. X. , Thomason, M. E. , … Milham, M. P. (2014). Unraveling the miswired connectome: A developmental perspective. Neuron, 83(6), 1335–1353. [DOI] [PMC free article] [PubMed] [Google Scholar]
- Dominguez, L. G. , Velazquez, J. L. , & Galan, R. F. (2013). A model of functional brain connectivity and background noise as a biomarker for cognitive phenotypes: Application to autism. PLoS One, 8(4), e61493. [DOI] [PMC free article] [PubMed] [Google Scholar]
- Fischl, B. , Sereno, M. I. , & Dale, A. M. (1999). Cortical surface‐based analysis. II: Inflation, flattening, and a surface‐based coordinate system. NeuroImage, 9(2), 195–207. [DOI] [PubMed] [Google Scholar]
- Fischl, B. , Sereno, M. I. , Tootell, R. B. , & Dale, A. M. (1999). High‐resolution intersubject averaging and a coordinate system for the cortical surface. Human Brain Mapping, 8(4), 272–284. [DOI] [PMC free article] [PubMed] [Google Scholar]
- Fisher, R. A. (1915). Frequency distribution of the values of the correlation coefficient in samples of an indefinitely large population. Biometrika. Biometrika Trust, 10(4), 507–521. [Google Scholar]
- Fornari, E. , Rytsar, R. , & Knyazeva, M. G. (2014). Development of spatial integration depends on top‐down and interhemispheric connections that can be perturbed in migraine: A DCM analysis. Neurological Sciences, 35(S1), 215–224. [DOI] [PubMed] [Google Scholar]
- Fries, P. (2005). A mechanism for cognitive dynamics: Neuronal communication through neuronal coherence. Trends in Cognitive Sciences, 9(10), 474–480. [DOI] [PubMed] [Google Scholar]
- Fries, P. (2009). Neuronal gamma‐band synchronization as a fundamental process in cortical computation. Annual Review of Neuroscience, 32(1), 209–224. [DOI] [PubMed] [Google Scholar]
- Germine, L. T. , Duchaine, B. , & Nakayama, K. (2011). Where cognitive development and aging meet: Face learning ability peaks after age 30. Cognition, 118(2), 201–210. [DOI] [PubMed] [Google Scholar]
- Ghuman, A. S. , Brunet, N. M. , Li, Y. , Konecky, R. O. , Pyles, J. A. , Walls, S. A. , … Richardson, R. M. (2014). Dynamic encoding of face information in the human fusiform gyrus. Nature Communications, 5, 5672. [DOI] [PMC free article] [PubMed] [Google Scholar]
- Golarai, G. , Grill‐Spector, K. , & Reiss, A. L. (2006). Autism and the development of face processing. Clinical Neuroscience Research, 6(3), 145–160. [DOI] [PMC free article] [PubMed] [Google Scholar]
- Golarai, G. , Liberman, A. , Yoon, J. , & Spector, K. (2010). Differential development of the ventral visual cortex extends through adolescence. Front Hum Neurosci, 3:80. Journal of Vision, 10(7), 572. [DOI] [PMC free article] [PubMed] [Google Scholar]
- Goldenberg, D. , & Galvan, A. (2015). The use of functional and effective connectivity techniques to understand the developing brain. Developmental Cognitive Neuroscience, 12, 155–164. [DOI] [PMC free article] [PubMed] [Google Scholar]
- Gramfort, A. , Luessi, M. , Larson, E. , Engemann, D. A. , Strohmeier, D. , Brodbeck, C. , … Hamalainen, M. S. (2014). MNE software for processing MEG and EEG data. NeuroImage, 86, 446–460. [DOI] [PMC free article] [PubMed] [Google Scholar]
- Gur, R. C. , Sara, R. , Hagendoorn, M. , Marom, O. , Hughett, P. , Macy, L. , … Gur, R. E. (2002). A method for obtaining 3‐dimensional facial expressions and its standardization for use in neurocognitive studies. Journal of Neuroscience Methods, 115(2), 137–143. [DOI] [PubMed] [Google Scholar]
- Hämäläinen, M. S. , & Sarvas, J. (1987). Feasibility of the homogeneous head model in the interpretation of neuromagnetic fields. Physics in Medicine and Biology, 32(1), 91–97. [DOI] [PubMed] [Google Scholar]
- Han, S. , Tai, C. , Westenbroek, R. E. , Yu, F. H. , Cheah, C. S. , Potter, G. B. , … Catterall, W. A. (2012). Autistic‐like behaviour in Scn1a+/‐ mice and rescue by enhanced GABA‐mediated neurotransmission. Nature, 489(7416), 385–390. [DOI] [PMC free article] [PubMed] [Google Scholar]
- Hashemi, E. , Ariza, J. , Rogers, H. , Noctor, S. C. , & Martinez‐Cerdeno, V. (2017). The number of parvalbumin‐expressing interneurons is decreased in the prefrontal cortex in autism. Cerebral Cortex, 1, [DOI] [PMC free article] [PubMed] [Google Scholar]
- Hoftman, G. D. , & Lewis, D. A. (2011). Postnatal developmental trajectories of neural circuits in the primate prefrontal cortex: Identifying sensitive periods for vulnerability to schizophrenia. Schizophr. Bull, 37(3), 493–503. [DOI] [PMC free article] [PubMed] [Google Scholar]
- Hubl, D. , Bolte, S. , Feineis‐Matthews, S. , Lanfermann, H. , Federspiel, A. , Strik, W. , … Dierks, T. (2003). Functional imbalance of visual pathways indicates alternative face processing strategies in autism. Neurology, 61(9), 1232–1237. [DOI] [PubMed] [Google Scholar]
- Jeffreys, D. A. (1989). A face‐responsive potential recorded from the human scalp. Experimental Brain Research, 78(1), 193–202. [DOI] [PubMed] [Google Scholar]
- Jensen, O. , & Mazaheri, A. (2010). Shaping functional architecture by oscillatory alpha activity: Gating by inhibition. Frontiers in Human Neuroscience, 4, 186. [DOI] [PMC free article] [PubMed] [Google Scholar]
- Just, M. A. , Cherkassky, V. L. , Keller, T. A. , & Minshew, N. J. (2004). Cortical activation and synchronization during sentence comprehension in high‐functioning autism: Evidence of underconnectivity. Brain, 127(8), 1811–1821. [DOI] [PubMed] [Google Scholar]
- Kana, R. K. , Libero, L. E. , & Moore, M. S. (2011). Disrupted cortical connectivity theory as an explanatory model for autism spectrum disorders. Physics of Life Reviews, 8(4), 410–437. [DOI] [PubMed] [Google Scholar]
- Kanwisher, N. , McDermott, J. , & Chun, M. M. (1997). The fusiform face area: A module in human extrastriate cortex specialized for face perception. Journal of Neuroscience, 17(11), 4302–4311. [DOI] [PMC free article] [PubMed] [Google Scholar]
- Kaufman, A. S. , & Kaufman, N. L. (2004). Kaufman brief intelligence test (2nd ed.). Shoreview, MN: AGS Publishing. [Google Scholar]
- Khan, S. , Gramfort, A. , Shetty, N. , Kitzbichler, M. , Ganesan, S. , Moran, J. M. , … Kenet, T. (2013). Local and long‐range functional connectivity is reduced in concert in autism spectrum disorders. Proceedings of the National Academy of Sciences, 110(8), 3107–3112. [DOI] [PMC free article] [PubMed] [Google Scholar]
- Khan, S. , Hashmi, J. A. , Mamashli, F. , Bharadwaj, H. M. , Ganesan, S. , Michmizos, K. P. , … Kenet, T. (2016). Altered onset response dynamics in somatosensory processing in autism spectrum disorder. Frontiers in Neuroscience, 10, 255. [DOI] [PMC free article] [PubMed] [Google Scholar]
- Khan, S. , Hashmi, J. A. , Mamashli, F. , Michmizos, K. , Kitzbichler, M. G. , Bharadwaj, H. , … Kenet, T. (2018). Maturation trajectories of cortical resting‐state networks depend on the mediating frequency band. NeuroImage, 174, 57–68. [DOI] [PMC free article] [PubMed] [Google Scholar]
- Khan, S. , Michmizos, K. , Tommerdahl, M. , Ganesan, S. , Kitzbichler, M. , Zetino, M. , … Kenet, T. (2015). Somatosensory cortex functional connectivity abnormalities in autism show opposite trends, depending on direction and spatial scale. Brain, awv043, [DOI] [PMC free article] [PubMed] [Google Scholar]
- Kleinhans, N. M. , Richards, T. , Sterling, L. , Stegbauer, K. C. , Mahurin, R. , Johnson, L. C. , … Aylward, E. (2008). Abnormal functional connectivity in autism spectrum disorders during face processing. Brain, 131(4), 1000–1012. [DOI] [PubMed] [Google Scholar]
- Koshino, H. , Kana, R. K. , Keller, T. A. , Cherkassky, V. L. , Minshew, N. J. , & Just, M. A. (2008). fMRI investigation of working memory for faces in autism: Visual coding and underconnectivity with frontal areas. Cerebral Cortex, 18(2), 289–300. [DOI] [PMC free article] [PubMed] [Google Scholar]
- Kramer, M. A. , Tort, A. B. , & Kopell, N. J. (2008). Sharp edge artifacts and spurious coupling in EEG frequency comodulation measures. Journal of Neuroscience Methods, 170(2), 352–357. [DOI] [PubMed] [Google Scholar]
- Lawrence, K. , Bernstein, D. , Pearson, R. , Mandy, W. , Campbell, R. , & Skuse, D. (2008). Changing abilities in recognition of unfamiliar face photographs through childhood and adolescence: Performance on a test of non‐verbal immediate memory (Warrington RMF) from 6 to 16 years. Journal of Neuropsychology, 2(1), 27–45. [DOI] [PubMed] [Google Scholar]
- Le Magueresse, C. , & Monyer, H. (2013). GABAergic interneurons shape the functional maturation of the cortex. Neuron, 77(3), 388–405. [DOI] [PubMed] [Google Scholar]
- Lega, B. , Burke, J. , Jacobs, J. , & Kahana, M. J. (2016). Slow‐theta‐to‐gamma phase‐amplitude coupling in human hippocampus supports the formation of new episodic memories. Cerebral Cortex, 26(1), 268–278. [DOI] [PMC free article] [PubMed] [Google Scholar]
- Leung, R. C. , Ye, A. X. , Wong, S. M. , Taylor, M. J. , & Doesburg, S. M. (2014). Reduced beta connectivity during emotional face processing in adolescents with autism. Molecular Autism, 5(1), 51. [DOI] [PMC free article] [PubMed] [Google Scholar]
- Li, J. , Liu, J. , Liang, J. , Zhang, H. , Zhao, J. , Huber, D. E. , … Shi, G. (2009). A distributed neural system for top‐down face processing. Neuroscience Letters, 451(1), 6–10. [DOI] [PMC free article] [PubMed] [Google Scholar]
- Lin, F. H. , Belliveau, J. W. , Dale, A. M. , & Hämäläinen, M. S. (2006). Distributed current estimates using cortical orientation constraints. Human Brain Mapping, 27(1), 1–13. [DOI] [PMC free article] [PubMed] [Google Scholar]
- Lord, C. , Rutter, M. , DiLavore, P. C. , & Risi, S. (1999). Autism diagnostic observation schedule—WPS (ADOS‐WPS). Los Angeles, CA: Western Psychological Services. [Google Scholar]
- Lundqvist, D. , Flykt, A. , & Öhman, A. (1998). The Karolinska directed emotional faces—KDEF (CD ROM). Stockholm: Karolinska Institute, Department of Clinical Neuroscience, Psychology Section. [Google Scholar]
- Lynn, A. C. , Padmanabhan, A. , Simmonds, D. , Foran, W. , Hallquist, M. N. , Luna, B. , & O'Hearn, K. (2018). Functional connectivity differences in autism during face and car recognition: Underconnectivity and atypical age‐related changes. Developmental Science, 21(1), e12508. [DOI] [PMC free article] [PubMed] [Google Scholar]
- Mamashli, F. , Khan, S. , Bharadwaj, H. , Michmizos, K. , Ganesan, S. , Garel, K. A. , … Kenet, T. (2017). Auditory processing in noise is associated with complex patterns of disrupted functional connectivity in autism spectrum disorder. Autism Research, 10(4), 631–647. [DOI] [PMC free article] [PubMed] [Google Scholar]
- Marin, O. (2016). Developmental timing and critical windows for the treatment of psychiatric disorders. Nature Medicine, 22(11), 1229–1238. [DOI] [PubMed] [Google Scholar]
- Maris, E. , & Oostenveld, R. (2007). Nonparametric statistical testing of EEG‐ and MEG‐data. Journal of Neuroscience Methods, 164(1), 177–190. [DOI] [PubMed] [Google Scholar]
- Maris, E. , Oostenveld, R. , J. M., & Fries, P. (2007). Nonparametric statistical testing of EEG‐ and MEG‐datacoherence differences. Journal of Neuroscience Methods, 164(1), 177. 164163:177–90161‐75. [DOI] [PubMed] [Google Scholar]
- Mathewson, K. E. , Gratton, G. , Fabiani, M. , Beck, D. M. , & Ro, T. (2009). To see or not to see: Prestimulus alpha phase predicts visual awareness. Journal of Neuroscience, 29(9), 2725–2732. [DOI] [PMC free article] [PubMed] [Google Scholar]
- Muller, R. A. , Shih, P. , Keehn, B. , Deyoe, J. R. , Leyden, K. M. , & Shukla, D. K. (2011). Underconnected, but how? A survey of functional connectivity MRI studies in autism spectrum disorders. Cerebral Cortex, [DOI] [PMC free article] [PubMed] [Google Scholar]
- Nadel, S. , & Poss, J. E. (2007). Early detection of autism spectrum disorders: Screening between 12 and 24 months of age. Journal of the American Academy of Nurse Practitioners, 19(8), 408–417. [DOI] [PubMed] [Google Scholar]
- Nakai, T. , Nagai, T. , Wang, R. , Yamada, S. , Kuroda, K. , Kaibuchi, K. , & Yamada, K. (2014). Alterations of GABAergic and dopaminergic systems in mutant mice with disruption of exons 2 and 3 of the Disc1 gene. Neurochemistry International, 74, 74–83. [DOI] [PubMed] [Google Scholar]
- Nomi, J. S. , & Uddin, L. Q. (2015). Developmental changes in large‐scale network connectivity in autism. NeuroImage. Clinical, 7, 732–741. [DOI] [PMC free article] [PubMed] [Google Scholar]
- O'Hearn, K. , Schroer, E. , Minshew, N. , & Luna, B. (2010). Lack of developmental improvement on a face memory task during adolescence in autism. Neuropsychologia, 48(13), 3955–3960. [DOI] [PMC free article] [PubMed] [Google Scholar]
- O'Hearn, K. , Tanaka, J. , Lynn, A. , Fedor, J. , Minshew, N. , & Luna, B. (2014). Developmental plateau in visual object processing from adolescence to adulthood in autism. Brain and Cognition, 90, 124–134. [DOI] [PMC free article] [PubMed] [Google Scholar]
- O'Reilly, C. , Lewis, J. D. , & Elsabbagh, M. (2017). Is functional brain connectivity atypical in autism? A systematic review of EEG and MEG studies. PLoS One, 12(5), e0175870. [DOI] [PMC free article] [PubMed] [Google Scholar]
- Padmanabhan, A. , Lynn, A. , Foran, W. , Luna, B. , & O'Hearn, K. (2013). Age related changes in striatal resting state functional connectivity in autism. Frontiers in Human Neuroscience, 7, 814. [DOI] [PMC free article] [PubMed] [Google Scholar]
- Pelli, D. G. (1997). The VideoToolbox software for visual psychophysics: Transforming numbers into movies. Spatial Vision, 10(4), 437–442. [PubMed] [Google Scholar]
- Pelphrey, K. A. , Lopez, J. , & Morris, J. P. (2009). Developmental continuity and change in responses to social and nonsocial categories in human extrastriate visual cortex. Frontiers in Human Neuroscience, 3, 25. [DOI] [PMC free article] [PubMed] [Google Scholar]
- Penzes, P. , Buonanno, A. , Passafaro, M. , Sala, C. , & Sweet, R. A. (2013). Developmental vulnerability of synapses and circuits associated with neuropsychiatric disorders. Journal of Neurochemistry, 126(2), 165–182. [DOI] [PMC free article] [PubMed] [Google Scholar]
- Perlman, S. B. , Hudac, C. M. , Pegors, T. , Minshew, N. J. , & Pelphrey, K. A. (2011). Experimental manipulation of face‐evoked activity in the fusiform gyrus of individuals with autism. Society Neuroscience, 6(1), 22–30. [DOI] [PMC free article] [PubMed] [Google Scholar]
- Picci, G. , & Scherf, K. S. (2015). A two‐hit model of autism: Adolescence as the second hit. Clinical Psychological Science, 3(3), 349–371. [DOI] [PMC free article] [PubMed] [Google Scholar]
- Pierce, K. , & Courchesne, E. (2001). Evidence for a cerebellar role in reduced exploration and stereotyped behavior in autism. Biological Psychiatry, 49(8), 655–664. [DOI] [PubMed] [Google Scholar]
- Piro, J. M. (1998). Handedness and intelligence: Patterns of hand preference in gifted and nongifted children. Developmental Neuropsychology, 14(4), 619–630. [Google Scholar]
- Puce, A. , Allison, T. , & McCarthy, G. (1999). Electrophysiological studies of human face perception. III: Effects of top‐down processing on face‐specific potentials. Cerebral Cortex, 9(5), 445–458. [DOI] [PubMed] [Google Scholar]
- Ratto, A. B. , & Mesibov, G. B. (2015). Autism spectrum disorders in adolescence and adulthood: Long‐term outcomes and relevant issues for treatment and research. Science China Life Sciences, 58(10), 1010–1015. [DOI] [PubMed] [Google Scholar]
- Righart, R. , Andersson, F. , Schwartz, S. , Mayer, E. , & Vuilleumier, P. (2010). Top‐down activation of fusiform cortex without seeing faces in prosopagnosia. Cerebral Cortex, 20(8), 1878–1890. [DOI] [PubMed] [Google Scholar]
- Rosenthal, M. , Wallace, G. L. , Lawson, R. , Wills, M. C. , Dixon, E. , Yerys, B. E. , & Kenworthy, L. (2013). Impairments in real‐world executive function increase from childhood to adolescence in autism spectrum disorders. Neuropsychology, 27(1), 13–18. [DOI] [PMC free article] [PubMed] [Google Scholar]
- Schultz, R. T. , Gauthier, I. , Klin, A. , Fulbright, R. K. , Anderson, A. W. , Volkmar, F. , … Gore, J. C. (2000). Abnormal ventral temporal cortical activity during face discrimination among individuals with autism and Asperger syndrome. Archives of General Psychiatry, 57(4), 331–340. [DOI] [PubMed] [Google Scholar]
- Sekihara, K. , Owen, J. P. , Trisno, S. , & Nagarajan, S. S. (2011). Removal of spurious coherence in MEG source‐space coherence analysis. IEEE Transactions on Biomedical Engineering, 58(11), 3121–3129. [DOI] [PMC free article] [PubMed] [Google Scholar]
- Sole‐Padulles, C. , Castro‐Fornieles, J. , de la Serna, E. , Calvo, R. , Baeza, I. , Moya, J. , … Sugranyes, G. (2016). Intrinsic connectivity networks from childhood to late adolescence: Effects of age and sex. Developmental Cognitive Neuroscience, 17, 35–44. [DOI] [PMC free article] [PubMed] [Google Scholar]
- Song, Y. , Zhu, Q. , Li, J. , Wang, X. , & Liu, J. (2015). Typical and atypical development of functional connectivity in the face network. Journal of Neuroscience, 35(43), 14624–14635. [DOI] [PMC free article] [PubMed] [Google Scholar]
- Supekar, K. , Uddin, L. Q. , Khouzam, A. , Phillips, J. , Gaillard, W. D. , Kenworthy, L. E. , … Menon, V. (2013). Brain hyperconnectivity in children with autism and its links to social deficits. Cell Reports, 5(3), 738–747. [DOI] [PMC free article] [PubMed] [Google Scholar]
- Taulu, S. , Kajola, M. , & Simola, J. (2004). Suppression of interference and artifacts by the Signal Space Separation Method. Brain Topography, 16(4), 269–275. [DOI] [PubMed] [Google Scholar]
- Taulu, S. , & Simola, J. (2006). Spatiotemporal signal space separation method for rejecting nearby interference in MEG measurements. Physics in Medicine and Biology, 51(7), 1759–1768. [DOI] [PubMed] [Google Scholar]
- Uddin, L. Q. , Supekar, K. , & Menon, V. (2013). Reconceptualizing functional brain connectivity in autism from a developmental perspective. Frontiers in Human Neuroscience, 7, 458. [DOI] [PMC free article] [PubMed] [Google Scholar]
- Uutela, K. , Taulu, S. , & Hämäläinen, M. (2001). Detecting and correcting for head movements in neuromagnetic measurements. NeuroImage, 14(6), 1424–1431. [DOI] [PubMed] [Google Scholar]
- Van Essen, D. C. , & Dierker, D. L. (2007). Surface‐based and probabilistic atlases of primate cerebral cortex. Neuron, 56(2), 209–225. [DOI] [PubMed] [Google Scholar]
- Wetherby, A. M. , Watt, N. , Morgan, L. , & Shumway, S. (2007). Social communication profiles of children with autism spectrum disorders late in the second year of life. Journal of Autism and Developmental Disorders, 37(5), 960–975. [DOI] [PubMed] [Google Scholar]
- Zaidel, A. , Spivak, A. , Shpigelman, L. , Bergman, H. , & Israel, Z. (2009). Delimiting subterritories of the human subthalamic nucleus by means of microelectrode recordings and a Hidden Markov Model. Movement Disorders, 24(12), 1785–1793. [DOI] [PubMed] [Google Scholar]
- Zhou, G. , Liu, J. , Ding, X. P. , Fu, G. , & Lee, K. (2016). Development of effective connectivity during own‐ and other‐race face processing: A Granger causality analysis. Frontiers in Human Neuroscience, 10, 474. [DOI] [PMC free article] [PubMed] [Google Scholar]
Associated Data
This section collects any data citations, data availability statements, or supplementary materials included in this article.
Supplementary Materials
Additional Supporting Information may be found online in the supporting information tab for this article.
Supporting Information