This article evaluates the prognostic significance of tumor‐stroma and the maturity of fibrotic tumor stroma and α‐smooth muscle actin expression in a larger cohort of intrahepatic cholangiocarcinoma. A prognostic nomogram was established based on the findings, and it offers a simple way to predict survival with reference to the histological features of FTS in ICC.
Keywords: Prognosis, Nomogram, Fibrotic tumor stroma, Intrahepatic cholangiocarcinoma
Abstract
Background.
Fibrotic tumor stroma (FTS) has been implicated in cancer promotion in several neoplasms. The histological features of FTS are convenient and easily accessible in clinical routine in intrahepatic cholangiocarcinoma (ICC) specimens. The goal of this study was to explore prognostic impacts of the quantity and maturity of FTS on surgical ICC patients. Moreover, we aimed to propose an efficient prognostic nomogram for postoperative ICC patients.
Materials and Methods.
The clinical profiles of 154 consecutive postoperative ICC patients were retrospectively analyzed. Tumor‐stroma ratio and morphological maturity of FTS were evaluated on hematoxylin and eosin‐stained tumor sections. CD3, CD8, and α‐smooth muscle actin (α‐SMA) staining were performed on corresponding tissue microarrays. The nomogram was established on variables selected by multivariate analyses and was validated in 10‐fold cross‐validation.
Results.
Rich tumor stroma and strong α‐SMA expression were associated with poor overall survival (OS). However, in multivariate analyses, these two biomarkers failed to stratify both OS and recurrence‐free survival (RFS). Immature FTS was correlated with tumor multiplicity, advanced clinical stage, and sparser CD3 and CD8 positive tumor‐infiltrating lymphocytes (TILs) and was identified as an independent prognostic indicator for both OS and RFS. The nomogram comprising FTS maturity, tumor number, microvascular invasion, and lymph node metastasis possessed higher predictive power relative to conventional staging systems.
Conclusion.
Immature FTS was an independent risk factor for survival and was associated with sparser CD3 and CD8 positive TILs in ICC. The prognostic nomogram integrating the maturity of FTS offers a more accurate risk stratification for postoperative ICC patients.
Implications for Practice.
Accumulating evidence has suggested that fibrotic components in tumor microenvironment (TME) play a complicated and vital role in TME reprogramming and cancer progression. However, in clinical practice, the evaluation of fibrotic tumor stroma (FTS) is still neglected to some extent. This study's findings indicated that, in intrahepatic cholangiocarcinoma (ICC), the histological maturity of FTS is a robust prognostic indicator for patients who underwent curative resection. Moreover, prognostic nomogram constructed on the maturity of FTS possessed higher predictive power relative to the conventional tumor‐node‐metastasis staging systems. Taken together, the evaluation of FTS should be emphasized in clinical routine for more accurate prognostic prediction in postoperative ICC patients.
摘要
背景。纤维化肿瘤间质 (FTS) 被认为与促进某些肿瘤发展密切相关。在肝内胆管癌 (ICC) 样本的临床常规方面,FTS的组织学特征方便易取。本研究的目标是探求 FTS 的数量及成熟度对外科手术 ICC 患者的预后影响。此外,我们计划为术后 ICC 患者提供一份有效的预后列线图。
材料和方法。回顾性分析连续154位术后 ICC 患者的临床特征。在苏木精和伊红染色的肿瘤切片上对肿瘤间质比率和 FTS 的形态学成熟度进行了评估。在相应的组织微阵列上进行了 CD3、CD8 和 α 平滑肌肌动蛋白 (α‐SMA) 染色。列线图通过多元分析选定的变量制定而成,并经过十倍交叉验证。
结果。丰富的肿瘤基质和较强的 α‐SMA 表达与较差的总生存 (OS) 相关。但是,在多元分析中,这两种生物指标未能将 OS 和无复发生存 (RFS) 分层。未成熟的 FTS 与肿瘤多发率、临床晚期及稀少的 CD3 和 CD8 阳性肿瘤浸润性淋巴细胞 (TIL) 相关,并被认定为 OS 和 RFS 的独立预后指标。与传统的分期系统相比,由 FTS 成熟度、肿瘤数量、微血管侵犯和淋巴结转移组成的列线图具有更高的预测能力。
结论。未成熟的 FTS 是影响生存率的独立危险因素,且与 ICC 中稀少的 CD3 和 CD8 阳性 TIL 相关。整合 FTS 成熟度的预后列线图会为术后 ICC 患者提供更为准确的危险分层
Introduction
Intrahepatic cholangiocarcinoma (ICC) is the second most common liver malignancy, ranking behind hepatocellular carcinoma (HCC) [1], [2]. Although ICC is far less prevalent than HCC, its incidence has been steadily increasing worldwide [3]. Improving the survival of ICC patients has long been a tricky problem, because ICC represents a unique clinical entity: asymptomatic at early stage and no treatment other than surgical resection offers the chance for a cure [4]. As a result, only a small proportion of patients who present at an early stage are eligible for resection. To make it worse, for patients who underwent surgical resection, the recurrence rate is high, along with a 5‐year overall survival (OS) rate in the range of 14%–40% [5], [6], [7]. Therefore, the exploration of prognostic factors that facilitate the risk stratification and further clinical decision‐making is of great value.
Tumor stroma or tumor microenvironment (TME), which comprises immune cells, cancer‐associated fibroblasts (CAFs), capillaries, and extracellular matrix (ECM) around cancer cells, has drawn increasing attention in predicting tumor prognosis, attributed to that the aggressiveness of cancer is not only up to cancer cell‐autonomous defects but also depends on TME functions [8]. CAFs have been observed to play a vital role in TME—they participate in the synthesis of ECM and the metabolic and immune reprogramming of TME, and their quantity and quality may act as critical determinants of cancer cell behavior and disease progression [8]. Tumor‐stoma ratio (TSR), which reflects the quantity of fibrotic tumor stroma (FTS) within solid tumors, has been identified as a prognostic indicator in several cancer types. Stroma‐rich patients were observed to have significant poorer prognosis in colorectal cancer (CRC), breast cancer, and HCC [9], [10], [11]. On the other hand, several studies that define the quality of FTS through its morphological characteristics, collagen deposition, and α‐smooth muscle actin (α‐SMA) expression have manifested that the maturity of CAFs also has a significant impact on patient prognosis [12], [13], [14], [15]. However, clinically, the evaluation of fibrotic components of tumor stroma is neglected to some extent in ICC.
Different from HCC, ICC progresses more rapidly and causes excessive desmoplastic reaction. However, research that unravels the association between the morphological features of FTS and prognosis is scarce. In 1999, Kajiyama et al. categorized 48 surgically resected ICC cases into “scirrhous‐type” and “nonscirrhous‐type” according to whether the scirrhous area was more than 70% in the largest cut surface and observed that their categorization only stratified OS in univariate analysis [16]. But few studies have elucidated whether TSR, an updated and widely validated quantitative marker for stroma, performed better in discriminating prognosis in ICC. On the other hand, recently, Shao et al. summarized prognostic significances of a range of stroma‐derived biomarkers including α‐SMA expression and histological classification of CAFs in 71 ICC cases. Intriguingly, only their dichotomization on the morphological maturity of CAFs was identified as an independent prognostic factor for OS [17]. However, the sample size was small, and they did not offer a way to apply their results in clinical practice.
Based on the abovementioned limitations of previous studies, it is reasonable to evaluate the prognostic significance of TSR, the maturity of FTS, and α‐SMA expression together in a larger cohort of ICC. Furthermore, we wished to establish a prognostic nomogram based on our findings to offer a simple and intuitional way to predict survival with reference to histological features of FTS in ICC. The CD3+ and CD8+ tumor‐infiltrating T lymphocytes (TILs) were analyzed to explore a rational basis of our findings concerning FTS.
Materials and Methods
Patients
The clinicopathological profiles of 154 consecutive patients who underwent curative resection for ICC from August 2005 to December 2014 in Zhongshan Hospital, Fudan University were retrospectively reviewed. The flow chart for patient selection is shown in supplemental online Figure 1. All the enrolled patients met the following inclusion criteria: pathologically confirmed ICC; received no preoperative anticancer treatments; no history and concurrence of other malignant tumors; complete removal of macroscopic tumors and histopathologically confirmed negative resection margin; and complete clinicopathological and follow‐up data. Patients with mixed cancers or distant metastasis before the surgery were excluded. All the patients signed informed consent before surgery that permitted the use of resected tumors and clinical profiles in research under the condition of anonymity. The study was approved by the Clinical Research Ethics Committee of Zhongshan hospital.
Preoperative blood tests comprising liver function parameters, α‐fetoprotein, CA19‐9, and carcino‐embryonic antigen were performed within 3 days before operation. The liver function was assessed by the Child‐Pugh classification and the albumin‐bilirubin grade [18]. The clinical staging was based on the American Joint Committee on Cancer (AJCC) 8th edition and the Liver Cancer Study Group of Japan (LCSGJ) staging system [19], [20].
Follow‐Up
Postoperative follow‐up was carried out every 1–6 months after discharge as described in our previous study [21]. Serological tumor biomarkers, abdominal ultrasonography, and chest X‐ray were routinely monitored in each follow‐up. For patients with suspected recurrence or distal metastasis, computed tomography and/or magnetic resonance imaging were performed to confirm. The recurrence‐free survival (RFS) time was calculated from the date of surgery to the date when recurrence was first identified. The OS was defined as the time interval from surgery to death. For patients without a documented RFS/OS event, the data were censored at the last follow‐up. The median follow‐up time of the current study was 20.1 months (range 2.4–79.1 months).
Determination of TSR, Morphological Categorization, and α‐SMA Evaluation of CAFs
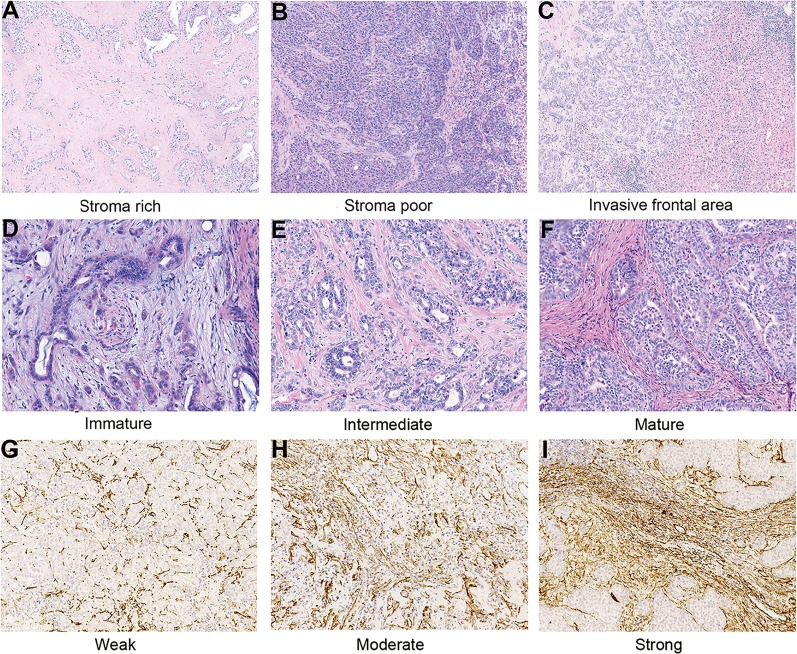
The TSR and morphological categorization was determined on 5‐μm hematoxylin and eosin‐stained tumor sections. As described in previous studies, the area with the highest proportion of stroma was used to determine the final result concerning tumor heterogeneity [9], [10]. In addition, only areas that were surrounded by tumor cells were considered in order to avoid the interference from peripheral regions of the tumor. The photos of the representative area were taken with 10× objective (Fig. 1A, 1B). The proportion of stroma area was estimated via the software Image Pro‐Plus version 6.0 (Media Cybernetics, Rockville, MD).
Figure 1.
Representative images of intrahepatic cholangiocarcinoma (ICC) with different histological fibrotic tumor stroma features. Tumor‐stoma ratio: Stroma rich (A) and stroma poor (B; original magnification, ×100). Histological classification of fibrotic stroma in ICC: Invasive frontal area of ICC (C; original magnification, ×100); immature: myxoid stroma with randomly oriented short keloid‐like collagen bundles (D); intermediate: keloid‐like collagen intermingled with mature fibers (E); mature: fine elongated collagen fibers (F; original magnification, ×200). Representative microphotographs of weak (G), moderate (H), and strong (I) expression of α‐smooth muscle actin in tissue microarrays (original magnification, ×200).
As indicated in previous studies, FTS was classified as “mature,” “intermediate,” and “immature” types according to the morphology of stroma at the invasive frontal area (Fig. 1C) [12], [14], [22]. Immature FTS was characterized by myxoid stroma with randomly oriented short keloid‐like collagen bundles (Fig. 1D). In a moderate tumor stroma, broad bands of collagen with brightly eosinophilic hyalinization, which were similar to those in a keloid, were intermingled with mature fibers (Fig. 1E). Mature FTS was characterized by multilayered fine elongated collagen fibers with intense staining (Fig. 1F).
Immunohistochemistry (IHC) for α‐SMA was performed on the tissue microarrays (TMA) of the enrolled patients according to standard protocol (Abcam, Cambridge, U.K.; Clone 1A4, dilution 1:2000). To make TMAs, representative areas of tumors were selected under a hematoxylin and eosin‐stained section of tumor block. Duplicate cores of 1 mm diameter were representative of tumors from each individual. The slides were scanned by Pannoramic MIDI and evaluated through Pannoramic Viewer (3DHISTECH, Budapest, Hungary). The immune stain density of α‐SMA was semi‐quantified by H‐score with the assistance of a DensitoQuant module from 3DHISTECH. The H‐score was determined by the percentage of immunoreactive cells multiplied by the corresponding staining intensity ranging from 0 to 12. For each individual, the final H‐score for α‐SMA expression was represented by the average H‐score of duplicates in TMA. The optimal cutoff value of H‐score of α‐SMA expression was determined by X‐tile (New Haven, CT) for optimal survival separation.
Quantification of the TILs
To perform IHC staining of CD3 and CD8, mouse monoclonal antibodies of CD3 and CD8 (Abcam) were purchased and used in dilutions of 1:200 and 1:1,000, respectively. The TMAs were then digitalized, and the stained T cells were calculated in the same manner as described in our previous studies [23], [24]. In brief, for each individual, the stained T cell counts were determined by the average of five independent microscopic fields (×400) with densest lymphocytic infiltrates.
All slides and TMAs were independently evaluated by two investigators (C‐Y.J. and Y‐P.F.) blinded with the clinical profiles of the patients. In the case of discordance, the two observers resolved the final score together.
Statistical Analysis
Statistical analysis was performed by SPSS version 21.0 (IBM, Armonk, NY) and R project version 3.4.0 (http://www.r-project.org/). Inter‐rater reliability was evaluated by Cohen's kappa coefficient. Differences between groups were identified by Pearson's chi‐squared test, Fisher's exact test, Mann‐Whitney U test, or Kruskal‐Wallis test as appropriate. Univariate analysis and multivariate analysis were conducted by the Cox proportional hazards model. The survival curves of OS and the RFS were plotted by the Kaplan‐Meier method and compared via the log‐rank test. The prognostic nomogram was established based on variables selected by multivariate analyses and cross‐validated by using the rms package in R project. The performance of the nomogram was evaluated by Concordance index (C‐index), calibration curve, and the decision curve analysis (DCA) as previously described [25], [26]. The optimal cutoff value of the continuous variable was determined by X‐tile [27].
Results
Clinicopathological Profiles
The detailed clinicopathological characteristics are presented in Table 1. The median OS time was 28.8 months (range 2.4–79.1 months). The 1‐, 3‐, and 5‐year OS rates were 72.6%, 46.9%, and 35.4%, respectively. The median RFS time was 13.6 months (range 1.0–74.6 months). The 1‐, 3‐, and 5‐year RFS rates were 54.5%, 32.5%, and 29.8%, respectively. The follow‐up time, OS time, and RFS time for ICC subgroups with different TSR, maturity of FTS, and α‐SMA expression were listed in supplemental online Table 1.
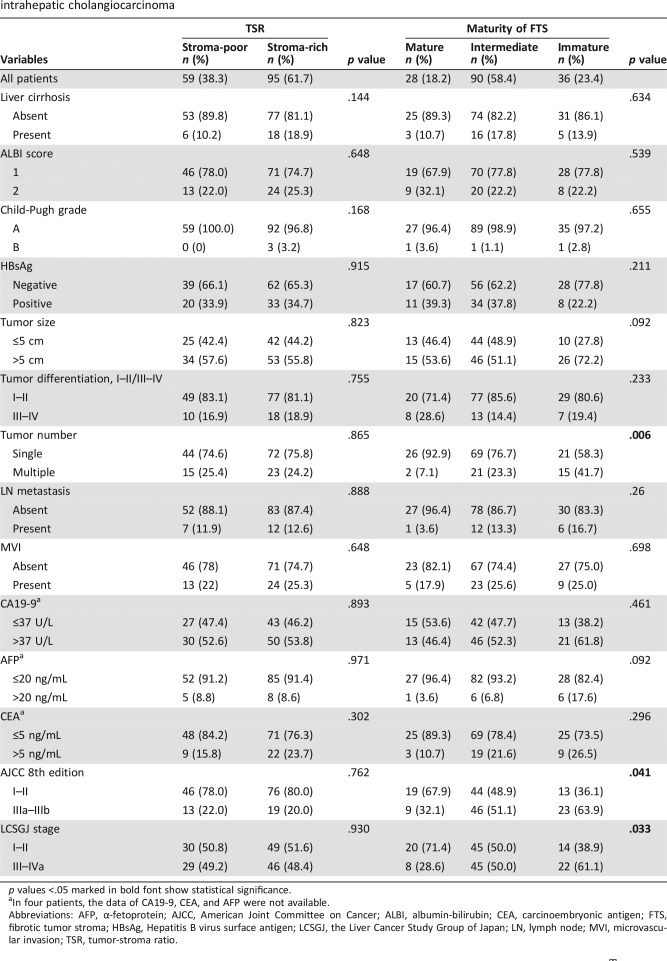
Table 1. Correlations between clinicopathological features and histological characteristics of FTS in patients with intrahepatic cholangiocarcinoma.
p values <.05 marked in bold font show statistical significance.
In four patients, the data of CA19‐9, CEA, and AFP were not available.
Abbreviations: AFP, α‐fetoprotein; AJCC, American Joint Committee on Cancer; ALBI, albumin‐bilirubin; CEA, carcinoembryonic antigen; FTS, fibrotic tumor stroma; HBsAg, Hepatitis B virus surface antigen; LCSGJ, the Liver Cancer Study Group of Japan; LN, lymph node; MVI, microvascular invasion; TSR, tumor‐stroma ratio.
Correlation Between Tumor‐Stromal Features and Clinicopathological Characteristics in ICC Patients
In consideration of the strong desmoplastic reaction in ICC, the cutoff value of TSR in ICC was reconfirmed via Image Pro‐Plus. The median of TSR was 47.0% (range 5.0%–96.0%). The optimal cutoff value of TSR in ICC was 50% according to X‐tile analysis, which was in accordance with the cutoff values of previous studies [28]. As shown in Table 1, 59 patients (38.3%) were classified as stroma‐poor and 95 patients (61.7%) were classified as stroma‐rich. In terms of cancer stroma maturity, the number of patients classified as mature, intermediate, and immature were 28 (18.2%), 90 (50.4%), and 36 (23.4%), respectively. According to X‐tile's calculation on H‐scores for α‐SMA expression, 84 (54.5%), 52 (33.8%), and 18 (11.7%) individuals were sorted into subgroups with weak, moderate, and strong α‐SMA expression, respectively (supplemental online Table 2). The kappa coefficient of evaluation for TSR, FTS maturity, and α‐SMA expression were 0.87, 0.83, and 0.89, respectively, which indicate good agreement between observers.
As illustrated in Table 1, immature FTS was associated with tumor multiplicity (p = .006) and advanced clinical stage (p = .041 and p = .033 for AJCC and LCSGJ, respectively). Strong α‐SMA expression was correlated with advanced clinical stage (supplemental online Table 2; p = .003 and p = .001 for AJCC and LCSGJ, respectively). No significant correlations were observed between clinical profiles and TSR.
Pairwise correlation analyses were also performed among the stroma‐derived variables. The Spearman's correlation test showed that immature FTS was significantly associated with abundant tumor stroma (supplemental online Table 3; p = .01 and ρ = 0.207). No correlation was found between the α‐SMA expression and the other two stroma‐derived variables (supplemental online Table 3; Spearman's correlation test for α‐SMA and TSR, p = .833; for α‐SMA and maturity of FTS: p = .07).
Prognostic Significance of Stromal Features in ICC Patients
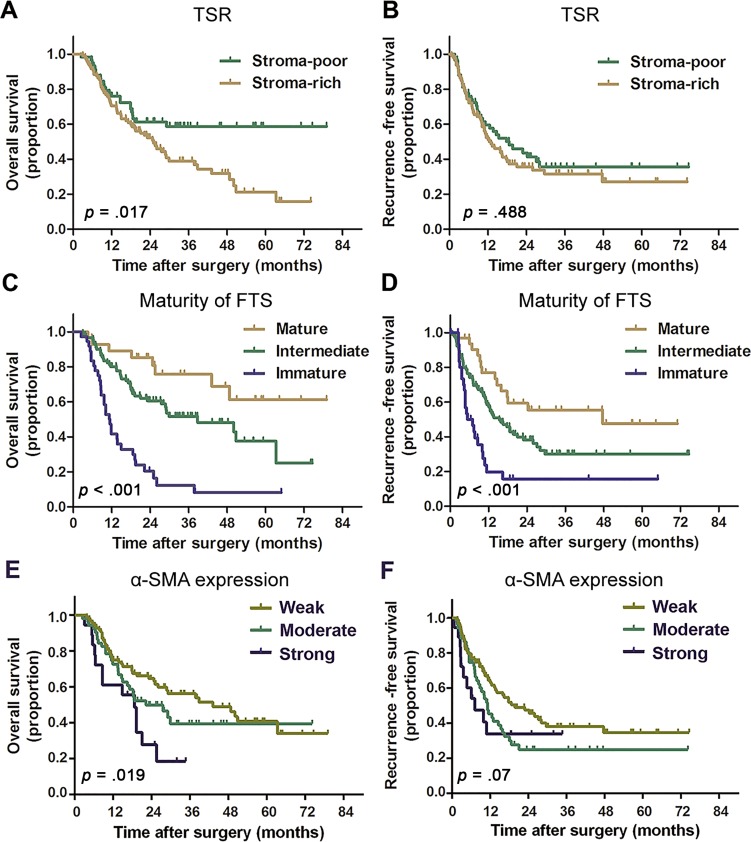
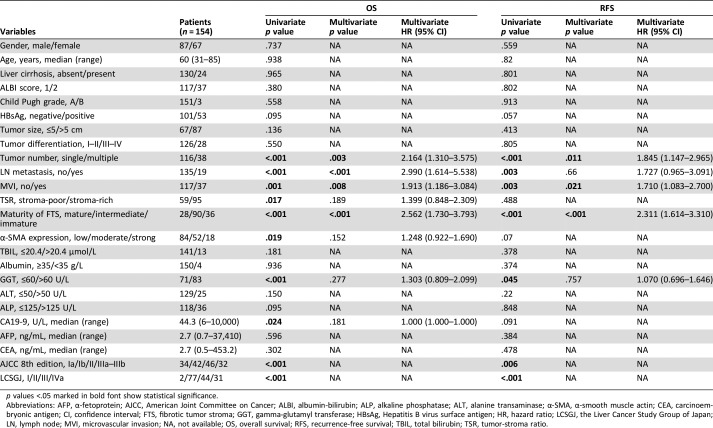
Kaplan‐Meier survival curves that depict the survival of patients with different TSR, FTS maturity, and α‐SMA expression are shown in Figure 2. The results of univariate and multivariate analyses are detailed in Table 2. TSR and α‐SMA expression were found to stratify OS in univariate analysis (p = .017 and p = .019 for TSR and α‐SMA, respectively) but failed to discriminate prognosis in multivariate analysis. Immature FTS was identified as an independent risk factor for unfavorable OS (p < .001, hazard ratio [HR] = 2.562, 95% confidence interval [CI] 1.730–3.793) and RFS (p < .001, HR = 2.311, 95% CI 1.614–3.310)
Figure 2.
Kaplan‐Meier curves for patients with intrahepatic cholangiocarcinoma according to TSR, FTS maturity, and α‐SMA expression. Patients with stroma‐rich tumor (A), immature FTS (C), and strong α‐SMA expression (E) were observed to have significantly unfavorable overall survival. Patients with immature FTS were associated with significant poorer recurrence‐free survival (RFS; D). No significant differences in RFS were found between patients with different TSR (B) and α‐SMA expression levels (F). p values were calculated by log‐rank test.
Abbreviations: FTS, fibrotic tumor stroma; SMA, smooth muscle actin; TSR, tumor‐stroma ratio.
Table 2. Univariate and multivariate analyses of prognostic factors associated with OS and RFS.
p values <.05 marked in bold font show statistical significance.
Abbreviations: AFP, α‐fetoprotein; AJCC, American Joint Committee on Cancer; ALBI, albumin‐bilirubin; ALP, alkaline phosphatase; ALT, alanine transaminase; α‐SMA, α‐smooth muscle actin; CEA, carcinoembryonic antigen; CI, confidence interval; FTS, fibrotic tumor stroma; GGT, gamma‐glutamyl transferase; HBsAg, Hepatitis B virus surface antigen; HR, hazard ratio; LCSGJ, the Liver Cancer Study Group of Japan; LN, lymph node; MVI, microvascular invasion; NA, not available; OS, overall survival; RFS, recurrence‐free survival; TBIL, total bilirubin; TSR, tumor‐stroma ratio.
Tumor multiplicity and the presence of microvascular invasion (MVI) were also found to be independent prognostic factors for both OS and RFS. The presence of lymph node (LN) metastasis was observed to be an independent prognostic indicator for OS (p < .001, HR = 2.990, 95% CI 1.614–5.538) but was not significant in multivariate analyses for RFS (p = .66, HR = 1.727, 95% CI 0.965–3.091).
Correlation Between Stromal Features and Intratumoral T Cell Counts
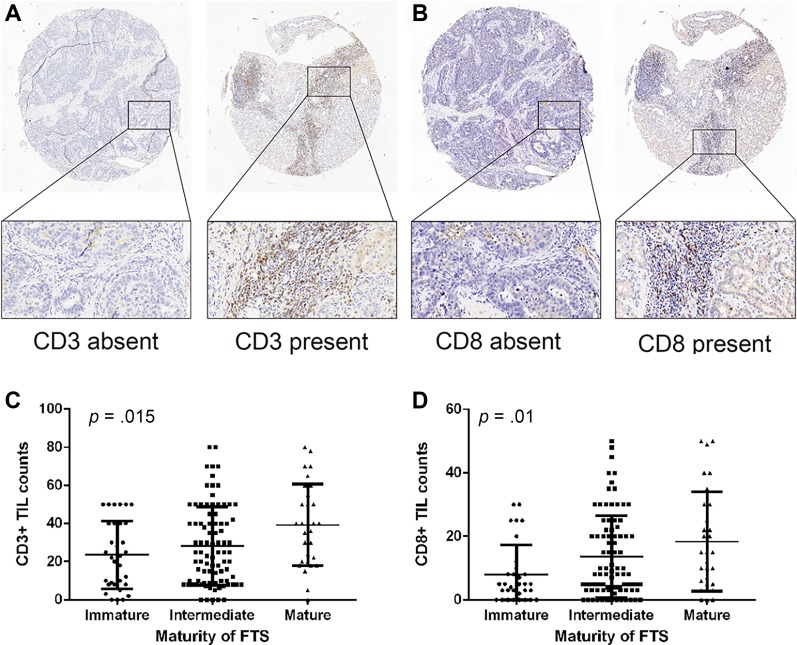
The representative images of CD3 and CD8 staining are shown in Figure 3A, 3B. The CD3+ and CD8+ TIL counts of subgroups with different stromal features are detailed in supplemental online Table 4. As illustrated in Figure 3C, 3D, both CD3+ and CD8+ TIL counts rose as the maturity of FTS increased (p = .015 and p = .01 for CD3+ and CD8+ TILs, respectively). The correlation analyses also validated that immature FTS was significantly associated with sparser intratumoral CD3‐ and CD8‐positive T cells (ρ = 0.224, p = .006 and ρ = 0.249, p = .002, respectively; supplemental online Table 4).
Figure 3.
Images of CD3‐ and CD8‐positive T cells and their infiltration patterns in patients with different maturity of FTS. Representative images of CD3 (A) and CD8 (B) immunohistochemistry staining (magnification ×50 for full views and ×200 for zoomed‐in views). The counts of CD3‐ (C) and CD8‐ (D) positive tumor‐infiltrating lymphocytes rose as the maturity of FTS increased. p values were generated by Kruskal‐Wallis test.
Abbreviations: FTS, fibrotic tumor stroma; TIL, tumor‐infiltrating lymphocyte.
Weak α‐SMA expression was correlated with denser CD3‐ and CD8‐positive TILs (ρ = −0.186, p = .022 and ρ = −0.265, p = .001, respectively; supplemental online Table 4). Compared with stroma‐poor cases, stroma‐rich cases were observed to have significantly decreased CD3+ TILs (p = .006) but comparable CD8+ TILs (p = .349).
Construction and Validation of the Prognostic Nomogram
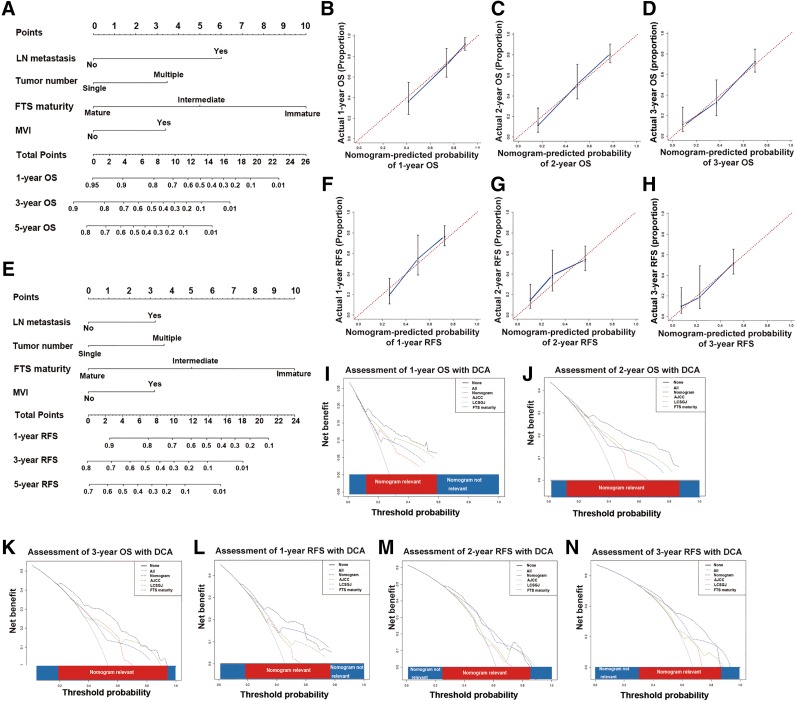
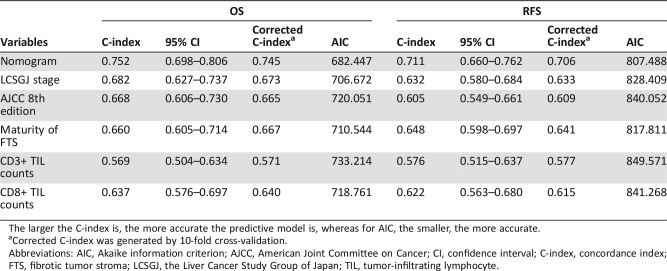
The prognostic nomogram constructed based on results of multivariate analyses is shown in Figure 4A, 4E. As shown in Table 3, the C‐indices of the nomogram for OS and RFS prediction were 0.752 (95% CI 0.698–0.806) and 0.711 (95% CI 0.660–0.762), respectively.
Figure 4.
Prognostic nomogram, calibration curves, and decision curve analyses. Prognostic nomogram integrating FTS maturity for OS (A) and RFS (E) prediction (Draw a vertical line from the variable axis to the “Points” axis to determine the points of each variable of an individual. Sum these numbers together, and you will get the total points of the patient. Then draw a downward vertical line from the “Total Points” axis to get a nomogram‐predicted likelihood of 1‐, 3‐, and 5‐year OS/RFS). The calibration curves for OS prediction at 1 year (B), 2 years (C), and 3 years (D); RFS prediction at 1 year (F), 2 years (G), and 3 years (H) after surgery. Nomogram‐predicted probability of survival is plotted on the x axis, and actual survival is plotted on the y axis. The dashed line shows perfect calibration when predicted survival coincides with the observed survival. Decision curve analyses depict the clinical net benefit in pairwise comparisons among different models. Nomogram is compared with the AJCC 8th edition, LCSGJ stage in terms of 1‐ (I), 2‐ (J), and 3‐year (K) OS and 1‐ (L), 2‐ (M), and 3‐year (N) RFS. Dashed lines indicate the net benefit of the predictive models across a range of threshold probabilities (black: nomogram; red: AJCC 8th edition; green: LCSGJ; blue: stroma maturity). The horizontal solid black line assumes that no patient will experience the event, and the solid gray line assumes that all patients will experience the event. On decision curve analyses, the nomogram represents a predictive model with higher net benefit relative to other counterparts across a wider range of threshold probabilities.
Abbreviations: AJCC, American Joint Committee on Cancer; DCA, decision curve analysis; FTS, fibrotic tumor stroma; LCSGJ, Liver Cancer Study Group of Japan; LN, lymph node; MVI, microvascular invasion; OS, overall survival; RFS, recurrence‐free survival.
Table 3. Predictive accuracy of predictive models in terms of C‐index and AIC in overall survival and recurrence‐free survival prediction.
The larger the C‐index is, the more accurate the predictive model is, whereas for AIC, the smaller, the more accurate.
Corrected C‐index was generated by 10‐fold cross‐validation.
Abbreviations: AIC, Akaike information criterion; AJCC, American Joint Committee on Cancer; CI, confidence interval; C‐index, concordance index; FTS, fibrotic tumor stroma; LCSGJ, the Liver Cancer Study Group of Japan; TIL, tumor‐infiltrating lymphocyte.
The calibration plots for the probability of OS at 1, 2, and 3 years after surgery showed good agreement between the prediction by nomogram and the actual observation (Fig. 4B–4D). The calibration plots for the probability of RFS at 1, 2, and 3 years after surgery showed optimal consistency between prediction by nomogram and the actual observation (Fig. 4F–4H).
Due to limited sample size, we used 10‐fold cross‐validation instead of validation in another independent cohort to avoid overfitting, which may lead to misunderstanding of the predictive power of the predictive models. As detailed in Table 3, the corrected C‐indices of 10‐fold cross‐validation of the nomogram for OS and RFS prediction were 0.745 and 0.706, respectively, which indicated that the constructed nomogram was a reliable and robust predictive model.
Comparative Performances of the Predictive Models
The predictive capability of the prognostic nomogram and the staging systems were compared in terms of the C‐index and the Akaike information criterion (AIC) [29]. The larger the C‐index is, the more accurate the predictive model is, whereas for AIC, the smaller, the more accurate [30]. The prognostic nomogram possessed the largest C‐index and the smallest AIC relative to AJCC 8th edition and LCSGJ stage, which indicated the nomogram to be a superior predictive model (C‐index comparison: nomogram vs. AJCC, p < .001 for both OS and RFS prediction; nomogram vs. LCSGJ, p < .05 for OS prediction and p = .004 for RFS prediction).
To further verify the superiority of the nomogram, we performed DCA, a method to assess predictive models based on their clinical usefulness [31]. On DCA, the nomogram showed better net benefit within a wider range of threshold probability and improved performance compared with AJCC 8th edition and LCSGJ stage in predicting 2‐ and 3‐year OS (Fig. 4I–4K) and RFS (Fig. 4L–4N). Taken together, the nomogram represents a more accurate and reliable predictive model relative to the conventional staging systems.
Discussion
In this study, we uncovered the associations between histological characteristics of FTS and prognosis in surgical cases for ICC. TSR, the most commonly used marker to quantify FTS, was not identified as an independent prognostic indicator for prognosis in ICC, whereas the histological classification on the maturity of FTS was identified as an independent prognostic factor for both OS and RFS. Moreover, we found that immature FTS was significantly associated with sparser intratumoral CD3‐ and CD8‐positive T cells. This phenomenon provided a reasonable explanation to our findings that patients with immature FTS had significantly shortened survival time. In the end, we established a prognostic nomogram incorporating the maturity of FTS. This nomogram represents a simpler and more accurate predictive model compared with conventional staging systems in risk stratification for postoperative ICC.
TSR has been identified as an independent prognostic indicator in several cancer types, such as HCC, breast cancer, and CRC [10], [11], [28]. Although the underlying biological mechanism has yet to be elucidated, evidence that suggests the negative impact of stroma‐rich tumors on patient prognosis is mounting [9]. Recently, a meta‐analysis that reviewed 14 studies on eight different types of malignancies found that TSR was correlated with unfavorable OS (p < .001, pooled HR = 1.89; 95% CI 1.56–2.29) and disease‐free survival (p < .001, pooled HR = 2.10; 95% CI 1.67–2.63). Moreover, stroma‐rich cancer was prone to have advanced clinical stage (p = .012; pooled odds ratio [OR] = 1.68; 95% CI 1.20–2.51) and LN metastasis (p = .008; pooled OR = 1.72; 95% CI 1.16–2.55) [28]. However, in our study on ICC, TSR was not an independent prognostic factor for survival (p = .189, HR = 1.399, 95% CI 0.848–2.309 for OS; p = .488, HR = 1.160, 95% CI 0.763–1.763). This was consistent with the study of Kajiyama et al. [16]. We also reconfirmed the cutoff value of TSR via X‐tile in case that ICC might have a different optimal cutoff value for TSR because of its strong desmoplastic nature. It turns out that the optimal cutoff value of TSR remains 50%, which was in accordance with previous studies [28]. Because the literature on the correlation of TSR and prognosis of ICC was limited, we further searched similar studies in pancreatic ductal adenocarcinoma (PDAC), another malignancy featured with excessive desmoplastic reaction [12]. Intriguingly, in PDAC, studies revealing the association between the histological features of FTS and survival were plentiful, whereas prognostic significance of TSR was limited [12], [13]. In addition, 61.6% of patients (n = 95) in our study were classified as stroma‐rich, which was higher than most studies in the abovementioned meta‐analysis [28]. Presumably, for tumors with excessive desmoplastic reaction, TSR, which reflects the quantity of FTS, is insufficient to stratify prognosis; thus, the prognostic significance of quality of FTS should be explored.
We categorized FTS into three tiers (immature vs. intermediate vs. mature), as previously proposed by Ueno et al. in their study concerning rectal cancer, and found that immature FTS was an independent risk factor for both OS and RFS [14]. These findings were in line with the previous study in ICC by Shao et al., in which the CAFs were dichotomized into “immature” and “mature” phenotypes [17]. Furthermore, in two studies on PDAC, immature FTS was also found to have a negative impact on survival [12], [22]. To further investigate the underlying mechanism of our finding that immature FTS predicted poor survival, we performed IHC staining of CD3‐ and CD8‐positive TILs in TMAs. We observed that the maturity of FTS was positively correlated with both CD3+ and CD8+ TIL counts, which was consistent with previous reports on rectal cancer [14]. Because CD3+ and CD8+ TIL counts were widely validated prognostic indicators in cancer [24], we also calculated the C‐index and AIC of CD3+ and CD8+ TIL counts for a brief assessment on their predictive power in ICC. As listed in Table 3, the predictive power of CD8+ TIL counts surpassed CD3+ TIL counts with a C‐index of 0.637 (95% CI 0.576–0.697) and 0.622 (95% CI 0.563–0.680) for OS and RFS prediction, respectively. Intriguingly, the maturity of FTS remained as the variable with highest accuracy for both OS and RFS prediction in comparison with CD3+ and CD8+ TIL counts. Taken together, our findings supported the previous presumption proposed by Ueno et al. that immature FTS indicated the possibility of tumor immune escape [14]. Although the molecular mechanism that associates immature FTS to immune escape and poor survival in ICC has yet to be unraveled, from the perspective of clinical practice, the evaluation of maturity of FTS is time‐saving, affordable, and convenient.
In this study, the correlation between α‐SMA expression and maturity of FTS failed to achieve a statistical significance (p = .07). This finding was counterintuitive because, theoretically, both α‐SMA expression and maturity of FTS were biomarkers reflecting characters of fibrotic stroma. To address this issue, we reviewed relevant literature and found that discrepant results on correlation between α‐SMA expression and maturity of FTS already existed in previous studies on PDAC [12], [22]. Fokas et al. evaluated α‐SMA and FTS maturity on tissue section and reported that the correlation between α‐SMA expression and maturity of FTS was not significant (p = .370) [22]. However, Sinn et al. reported that α‐SMA expression and stroma density were strongly correlated (p = .005) based on their observations in TMAs [12]. Taken together, the confusing discrepancies may in part lie in the material, because Fokas et al. used tissue sections whereas Sinn et al. used tissue microarrays. Beyond that, it is also noteworthy that the maturity of FTS has been reported to possess higher accuracy compared with α‐SMA expression in prognosis stratification in both PDAC and ICC [12], [17], [22]. The molecular basis that supports the robust prognostic value of the maturity of FTS merits further study.
Our multivariate analyses showed that, besides the maturity of FTS, tumor multiplicity, the presence of MVI, and LN metastasis were independent risk factors for survival, which were in accordance with previously established staging systems [19], [20]. It should be noted that tumor size failed to stratify survival in this study. The controversies on the relationship between tumor size and patient prognosis in ICC have existed for a long time. Even the AJCC staging systems have changed their views toward tumor size. Tumor size of ICC was excluded in the 7th edition but was reconsidered in the 8th edition [19]. Moreover, the cutoff value of tumor size in the AJCC staging system was also different from the LCSGJ staging system [19], [20]. In our study, tumor size was analyzed dichotomized at 2 cm, 5 cm, and as continuous variable, but none of them were identified as significant prognostic indicators for survival. Several reasons may explain our findings: First, the sample size was relatively small, and all patients enrolled were eligible for surgery. Furthermore, for tumors with excessive desmoplastic reaction, tumor size may fail to reflect real tumor burden because of the interference of abundant stroma components.
Several shortcomings should be addressed: First, the study was performed in a retrospective cohort in a single institution from the People's Republic of China. Moreover, due to the limited sample size, we used 10‐fold cross‐validation instead of an external validation in another independent cohort. Therefore, external validations in a prospective cohort or in a population with different races and etiologies are warranted. Second, the study only uncovered the correlation of the maturity of fibrotic stroma and survival in ICC patients who underwent curative resection; the underlying biological mechanism and the prognostic significance of FTS in patients with different clinical stages and treatment modalities remains to be elucidated in further studies. In addition, adjuvant capecitabine has achieved a 25% risk reduction of death in a phase III study of BILCAP and is expected to be the standard adjuvant therapy for patients with biliary tract cancer [32]. The predictive accuracy of the nomogram and its ability to distinguish patients who will benefit more under this standard adjuvant chemotherapy should be further explored.
Conclusion
This study suggests that the maturity of FTS is an independent prognostic indicator in ICC patients following curative resection. Moreover, the prognostic nomogram constructed on our findings represents a more accurate predictive model relative to the AJCC 8th edition and the LCSGJ stage, which underlines the necessity of considering the characteristics of fibrotic components within tumor stroma in daily clinical practice.
See http://www.TheOncologist.com for supplemental material available online.
Acknowledgments
We thank Dr. Rong‐kui Luo in the pathology department, Zhongshan Hospital, Fudan University for detailed guidance on the evaluation of stroma maturity. This work was in part supported by the National Key Sci‐Tech Special Project of China (2012ZX10002010‐001/002); the National Natural Science Foundation of China (81302102 and 81772510); Basic Research Programs of Science and Technology Commission Foundation of Shanghai (13JC1401800, XBR2013074, 13CG04, and 16DZ0500300); and the Three‐Year Action Plan of Shanghai Municipal Commission of Health and Family Planning (ZY3‐CCCX‐3‐2004).
Contributed equally
Footnotes
For Further Reading: Talia Golan, Maria Raitses‐Gurevich, Robin K. Kelley et al. Overall Survival and Clinical Characteristics of BRCA‐Associated Cholangiocarcinoma: A Multicenter Retrospective Study. The Oncologist 2017;22:804–810.
Implications for Practice: BRCA‐associated CCA is uncommon but a very important subtype of hepatic malignancies, due to its rising prevalence. Better clinical characterization of this subtype might allow application of targeted therapy for CCA patients with germline or somatic mutations in BRCA1/2 genes, especially due to previously reported success of such therapies in other BRCA‐associated malignancies. Thus this study, first of its kind, provides a basis for future multi‐centered analyses in larger cohorts, as well as clinical trials. Additionally, this study emphasizes the importance of both germline and somatic genotyping for all CCA patients.
Contributor Information
Shuang‐Jian Qiu, Email: qiu.shuangjian@zs-hospital.sh.cn.
Bo‐Heng Zhang, Email: zhang.boheng@zs-hospital.sh.cn.
Author Contributions
Conception/design: Jian Zhou, Jia Fan, Zheng‐Gang Ren, Shuang‐Jian Qiu, Bo‐Heng Zhang
Provision of study material or patients: Shuang‐Jian Qiu, Bo‐Heng Zhang
Collection and/or assembly of data: Chu‐Yu Jing, Yong Yi, Wei Gan, Xin Xu, Jia‐Jia Lin, Su‐Su Zheng, Juan Zhang
Data analysis and interpretation: Chu‐Yu Jing, Yi‐Peng Fu, Jin‐Long Huang, Mei‐Xia Zhang, Hu‐Jia Shen
Manuscript writing: Chu‐Yu Jing, Yi‐Peng Fu, Jin‐Long Huang
Final approval of manuscript: Chu‐Yu Jing, Yi‐Peng Fu, Jin‐Long Huang, Mei‐Xia Zhang, Yong Yi, Wei Gan, Xin Xu, Hu‐Jia Shen, Jia‐Jia Lin, Su‐Su Zheng, Juan Zhang, Jian Zhou, Jia Fan, Zheng‐Gang Ren, Shuang‐Jian Qiu, Bo‐Heng Zhang
Disclosures
The authors indicated no financial relationships.
References
- 1.Khan SA, Thomas HC, Davidson BR et al. Cholangiocarcinoma. Lancet 2005;366:1303–1314. [DOI] [PubMed] [Google Scholar]
- 2.Siegel RL, Miller KD, Jemal A. Cancer Statistics, 2017. CA Cancer J Clin 2017;67:7–30. [DOI] [PubMed] [Google Scholar]
- 3.Saha SK, Zhu AX, Fuchs CS et al. Forty‐year trends in cholangiocarcinoma incidence in the U.S.: Intrahepatic disease on the rise. The Oncologist 2016;21:594–599. [DOI] [PMC free article] [PubMed] [Google Scholar]
- 4.Bridgewater J, Galle PR, Khan SA et al. Guidelines for the diagnosis and management of intrahepatic cholangiocarcinoma. J Hepatol 2014;60:1268–1289. [DOI] [PubMed] [Google Scholar]
- 5.Endo I, Gonen M, Yopp AC et al. Intrahepatic cholangiocarcinoma: Rising frequency, improved survival, and determinants of outcome after resection. Ann Surg 2008;248:84–96. [DOI] [PubMed] [Google Scholar]
- 6.de Jong MC, Nathan H, Sotiropoulos GC et al. Intrahepatic cholangiocarcinoma: An international multi‐institutional analysis of prognostic factors and lymph node assessment. J Clin Oncol 2011;29:3140–3145. [DOI] [PubMed] [Google Scholar]
- 7.Witjes CD, Karim‐Kos HE, Visser O et al. Intrahepatic cholangiocarcinoma in a low endemic area: Rising incidence and improved survival. HPB (Oxford) 2012;14:777–781. [DOI] [PMC free article] [PubMed] [Google Scholar]
- 8.Kalluri R. The biology and function of fibroblasts in cancer. Nat Rev Cancer 2016;16:582–598. [DOI] [PubMed] [Google Scholar]
- 9.Lv Z, Cai X, Weng X et al. Tumor‐stroma ratio is a prognostic factor for survival in hepatocellular carcinoma patients after liver resection or transplantation. Surgery 2015;158:142–150. [DOI] [PubMed] [Google Scholar]
- 10.Dekker TJ, van de Velde CJ, van Pelt GW et al. Prognostic significance of the tumor‐stroma ratio: Validation study in node‐negative premenopausal breast cancer patients from the EORTC perioperative chemotherapy (POP) trial (10854). Breast Cancer Res Treat 2013;139:371–379. [DOI] [PubMed] [Google Scholar]
- 11.West NP, Dattani M, McShane P et al. The proportion of tumour cells is an independent predictor for survival in colorectal cancer patients. Br J Cancer 2010;102:1519–1523. [DOI] [PMC free article] [PubMed] [Google Scholar]
- 12.Sinn M, Denkert C, Striefler JK et al. α‐Smooth muscle actin expression and desmoplastic stromal reaction in pancreatic cancer: Results from the CONKO‐001 study. Br J Cancer 2014;111:1917–1923. [DOI] [PMC free article] [PubMed] [Google Scholar]
- 13.Erkan M, Michalski CW, Rieder S et al. The activated stroma index is a novel and independent prognostic marker in pancreatic ductal adenocarcinoma. Clin Gastroenterol Hepatol 2008;6:1155–1161. [DOI] [PubMed] [Google Scholar]
- 14.Ueno H, Jones AM, Wilkinson KH et al. Histological categorisation of fibrotic cancer stroma in advanced rectal cancer. Gut 2004;53:581–586. [DOI] [PMC free article] [PubMed] [Google Scholar]
- 15.Li YW, Qiu SJ, Fan J et al. Intratumoral neutrophils: A poor prognostic factor for hepatocellular carcinoma following resection. J Hepatol 2011;54:497–505. [DOI] [PubMed] [Google Scholar]
- 16.Kajiyama K, Maeda T, Takenaka K et al. The significance of stromal desmoplasia in intrahepatic cholangiocarcinoma: A special reference of 'scirrhous‐type' and 'nonscirrhous‐type' growth. Am J Surg Pathol 1999;23:892–902. [DOI] [PubMed] [Google Scholar]
- 17.Zhang XF, Dong M, Pan YH et al. Expression pattern of cancer‐associated fibroblast and its clinical relevance in intrahepatic cholangiocarcinoma. Hum Pathol 2017;65:92–100. [DOI] [PubMed] [Google Scholar]
- 18.Johnson PJ, Berhane S, Kagebayashi C et al. Assessment of liver function in patients with hepatocellular carcinoma: A new evidence‐based approach‐the ALBI grade. J Clin Oncol 2015;33:550–558. [DOI] [PMC free article] [PubMed] [Google Scholar]
- 19.Kim Y, Moris DP, Zhang XF et al. Evaluation of the 8th edition American Joint Commission on Cancer (AJCC) staging system for patients with intrahepatic cholangiocarcinoma: A Surveillance, Epidemiology, and End Results (SEER) analysis. J Surg Oncol 2017;116:643–650. [DOI] [PubMed] [Google Scholar]
- 20.Uenishi T, Ariizumi S, Aoki T et al. Proposal of a new staging system for mass‐forming intrahepatic cholangiocarcinoma: A multicenter analysis by the Study Group for Hepatic Surgery of the Japanese Society of Hepato‐Biliary‐Pancreatic Surgery. J Hepatobiliary Pancreat Sci 2014;21:499–508. [DOI] [PubMed] [Google Scholar]
- 21.Yin X, Zheng SS, Zhang BH et al. Elevation of serum gamma‐glutamyltransferase as a predictor of aggressive tumor behaviors and unfavorable prognosis in patients with intrahepatic cholangiocarcinoma: Analysis of a large monocenter study. Eur J Gstroenterol Hepatol 2013;25:1408–1414. [DOI] [PubMed] [Google Scholar]
- 22.Wang LM, Silva MA, D'Costa Z et al. The prognostic role of desmoplastic stroma in pancreatic ductal adenocarcinoma. Oncotarget 2016;7:4183–4194. [DOI] [PMC free article] [PubMed] [Google Scholar]
- 23.Fu YP, Yi Y, Cai XY et al. Overexpression of interleukin‐35 associates with hepatocellular carcinoma aggressiveness and recurrence after curative resection. Br J Cancer 2016;114:767–776. [DOI] [PMC free article] [PubMed] [Google Scholar]
- 24.Gao Q, Qiu SJ, Fan J et al. Intratumoral balance of regulatory and cytotoxic T cells is associated with prognosis of hepatocellular carcinoma after resection. J Clin Oncol 2007;25:2586–2593. [DOI] [PubMed] [Google Scholar]
- 25.Vickers AJ, Cronin AM, Elkin EB et al. Extensions to decision curve analysis, a novel method for evaluating diagnostic tests, prediction models and molecular markers. BMC Med Inform Decis Mak 2008;8:53. [DOI] [PMC free article] [PubMed] [Google Scholar]
- 26.Jing CY, Fu YP, Shen HJ et al. Albumin to gamma‐glutamyltransferase ratio as a prognostic indicator in intrahepatic cholangiocarcinoma after curative resection. Oncotarget 2017;8:13293–13303. [DOI] [PMC free article] [PubMed] [Google Scholar]
- 27.Camp RL, Dolled‐ Filhart M, Rimm DL. X‐tile: A new bio‐informatics tool for biomarker assessment and outcome‐based cut‐point optimization. Clin Cancer Res 2004;10:7252–7259. [DOI] [PubMed] [Google Scholar]
- 28.Wu J, Liang C, Chen M et al. Association between tumor‐stroma ratio and prognosis in solid tumor patients: A systematic review and meta‐analysis. Oncotarget 2016;7:68954–68965. [DOI] [PMC free article] [PubMed] [Google Scholar]
- 29.Liang H, Zou G. Improved AIC selection strategy for survival analysis. Comput Stat Data Anal 2008;52:2538–2548. [DOI] [PMC free article] [PubMed] [Google Scholar]
- 30.Wang Y, Li J, Xia Y et al. Prognostic nomogram for intrahepatic cholangiocarcinoma after partial hepatectomy. J Clin Oncol 2013;31:1188–1195. [DOI] [PubMed] [Google Scholar]
- 31.Vickers AJ, Elkin EB. Decision curve analysis: A novel method for evaluating prediction models. Med Decis Making 2006;26:565–574. [DOI] [PMC free article] [PubMed] [Google Scholar]
- 32.Capecitabine extends survival for biliary tract cancer. Cancer Discov 2017;7:OF1. [DOI] [PubMed] [Google Scholar]


