

Abstract
Background
Prevention of bacterial STIs among men who have sex with men (MSM) requires timely disease detection, but this is complicated by asymptomatic infection. We estimated screening/testing rates by symptomatic status to evaluate adherence to CDC STI screening guidelines.
Methods
In a cross-sectional study of 2572 US MSM aged 15–65 in 2017–2018, we measured the reported number of asymptomatic STI screens in the past 2 years versus tests prompted by disease symptoms. Using negative binominal regression within a hierarchical Bayesian framework, we estimated yearly rates of asymptomatic screening and symptomatic testing by geographic, demographic, and behavioral factors.
Results
HIV status was most strongly associated with all testing/screening frequency (Incidence Rate Ratio [IRR]=1.72; 95% credible interval [Cr1] = 1.49, 1.97). HIV-uninfected MSM had 0.14 (95% CrI = 0.12, 0.17) symptomatic tests and 0.88 (95% CrI = 0.77, 1.01) asymptomatic screens per year. HIV-infected MSM had 0.25 (95% CrI = 0.18, 0.35) symptomatic tests and 1.53 (95% CrI = 1.24, 1.88) asymptomatic screens per year. Rates of asymptomatic screening were higher among black compared to white MSM (IRR = 1.41; 95% CrI = 1.15, 1.73), but weakly associated with number of past-year sexual partners (IRR = 1.01; 95% CrI = 1.00, 1.01). Overall, 85–90% of diagnostic events were asymptomatic screens.
Conclusions
Self-reported rates of STI screening were close to CDC’s recommended overall annual screening frequency, but with gaps defined by demographics and behavioral risk. Targeted screening efforts may be indicated specifically for younger MSM and those with multiple partners.
Keywords: Men who have sex with men, Sexually transmitted infection, Screening, Testing, Symptoms
INTRODUCTION
Sexually transmitted infections (STIs) present a growing public health threat in the United States at both national and local levels.1 Incidence rates of infection with three major bacterial pathogens (Neisseria gonorrhoeae [NG], Chlamydia trachomatis [CT], and Treponema pallidum [syphilis]) have increased over the past decade.2 These STIs lead to disease complications,3 and also raise the risk of HIV acquisition.4 STI prevention depends on timely disease diagnosis coupled with highly effective antibiotic treatment.5 For men who have sex with men (MSM), however, many infections remain asymptomatic when they occur at rectal or pharyngeal sites,6 presenting challenges for timely diagnosis. Even when screening efforts are successful in detecting asymptomatic infections, MSM in highly connected sexual networks may become repeatedly reinfected by partners who remain untreated.7
Durable STI control through treatment therefore depends on achieving a high coverage of routine screening at an optimal temporal interval. The US Centers for Disease Control and Prevention (CDC) recommends MSM be screened for bacterial STIs at the sites of sexual exposure at least annually, with more frequent screening indicated for high-risk men.5 Few studies of MSM have estimated screening rates (the reciprocal of intervals) for bacterial STIs,8 and fewer have stratified results by the symptomatic status during those clinical encounters.6,9 A common approach is to present period prevalence measures, such as ever testing in the past year.10 But this type of measure differentiates neither whether testing occurs more frequently than the queried period (e.g., 3 times a year), nor just outside the period (e.g., every 13 months). These measures also conflate clinical encounters related to STI testing (a response to symptomatic infection) and STI screening (a routine health regime not prompted by disease).11
Understanding how frequently bacterial STI screening occurs is critical to evaluate adherence to CDC guidelines across key demographic and behavioral strata. Estimates of screening rates are also greatly needed to parameterize mathematical modeling studies that explicitly represent these disease dynamics.12 Such studies, paired with empirical research, may be used to investigate whether existing screening guidelines and interventions are sufficient for population-level disease control given rising STI incidence.
In this study, we estimated bacterial STI screening rates by symptomatic status for MSM in the United States during 2017–2018. We adopted a descriptive analytic strategy under a hierarchical Bayesian modeling framework that improves the interpretability and precision of our results. Our goal was to identify rates and predictors of all testing/screening events compared with asymptomatic screening and symptomatic testing separately in order to support future public health policy evaluation and mathematical modeling research.
METHODS
Study Design.
ART-Net was a study of 2572 sexually active MSM across the United States conducted in 2017–2018. We recruited MSM who had completed the web-based American Men’s Internet Survey (AMIS). Recruitment for AMIS, described previously,13 involved inviting men through banner ads placed on websites or social networking applications to participate in a study of men’s health. Eligibility criteria for ART-Net included male sex at birth and current male gender identity, lifetime history of sexual activity with another man, and age between 15 and 65. Eligible men completing AMIS were invited to participate in ART-Net, which collected more detailed questions about sexual networks and HIV/STI prevention services.
Measures.
This analysis features ART-Net survey questions on frequency of STI testing versus screening in the two years prior to the study. Total tests/screens were based on the question: “In the past 2 years (since [calculated date]), how many times have you been tested for any sexually transmitted diseases (STDs)? STDs could include gonorrhea, chlamydia, and syphilis (but not HIV).” We then asked of tests prompted by symptomatic infections: “Of those [total test number] tests in the past 2 years, how many did you get because you experienced some potential symptoms of an STD, such as discharge from your penis, swelling of your genitals, or a sore or rash on your genitals or anus/butt?” We calculated the count of asymptomatic screening by subtracting the count of symptomatic tests from the total tests/screens. We therefore assumed that all clinical encounters not driven by disease symptoms were related to screening; this may also include public health interventions such as partner notification.
Other variables in this analysis were geography, race/ethnicity, age, reported HIV status, and number of past-year oral/anal sex partners. Geography was defined by zip code, which we classified into one of 15 key-priority cities, then for men living outside of those cities, census division (definitions in Table S1 [Appendix]). This resulted in a 24-level geographic stratification used in our hierarchical models.
Statistical Analysis.
We employed a hierarchical Bayesian modeling framework in which individuals were nested within their geographic units. Models specified hyper-parameters controlling the distribution of coefficient values across geography. Weakly informative prior distributions were placed on all model parameters. Models were fit with the STAN statistical software,14 which uses Hamiltonian Markov Chain Monte Carlo (MCMC) methods to estimate model coefficients.15 Results shown here are fully reproducible: alternative summary statistics, uncertainty bounds, and model specifications may be estimated with the original source data, MCMC chains, and R scripts provided in our study repository [https://github.com/EpiModel/STI-Testing-Rates].
Outcomes were numbers of all tests/screens, symptomatic tests, or asymptomatic screens per year. Given the over-dispersion of our rate data, we employed negative binomial likelihoods. Three sets of models were fit to estimate screening rates in different ways. First, we fit a hierarchical model of the three rates, with intercepts varying by geographic unit. Race/ethnicity, age, HIV status, and partner number were individual-level predictors. Second, we used a varying-intercept, varying-slope interaction model with geographic unit as the grouping variable and HIV status as the individual-level predictor to estimate the rates of testing or screening by HIV status. Per-year predictions were calculated by exponentiation of the linear predictors (minus the log of 2 to transform into yearly rates). Third, we fit a single-level model (data pooled across geography) to estimate the yearly rates by age, which was modeled in quadratic form to account for non-linearity. Additionally, we estimated the probability of never-testing/screening over the past two years using logistic regression. This was also a hierarchical varying-intercept model with geography-specific intercepts. For all models, we present point estimates (medians) and 95% credible intervals (CrI) of the posterior distributions to summarize predicted distributions.
To allow for calculation of estimated marginal rates and probabilities from the models with different covariate combinations of interest, we built a web app to allow for exploration and visualization of these outcomes. The app is available at https://epimodel.shinyapps.io/sti-screen/ and it includes instructions on its use.
RESULTS
Table 1 presents descriptive statistics of the study sample (n = 2572) by geography, race/ethnicity, age, self-reported HIV status, and number of oral/anal sexual partners. Participants were concentrated within the 15 key-priority cities. Figure S1 (Appendix) maps the geographic sample coverage. MSM were mostly white (non-Hispanic) race/ethnicity, and uninfected with HIV. The mean number of past-year oral/anal sex partners was 11.8, but there was substantial skew in the distribution. Averaged across covariates, the mean rates of all screening/testing were 1.11 per year (95% CrI = 1.08, 1.14), with symptomatic testing at 0.16 (95% CrI = 0.15, 0.17) and asymptomatic screening at 0.95 (95% CrI = 0.93, 0.98). In the prior two years, 33.4% (95% CrI = 31.6%, 35.3%) of MSM had no tests or screens, 80.8% (95% CrI = 79.3%, 82.3%) had no symptomatic tests and 39.3% (95% CrI = 37.5%, 41.2%) had no asymptomatic screens.
Table 1.
Descriptive Statistics of 2017-2018 ART-Net Sample of Men Who Have Sex with Men in the United States (n = 2572)
| n | % | |
|---|---|---|
| Geography | ||
| City | ||
| Atlanta | 146 | 5.7 |
| Boston | 72 | 2.8 |
| Chicago | 130 | 5.1 |
| Dallas | 86 | 3.3 |
| Denver | 41 | 1.6 |
| Detroit | 43 | 1.7 |
| Houston | 78 | 3.0 |
| Los Angeles | 140 | 5.4 |
| Miami | 66 | 2.6 |
| New York City | 228 | 8.9 |
| Philadelphia | 82 | 3.2 |
| San Diego | 52 | 2.0 |
| San Francisco | 94 | 3.7 |
| Seattle | 81 | 3.1 |
| Washington DC | 128 | 5.0 |
| Census Division (Outside Cities) | ||
| 1 New England | 60 | 2.3 |
| 2 Middle Atlantic | 83 | 3.2 |
| 3 East North Central | 157 | 6.1 |
| 4 West North Central | 108 | 4.2 |
| 5 South Atlantic | 236 | 9.2 |
| 6 East South Central | 88 | 3.4 |
| 7 West South Central | 116 | 4.5 |
| 8 Mountain | 123 | 4.8 |
| 9 Pacific | 134 | 5.2 |
| Race/Ethnicity | ||
| Black (Non-Hisp) | 163 | 6.3 |
| Hispanic | 371 | 14.4 |
| Other (Non-Hisp) | 245 | 9.5 |
| White (Non-Hisp) | 1793 | 69.7 |
| Age | ||
| mean, median, std dev | 39.2, 37, 14.3 | |
| HIV Status (Self-Reported) | ||
| Uninfected | 2283 | 88.8 |
| Infected | 289 | 11.2 |
| Number of Oral/Anal Sex Partners | ||
| mean, median, std dev | 11.8, 5, 19.1 | |
Table 2 shows the results of the first model for yearly testing/screening, symptomatic testing, and asymptomatic screening. Non-white MSM tested at higher rates than whites, with black MSM testing 40% more frequently (incidence rate ratio [IRR] = 1.40; 95% CrI = 1.17, 1.68) than whites. Age was associated with more frequent testing, but the negative coefficient on the quadratic term indicates a positive parabolic relationship. HIV-infected MSM tested nearly twice as frequently (IRR = 1.72; 95% CrI = 1.49, 1.97) compared to HIV-uninfected MSM. Partner number was also associated with testing/screening frequency, but minimally: a 1.4% relative increase in test/screen rates and a 1.1% increase in asymptomatic screening rates for each additional past-year partner.
Table 2.
Predictors of All Bacterial STI (Syphilis, Gonorrhea, Chlamydia) Testing/Screening Rates by Symptomatic Status among US Men Who Have Sex with Men
| All Testing/Screening | Symptomatic Testing | Asymptomatic Screening | ||||
|---|---|---|---|---|---|---|
| IRR1 | 95% CrI2 | IRR1 | 95% CrI2 | IRR1 | 95% CrI2 | |
| Race | ||||||
| Black (Non-Hisp) | 1.40 | 1.17, 1.68 | 1.40 | 0.96, 2.02 | 1.410 | 1.15, 1.74 |
| Hispanic | 1.13 | 0.99, 1.30 | 1.33 | 1.02, 1.74 | 1.090 | 0.94, 1.27 |
| Other (Non-Hisp) | 1.17 | 1.00, 1.36 | 1.07 | 0.77, 1.51 | 1.190 | 1.00, 1.42 |
| White (Non-Hisp) | Ref | - | Ref | - | Ref | - |
| Age | ||||||
| Linear | 1.07 | 1.04, 1.09 | 1.04 | 0.99, 1.09 | 1.06 | 1.04, 1.09 |
| Quadratic | 0.9991 | 0.9988, 0.9993 | 0.9992 | 0.9986, 0.9998 | 0.9991 | 0.9988, 0.9994 |
| HIV status | ||||||
| Uninfected | Ref | - | Ref | - | Ref | - |
| Infected | 1.72 | 1.49, 1.97 | 1.90 | 1.44, 2.51 | 1.72 | 1.47, 2.02 |
| Number of Partners | ||||||
| Linear | 1.014 | 1.011, 1.016 | 1.027 | 1.022, 1.032 | 1.011 | 1.008, 1.014 |
IRR = Incidence Rate Ratio;
CrI = Credible Interval
Table S2 [Appendix] provides raw model coefficients for calculating testing/screening rates for covariate combinations of interest, and the web app [https://epimodel.shinyapps.io/sti-screen/] performs these computations. Consistent with the covariate-averaged descriptive statistics above, estimated yearly asymptomatic screening rates from this model were much higher than symptomatic testing rates. As an example, the estimated rate of symptomatic testing among MSM across geographic units (average intercept) of black race/ethnicity, age 30, HIV-uninfected status, and who had 3 partners was 0.16 (95% CrI = 0.11, 0.23). The rate of asymptomatic screening for the same group was 1.21 (95% CrI = 0.99, 1.50). Expressed as a proportional distribution, asymptomatic screening comprised 88% of all tests/screens each year for those MSM.
Figure 1 shows the asymptomatic screening rate estimates from the varying-slope, varying-intercept interaction model. Table S3 [Appendix] provides these estimated rates numerically. The predicted rates for HIV-uninfected MSM averaged 0.88 screens per year, with the highest mean in San Francisco (1.17 screens/year) and lowest in Houston (0.69 screens/year). Mean screening rates were higher for HIV-infected MSM, although with greater uncertainty in the estimates due to smaller sample sizes. HIV-infected MSM screening rates ranged from 1.14 screens/year in Houston to 2.02 screens/year in San Francisco.
Figure 1.
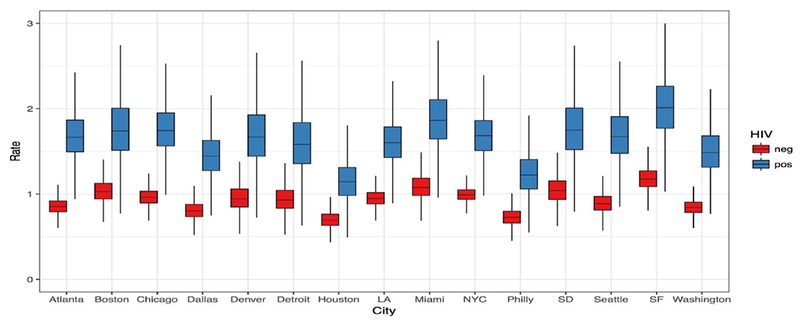
Per-Year Rate of Asymptomatic STI Screening by City of Residence and Self-Reported HIV Status, among Men Who Have Sex with Men in the United States, from a Varying Intercept/Varying Slope Hierarchical Negative Binomial Bayesian Regression Model. LA = Los Angeles; NYC = New York City; SD = San Diego; SF = San Francisco.
Figure 2 shows the individual-level regression for each testing/screening outcome with the main predictor of age (quadratic), averaging over other covariates. Overall testing/screening was dominated by asymptomatic screening across all ages. The rates for all testing/screening followed a parabolic relationship, with rates peaking at 1.21 tests/year at age 37. The parabolic relationship is also present for symptomatic testing, but not as strongly.
Figure 2.
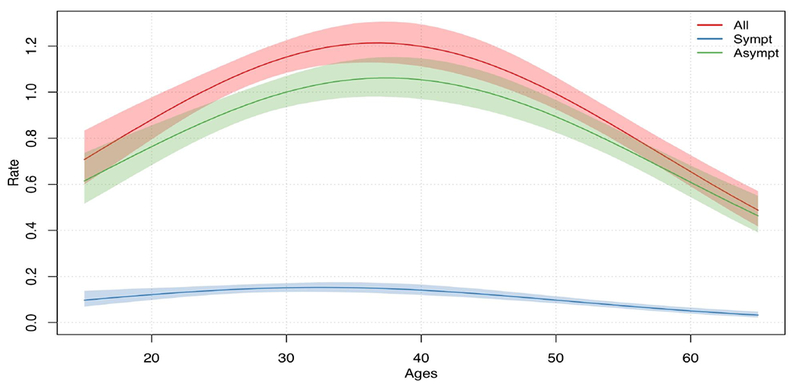
Per-Year Rate of All Testing, Symptomatic Testing, and Asymptomatic Screening by Age, among Men Who Have Sex with Men in the United States, from a Single-Level Negative Binomial Bayesian Regression Model.
Table 3 presents the predictors of never testing or screening in the past 2 years from the hierarchical varying-intercept logistic regression model. These results generally complement the testing/screening rates in Table 2, with the likelihood of never testing/screening to be substantially lower for MSM who were black (OR = 0.36; 95% CrI = 0.22, 0.56) or HIV-infected (OR = 0.32; 95% CrI = 0.23, 0.45). Age was also associated with lower odds of testing and screening, and there was a small negative association by partner number.
Table 3.
Predictors of Never Testing/Screening for All Bacterial STI (Syphilis, Gonorrhea, Chlamydia) in the Past 2 Years by Symptomatic Status among US Men Who Have Sex with Men
| All Testing/Screening | Symptomatic Testing | Asymptomatic Screening | ||||
|---|---|---|---|---|---|---|
| OR1 | 95% CrI2 | OR1 | 95% CrI2 | OR1 | 95% CrI2 | |
| Race | ||||||
| Black (Non-Hisp) | 0.36 | 0.22, 0.56 | 0.690 | 0.47, 1.04 | 0.450 | 0.30, 0.66 |
| Hispanic | 0.91 | 0.70, 1.18 | 0.870 | 0.65, 1.15 | 1.070 | 0.84, 1.37 |
| Other (Non-Hisp) | 1.15 | 0.86, 1.54 | 1.150 | 0.80, 1.66 | 1.090 | 0.82, 1.45 |
| White (Non-Hisp) | Ref | - | Ref | - | Ref | - |
| Age | ||||||
| Linear | 0.90 | 0.87, 0.94 | 0.970 | 0.92, 1.01 | 0.920 | 0.89, 0.96 |
| Quadratic | 1.0014 | 1.0010, 1.0019 | 1.0008 | 1.0002, 1.0014 | 1.0011 | 1.0007, 1.0016 |
| HIV status | ||||||
| Uninfected | Ref | - | Ref | - | Ref | - |
| Infected | 0.32 | 0.23, 0.45 | 0.570 | 0.42, 0.78 | 0.410 | 0.30, 0.56 |
| Number of Partners | ||||||
| Linear | 0.980 | 0.973, 0.986 | 0.977 | 0.972, 0.981 | 0.992 | 0.987, 0.996 |
OR = Odds Ratio;
CrI = Credible Interval
Similar to Table S2, Table S4 [Appendix] provides raw model coefficients for calculating marginal probabilities of never testing/screening across covariate combinations, and these calculations with uncertainty intervals are also performed by the web app. For the example MSM group defined above, the probability of never having symptomatic test were 76.1% (95% CrI = 68.4%, 82.6%) and the probability of never having an asymptomatic screen were 21.2% (95% CrI = 14.9%, 28.5%).
Corresponding to the distribution of symptomatic tests versus asymptomatic screens, the probabilities for never (symptomatic) testing are higher than the probabilities of never (asymptomatic) screening. Because never-testing could be interpreted as a relatively persistent individual-level attribute, we reestimated the primary rate-based regression models but excluding those who had never screened. Table S5 [Appendix] provides estimates for these “zero-truncated” rates for all testing/screening and asymptomatic screening after excluding those never testers.
DISCUSSION
In this study, we found that most STI-related clinical encounters were due to asymptomatic screening versus symptoms-driven testing. Overall, average screening rates nearly met the CDC recommendations of yearly screening for MSM. However, there was significant heterogeneity in estimated rates by geography and demographics. Critically, there was an insubstantial increase in screening for higher-risk men, who are recommended to screen more frequently than annually. MSM with multiple partners and younger MSM in particular are screened less frequently than recommended, suggesting a need for screening efforts to be targeted towards these groups.
Clinical encounters for bacterial STI testing/screening among MSM have been frequently estimated. The National HIV Behavioral Surveillance (NHBS) system has yielded prevalence estimates of past-year STI testing/screening: one analysis reported that that 47% of men had a NG or CT test in 2014,16 and another reported that 49% of men had a syphilis test that same year.17 HIV status was strongly associated with testing there, similar to our findings, and other previous studies.18 An analysis of the STD Surveillance Network surveillance system of public STD clinics evaluated NG/CT testing by anatomical site of exposure, finding much higher prevalence of screening at urogenital sites compared to rectal exposure sites.10 Those differences are likely driven by testing persons with symptomatic infections more common at urogenital sites, but it was unclear. These studies have provided valuable information on overall diagnostic encounters, but also generate further questions about why those encounters are occurring. It is critical for future research studies to disaggregate the clinical encounters by symptomatic status.
Several studies have suggested that MSM are not screening for bacterial STIs as frequently as recommended. This has been quantified by HIV status,19 health insurance status,20 race/ethnicity,21 and participation in HIV prevention programs.22 However, most of these studies quantify gaps in testing using period prevalence measures rather than rate-based measures. This is problematic because often the queried interval does not correspond to recommended intervals, particularly when there is variation in those recommendations. In the US, the CDC guidelines suggest screening more frequently for MSM than once a year who are at increased behavioral risk or have a prior history of diagnosed STIs.5 What constitutes increased behavioral risk is left broadly defined to allow for interpretation within the local epidemiological context. Because there may be several different optimal screening intervals for MSM based on risk categorization, a continuous rate-based measure provides greater flexibility to support public health policy evaluation.
We found that MSM across all covariates had, on average, 0.95 asymptomatic screens per year (or screening every 12.6 months), slightly less than the recommended annual screening. This suggests that only a modest improvement would be needed to fully meet the guidelines. However, behavioral risk had only a very modest impact on rates of testing or screening, with each additional partner associated with a 1.1% increase in the frequency of screening. CDC guidelines suggest at least a 2–4-fold increase in the screening frequency for men at increased risk of STIs, with greater partner numbers and non-monogamous partnerships previously found to be correlated to STI risk.7,23 Therefore, while the overall screening rates may suggest broad adherence to CDC recommendations, screening rates for this higher risk subgroup require substantial improvement.
Our other stratified results may have additional implications for STI prevention policy and clinical practice. First, we observed geographic variation in the rates of screening. Higher rates were observed in cities like San Francisco, which has long had a robust STD testing and treatment response.24 Lower rates in other cities may provide impetus for prioritization of STI screening, particularly in areas such as Atlanta with higher background incidence of STIs.25 Second, black MSM reported consistently higher screening rates than white MSM. It has been hypothesized that lack of engagement in STI care, particularly for timely detection of asymptomatic infections, could play a critical role in the HIV disparities by race/ethnicity.26 However, our study provides no evidence of suboptimal STI screening for black MSM; other HIV risk factors such as engagement in HIV care and sexual network structure may play a larger role.27–29 Finally, we found a parabolic relationship between screening rates and age, where frequencies were highest for MSM of middle age and lowest among adolescent and young adult MSM. This highlights the critical importance of engaging young MSM in STI clinical care.30
One limitation of this study is that we did not query on the physical site of screening (i.e., the urethra, rectum, or pharynx). Prior studies have suggested under-screening of infections at non-urethral sites where asymptomatic infection is often harbored.6 Testing rates by specific diseases were also not available, but CDC guidance recommends screening for all three major bacterial STIs infections for sexually active MSM. Respondents may have interpreted our survey question as inclusive of other (non-bacterial) STIs. Additionally, these outcomes were based on self-report, and therefore subject to recall bias that may be differential by disease risk if those diagnosed with an STI are more likely to recall clinical encounters. We also implicitly assumed that each test/screen represented a distinct clinical visit, and that each visit was prompted by disease symptoms (or not). Although this simplifies some clinical presentations (multiple diseases screened at multiple sites in a single visit), accurately measuring the complexities of ongoing STI care remains challenging for cross-sectional study designs. Given these combined factors, our results may therefore represent a conservative (low) estimate of required screening coverage across all sites and all diseases.
Other limitations were that we used a convenience sample of web-recruited MSM who volunteered to participate in order to infer about the STI testing behavior of MSM more broadly in the United States. This sample is likely not representative of that broader target population; no fully representative sampling frame of MSM exists in the United States. In lieu of weighting the study data to account for selection biases, we instead have opted to present all model coefficients such that stratified analyses based on factors believed to be related to biases may be directly adjusted. The testing/screening rates observed here may also be a function of the underlying STI incidence in our target population; this may partially account for the geographic variations in screening as there is significant regional variation in disease burden.1 Finally, we did not have data to differentiate the temporality of STI screening against HIV status, and the higher screening rates for some HIV-infected men may have preceded their HIV diagnoses.
In conclusion, despite overall optimistic estimates of adherence to CDC recommendations for annual STI screening among MSM, we identified key demographic and behavioral gaps in screening using a more precise rate-based measure of clinical encounters stratified by symptomatic status of infection. These new findings may support the development of STI prevention strategies to that target screening by geography, demographics, and behavioral risk. Future research studies may also benefit from incorporating these new estimates in building mathematical models that evaluate whether these current observed screening rates are sufficient to meet the objectives of bacterial STI disease control in the context of rising STI incidence.
Supplementary Material
Acknowledgments
CONFLICTS OF INTEREST AND SOURCE OF FUNDING
This study was supported by the National Institutes of Health [R21 MH112449], the Center for AIDS Research at Emory [NIH grant: P30 AI050409], and a grant from the MAC AIDS Fund. The authors declare no conflicts of interest.
REFERENCES
- 1.de Voux A, Kidd S, Grey JA, Rosenberg ES, Gift TL, Weinstock H, et al. State-Specific Rates of Primary and Secondary Syphilis Among Men Who Have Sex with Men — United States, 2015. MMWR Morb Mortal Wkly Rep 2017;66(13):349–54. [DOI] [PMC free article] [PubMed] [Google Scholar]
- 2.Barton J, Braxton J, Davis D, Voux A de, Flagg E. Sexually transmitted disease surveillance 2015. 2016;Available at: https://stacks.cdc.gov/view/cdc/4180.
- 3.Centers for Disease C, Prevention. Symptomatic early neurosyphilis among HIV-positive men who have sex with men--four cities, United States, January 2002-June 2004. MMWR Morb Mortal Wkly Rep 2007;56(25):625–8. [PMC free article] [PubMed] [Google Scholar]
- 4.Bernstein KT, Marcus JL, Nieri G, Philip SS, Klausner JD. Rectal gonorrhea and chlamydia reinfection is associated with increased risk of HIV seroconversion. J Acquir Immune Defic Syndr 2010;53(4):537–43. [DOI] [PubMed] [Google Scholar]
- 5.Workowski KA, Bolan GA, Centers for Disease Control and Prevention. Sexually transmitted diseases treatment guidelines, 2015. MMWR Morb Mortal Wkly Rep 2015;64(RR-03): 1–137. [PMC free article] [PubMed] [Google Scholar]
- 6.Kent CK, Chaw JK, Wong W, Liska S, Gibson S, Hubbard G, et al. Prevalence of rectal, urethral, and pharyngeal chlamydia and gonorrhea detected in 2 clinical settings among men who have sex with men: San Francisco, California, 2003. Clin Infect Dis 2005;41(1):67–74. [DOI] [PubMed] [Google Scholar]
- 7.Spicknall IH, Gift TL, Bernstein KT, Aral SO. Sexual networks and infection transmission networks among men who have sex with men as causes of disparity and targets of prevention. Sex Transm Infect 2017;93(5):307–8. [DOI] [PubMed] [Google Scholar]
- 8.Guy R, Goller JL, Spelman T, El-Hayek C, Gold J, Lim M, et al. Does the frequency of HIV and STI testing among men who have sex with men in primary care adhere with Australian guidelines? Sex Transm Infect 2010;86(5):371–6. [DOI] [PubMed] [Google Scholar]
- 9.Rieg G, Lewis RJ, Miller LG, Witt MD, Guerrero M, Daar ES. Asymptomatic sexually transmitted infections in HIV-infected men who have sex with men: prevalence, incidence, predictors, and screening strategies. AIDS Patient Care STDS. 2008;22(12):947–54. [DOI] [PMC free article] [PubMed] [Google Scholar]
- 10.Patton ME, Kidd S, Llata E, Stenger M, Braxton J, Asbel L, et al. Extragenital gonorrhea and chlamydia testing and infection among men who have sex with men--STD Surveillance Network, United States, 2010-2012. Clin Infect Dis 2014;58(11):1564–70. [DOI] [PMC free article] [PubMed] [Google Scholar]
- 11.Farley TA, Cohen DA, Elkins W. Asymptomatic sexually transmitted diseases: the case for screening. Prev Med 2003;36(4):502–9. [DOI] [PubMed] [Google Scholar]
- 12.Jenness SM, Weiss KM, Goodreau SM, Gift T, Chesson H, Hoover KW, et al. Incidence of gonorrhea and chlamydia following human immunodeficiency virus preexposure prophylaxis among men who have sex with men: A modeling study. Clin Infect Dis 2017;65(5):712–8. [DOI] [PMC free article] [PubMed] [Google Scholar]
- 13.Sanchez TH, Sineath RC, Kahle EM, Tregear SJ, Sullivan PS. The Annual American Men’s Internet Survey of Behaviors of Men Who Have Sex With Men in the United States: Protocol and Key Indicators Report 2013. JMIR Public Heal Surveill 2015;1(1):e3. [DOI] [PMC free article] [PubMed] [Google Scholar]
- 14.Gelman A, Lee D, Stan Guo J.. J Educ Behav Stat 2015;40(5):530–43. [Google Scholar]
- 15.Hoffman MD, Gelman A. The No-U-Tum Sampler: Adaptively Setting Path Lengths in Hamiltonian Monte Carlo. J Mach Learn Res 2014; 15( 1): 1593–623. [Google Scholar]
- 16.Hoots BE, Torrone EA, Bernstein KT, Paz-Bailey G, NHBS Study Group. Self-reported chlamydia and gonorrhea testing and diagnosis among men who have sex with men 20 U.S. cities, 2011 and 2014. Sex Transm Dis 2018;45(7):469–75. [DOI] [PMC free article] [PubMed] [Google Scholar]
- 17.An Q, Wejnert C, Bernstein K, Paz-Bailey G, NHBS Study Group. Syphilis Screening and Diagnosis Among Men Who Have Sex With Men, 2008-2014, 20 U.S. Cities. J Acquir Immune Defic Syndr 2017;75(Suppl 3):S363–9. [DOI] [PubMed] [Google Scholar]
- 18.Dean BB, Scott M, Hart R, Battalora L, Novak RM, Durham MD, et al. Sexually Transmitted Disease Testing of Human Immunodeficiency Virus-Infected Men Who Have Sex With Men. Sex Transm Dis 2017;44(11):678–84. [DOI] [PubMed] [Google Scholar]
- 19.Berry SA, Ghanem KG, Mathews WC, Korthuis PT, Yehia BR, Agwu AL, et al. Brief Report: Gonorrhea and Chlamydia Testing Increasing but Still Lagging in HIV Clinics in the United States. J Acquir Immune Defic Syndr 2015;70(3):275–9. [DOI] [PMC free article] [PubMed] [Google Scholar]
- 20.Landovitz RJ, Gildner JL, Leibowitz AA. Sexually Transmitted Infection Testing of HIV-Positive Medicare and Medicaid Enrollees Falls Short of Guidelines. Sex Transm Dis 2017;45(1):8–13. [DOI] [PMC free article] [PubMed] [Google Scholar]
- 21.Sullivan PS, Peterson J, Rosenberg ES, Kelley CF, Cooper H, Vaughan A, et al. Understanding racial HIV/STI disparities in black and white men who have sex with men: a multilevel approach. PLoS One. 2014;9(3):e90514. [DOI] [PMC free article] [PubMed] [Google Scholar]
- 22.Nguyen V- K, Greenwald ZR, Trottier H, Cadieux M, Goyette A, Beauchemin M, et al. Incidence of sexually transmitted infections before and after Pre-Exposure Prophylaxis for HIV. AIDS. 2018;32(4):523–30. [DOI] [PMC free article] [PubMed] [Google Scholar]
- 23.Glick SN, Morris M, Foxman B, Aral SO, Manhart LE, Holmes KK, et al. A Comparison of Sexual Behavior Patterns Among Men Who Have Sex With Men and Heterosexual Men and Women. J Acquir Immune Defic Syndr 2012;60(1):83–90. [DOI] [PMC free article] [PubMed] [Google Scholar]
- 24.Klausner JD, Kent CK, Wong W, McCright J, Katz MH. The public health response to epidemic syphilis, San Francisco, 1999-2004. Sex Transm Dis 2005;32(10 Suppl):S11–8. [DOI] [PubMed] [Google Scholar]
- 25.Kelley CF, Vaughan AS, Luisi N, Sanchez TH, Salazar LF, Frew PM, et al. The Effect of High Rates of Bacterial Sexually Transmitted Infections on HIV Incidence in a Cohort of Black and White Men Who Have Sex with Men in Atlanta, Georgia. AIDS Res Hum Retroviruses. 2015;31(6):587–92. [DOI] [PMC free article] [PubMed] [Google Scholar]
- 26.Millett GA, Peterson JL, Wolitski RJ, Stall R. Greater risk for HIV infection of black men who have sex with men: a critical literature review. Am J Public Heal 2006;96(6):1007–19. [DOI] [PMC free article] [PubMed] [Google Scholar]
- 27.Goodreau SM, Rosenberg ES, Jenness SM, Luisi N, Stansfield SE, Millett GA, et al. Sources of racial disparities in HIV prevalence in men who have sex with men in Atlanta, GA, USA: a modelling study. Lancet HIV. 2017;4(7):e311–20. [DOI] [PMC free article] [PubMed] [Google Scholar]
- 28.Neaigus A, Reilly KH, Jenness SM, Wendel T, Marshall DM, Hagan H. Multilevel risk factors for greater HIV infection of black men who have sex with men in New York City. Sex Transm Dis 2014;41(7):433–9. [DOI] [PMC free article] [PubMed] [Google Scholar]
- 29.Reilly KH, Neaigus A, Jenness SM, Wendel T, Marshall DM, Hagan H. Factors associated with recent HIV testing among men who have sex with men in New York City. AIDS Behav 2014;18(3):297–304. [DOI] [PMC free article] [PubMed] [Google Scholar]
- 30.Bauermeister JA, Pingel ES, Jadwin-Cakmak L, Harper GW, Horvath K, Weiss G, et al. Acceptability and Preliminary Efficacy of a Tailored Online HIV/STI Testing Intervention for Young Men who have Sex with Men: The Get Connected! Program. AIDS Behav 2015; 19(10): 1860–74. [DOI] [PMC free article] [PubMed] [Google Scholar]
Associated Data
This section collects any data citations, data availability statements, or supplementary materials included in this article.