

Abstract
Key points
This study characterizes the mechanisms underlying defects in synaptic transmission when dynamin‐related protein 1 (DRP1) is genetically eliminated. Viral‐mediated knockout of DRP1 from the presynaptic terminal at the mouse calyx of Held increased initial release probability, reduced the size of the synaptic vesicle recycling pool and impaired synaptic vesicle recycling.
Transmission defects could be partially restored by increasing the intracellular calcium buffering capacity with EGTA‐AM, implying close coupling of Ca2+ channels to synaptic vesicles was compromised.
Acute restoration of ATP to physiological levels in the presynaptic terminal did not reverse the synaptic defects.
Loss of DRP1 impairs mitochondrial morphology in the presynaptic terminal, which in turn seems to arrest synaptic maturation.
Abstract
Impaired mitochondrial biogenesis and function is implicated in many neurodegenerative diseases, and likely affects synaptic neurotransmission prior to cellular loss. Dynamin‐related protein 1 (DRP1) is essential for mitochondrial fission and is disrupted in neurodegenerative disease. In this study, we used the mouse calyx of Held synapse as a model to investigate the impact of presynaptic DRP1 loss on synaptic vesicle (SV) recycling and sustained neurotransmission. In vivo viral expression of Cre recombinase in ventral cochlear neurons of floxed‐DRP1 mice generated a presynaptic‐specific DRP1 knockout (DRP1‐preKO), where the innervated postsynaptic cell was unperturbed. Confocal reconstruction of the calyx terminal suggested SV clusters and mitochondrial content were disrupted, and presynaptic terminal volume was decreased. Using postsynaptic voltage‐clamp recordings, we found that DRP1‐preKO synapses had larger evoked responses at low frequency stimulation. DRP1‐preKO synapses also had profoundly altered short‐term plasticity, due to defects in SV recycling. Readily releasable pool size, estimated with high‐frequency trains, was dramatically reduced in DRP1‐preKO synapses, suggesting an important role for DRP1 in maintenance of release‐competent SVs at the presynaptic terminal. Presynaptic Ca2+ accumulation in the terminal was also enhanced in DRP1‐preKO synapses. Synaptic transmission defects could be partially rescued with EGTA‐AM, indicating close coupling of Ca2+ channels to SV distance normally found in mature terminals may be compromised by DRP1‐preKO. Using paired recordings of the presynaptic and postsynaptic compartments, recycling defects could not be reversed by acute dialysis of ATP into the calyx terminals. Taken together, our results implicate a requirement for mitochondrial fission to coordinate postnatal synapse maturation.
Keywords: Presynaptic Terminals; Synaptic Transmission; DNM1L protein, human; Mitochondrial Proteins; Adenosine Triphosphate; Mitochondrial Dynamics; Mice; Animals
Key points
This study characterizes the mechanisms underlying defects in synaptic transmission when dynamin‐related protein 1 (DRP1) is genetically eliminated. Viral‐mediated knockout of DRP1 from the presynaptic terminal at the mouse calyx of Held increased initial release probability, reduced the size of the synaptic vesicle recycling pool and impaired synaptic vesicle recycling.
Transmission defects could be partially restored by increasing the intracellular calcium buffering capacity with EGTA‐AM, implying close coupling of Ca2+ channels to synaptic vesicles was compromised.
Acute restoration of ATP to physiological levels in the presynaptic terminal did not reverse the synaptic defects.
Loss of DRP1 impairs mitochondrial morphology in the presynaptic terminal, which in turn seems to arrest synaptic maturation.
Introduction
Mitochondrial dynamics are fundamentally important for a cell's wellbeing. Interrupting the mitochondrial fission–fusion cycle compromises mitochondrial function and affects neurotransmission in several neurodegenerative diseases, through dysregulation of presynaptic calcium sequestration and transmitter release (Chen & Chan, 2009; Benard et al. 2010). Mitofusins (Mfn1 and Mfn2) are required for fusion of the outer mitochondrial membrane, and optic atrophy 1 (Opa1) is essential for fusion of the inner mitochondrial membrane. Dynamin‐related protein 1 (DRP1), a GTPase, in conjunction with receptor proteins such as Mff, Fis1, MiD49 and MiD50, mediates mitochondrial fission (Otera & Mihara, 2011; van der Bliek et al. 2013; Mishra & Chan, 2016). Trafficking mitochondria to dendrites, and in some cases to axons, is also regulated by activity of these proteins (Li et al. 2004; Oettinghaus et al. 2016).
Eliminating DRP1 function in CNS neurons results in abnormally large mitochondria (Wakabayashi et al. 2009; Kageyama et al. 2012; Shields et al. 2015; Oettinghaus et al. 2016). DRP1 loss affects neuronal survival in contrasting degrees, depending on the brain region examined. For example, loss of DRP1 results in neuronal cell death of a majority of dopaminergic midbrain neurons within 1 month (Berthet et al. 2014). Conditional knockout in perinatal cerebellar neurons results in neuronal loss after 3 months (Kageyama et al. 2012). Targeted DRP1 loss in adult hippocampus does not result in overt cell death, though dendritic branching is impaired, and behavioural defects are apparent (Shields et al. 2015; but see Oettinghaus et al. 2016).
Loss of DRP1 impacts synaptic transmission, but the underlying mechanism is poorly understood. DRP1 loss in mouse hippocampal neurons altered short‐term plasticity, but has not been investigated closely (Shields et al. 2015; Oettinghaus et al. 2016). In these studies, mitochondrial ATP levels are reduced (Oettinghaus et al. 2016), and ATP production in presynaptic axons and boutons is more dependent on glycolysis (Shields et al. 2015). Thus, decreased mitochondrial production of ATP is a proposed mechanism for impaired transmission in DRP1‐knockout (KO) synapses, but the evidence is only correlative. If reduced cellular energetic substrate is the primary defect, restoring ATP to physiological levels via direct perfusion into the presynaptic terminal should reverse synaptic defects in DRP1 loss‐of‐function synapses. An additional role for DRP1 has been described in the presynaptic terminal, where it is proposed to act via its membrane‐binding GTPase function to directly enhance activity‐dependent synaptic vesicle (SV) endocytosis (Li et al. 2013). Thus, it remains unclear whether the synaptic defects observed in DRP1 loss‐of‐function studies are due to reduced mitochondrial ATP production, or a direct role of DRP1, resulting in impaired SV recycling. In this study, we show that acute ATP dialysis into the presynaptic terminal does not recover short‐term plasticity defects in DRP1 KO synapses, indicating that transmission defects are due to other long‐term changes during synaptic maturation.
We used the calyx of Held, a giant glutamatergic synapse in the medial nucleus of trapezoid body (MNTB), for this study due to its unique accessibility to direct presynaptic recordings and well‐known physiology during early postnatal development. In the calyx presynaptic terminal, mitochondria are part of highly specialized structures anchored to the presynaptic membrane and localized between SV release sites (Spirou et al. 1998; Rowland et al. 2000; Perkins et al. 2010); however, their functional role is yet to be ascertained. It is presumed that proximity of these mitochondrial complexes to sites of SV release and recovery helps to maintain the high‐energy demand of sustained neurotransmission and constitutive presynaptic vesicle recycling. Mitochondria also play an important role in these synapses by buffering elevated calcium concentration following a train of stimuli (Billups & Forsythe, 2002; Kim et al. 2005). In the present study, we selectively deleted DRP1 from the presynaptic calyx terminal and investigated in detail the resulting defects in synaptic transmission and vesicle recycling. By manipulating presynaptic calcium buffering and ATP concentration, we could dissect the mechanisms behind the changes in presynaptic vesicle pools and vesicle recycling.
Methods
Ethical approval
All animals in this study were used in accordance with animal welfare protocols approved by the University of Nevada, Reno and according to US standards for animal research (National Research Council, 2011), in order to minimize the animal's pain and distress. The information included below complies with the animal ethics checklist and ethical principles under which The Journal of Physiology operates. Wild‐type C57Bl/6 mice were obtained from Charles River Laboratories (C57BL/6NCrl, strain code 027; Hollister, CA, USA). Conditional ‘floxed’ DRP1 mice were obtained from Hiromi Sesaki, at Johns Hopkins University (Wakabayashi et al. 2009). A colony was maintained locally as homozygous DRP1fl/fl. Animals were given ad libitum access to water, and were maintained on standard mouse chow. Animals of both sexes were used at P13–24 for the experiments listed below. In total, 108 animals were used in this study.
Neuronal culture for protein detection
Neurons were obtained from embryonic brain at 16 days gestation from DRP1fl/fl mice, following standard procedures. Briefly, the dam was deeply anaesthetized with isofluorane until unresponsive, then killed by cervical dislocation. Embryos were removed from the uterus under sterile conditions. CNS forebrain tissue was isolated from embryos, and the cortices were cut into fine pieces and triturated with a plastic pipette with gentle strokes. The neurons (300 × 103 neurons/dish) were seeded onto 60 mm Petri dishes with 6 mL plating medium (0.04% B‐27 supplement, 0.01% fetal bovine serum, 1× GlutaMAX‐I, in Neurobasal Medium). After 3 days in vitro (DIV‐3), the medium was changed to 4 mL of maintenance medium (0.04% B‐27 Supplement, 1× GlutaMAX‐I 100×, in Neurobasal Medium) and neurons were infected with 2–2.5 μL rAAV‐Cre‐GFP virus (Abraham et al. 2010) for 5, 8 or 12 days. Cell culture medium was purchased from ThermoFisher Scientific (Waltham, MA, USA). Uninfected neurons were cultured and collected in parallel as controls. Medium was changed every 4 days. Protein lysate of transduced cells was collected on the designated day after confirming viral expression. Protein concentration was determined using Bio‐Rad DC Protein Assay (Bio‐Rad Laboratories, Hercules, CA, USA). DRP1 expression was measured by capillary‐based protein detection (ProteinSimple Wes, San Jose, CA, USA), using mouse anti‐DRP1 antibody (BD Biosciences, San Diego, CA, USA, Cat# 611112, RRID:AB_398423). Green fluorescent protein (GFP) expression was measured using anti‐GFP antibody (Abcam, Cambridge, MA, USA, Cat# ab6673, RRID:AB_305643). Protein lysate was diluted to 0.2 mg mL−1 and loaded at 1.2 μg protein per lane. Expression of anti‐DRP1 signal was normalized to that of anti‐β‐actin. GFP expression was not normalized, but expressed as arbitrary units (A.U.) based on signal density for anti‐GFP, measured using Compass for Simple Western software (ProteinSimple).
Generation of presynaptic‐specific DRP1‐KO
CNS injection of neonatal mice followed protocols described elsewhere (Chen et al. 2013; Pilpel et al. 2009). Briefly, 1‐day‐old (P1) DRP1fl/fl mice were chilled on ice for ∼5 minutes until unresponsive, then fixed on a stereotaxic surgery platform. The mice were injected with 1 μl of rAAV‐Cre‐2A‐GFP (rAAV‐Cre; Abraham et al. 2010) in sterile phosphate buffered saline (PBS), using empirically determined stereotaxic coordinates targeting the ventral cochlear nucleus. Virus was packaged by University of Pennsylvania Vector Core (http://www.med.upenn.edu/gtp/vectorcore). Viral titre was 2.75 × 10¹³ genomic copies mL−1, determined by qPCR. Subsequently, mice were put on a heating pad (37°C) to recover, then returned to their home cage. C57Bl/6 mice injected with rAAV‐Cre, and uninfected terminals from both strains were used as controls, as indicated. No transmission defects were observed in synapses of wild‐type (WT) mice infected with rAAV‐Cre, versus those in uninfected WT mice (data not shown).
Immunohistochemistry
Mice were deeply anaesthetized with isofluorane, then transcardially perfused with 4% paraformaldehyde (PFA) in 1x PBS. The brain was postfixed in PFA‐PBS for 2 h (DRP1 staining), or 24 h (COX1 staining), then sliced at 50–100 μm. Free floating transverse slices were permeabilized in 0.5% Triton X‐100 and blocked with 1% fish gelatin in PBS. Slices were incubated overnight in PBS at 4°C with primary antibodies against DRP1 (1:200; BD Biosciences, Cat# 611112, RRID:AB 398423), vesicular glutamate transporter 1 (vGluT1; 1:5000; Synaptic Systems, Göttingen, Germany, Cat #135 304, RRID:AB_887878), cytochrome c (1:100; BD Biosciences Cat# 556432, RRID:AB_396416) and/or cytochrome c oxidase (COX1; 1:500; Abcam Cat# ab14705, RRID:AB_2084810). Antibody staining was visualized with appropriate secondary antibodies (ThermoFisher Scientific, 1:1000) conjugated to Alexa 546 (RRID:AB_2535765 for DRP1, cytochrome c; RRID:AB_2534012 for COX1) or Alexa 647 (RRID:AB_141882).
Confocal microscopy and 3D image reconstruction
Images were collected on a Fluoview1000 laser‐scanning confocal microscope running Fluoview FV10‐ASW (Olympus Corporation, Waltham, MA, USA, RRID:SCR_014215), using a ×60 oil objective plus digital zoom. Stacks of images containing calyx terminals were generated using Z‐steps of 0.15–2 μm, generating volumes around 24 μm thick (range 11.5–36 μm). Terminals were sampled throughout the MNTB, with no discretion paid to tonotopic location.
3D reconstructions of calyx terminals were generated and analysed in Volocity 6.3 (PerkinElmer, Waltham, MA, USA, RRID:SCR_002668). Every channel in each image was iteratively deconvolved using a calculated point spread function, resulting in voxels of ≤200 nm on a side. Calyceal volumes were isolated using either GFP (for mitochondrial structural analysis) or vGluT1 (for analysis of DRP1 expression) signal. The investigator was blinded to the genotype of the images prior to analysis. Control terminals were WT, transduced with AAV‐Cre‐GFP. In Fig. 1 D, alterations in DRP1 levels were measured in images containing multiple terminals. Calyx terminal volumes in these experiments were automatically defined based on vGluT1 antibody signal. Infected (GFP+), and uninfected (GFP−) populations were defined within each image by GFP expression. Percentage knockdown was measured as DRP1 mean intensity values in GFP+/GFP− populations, normalized to DRP1 signal intensity in GFP− terminals within each image.
Figure 1. Viral‐mediated targeted elimination of DRP1.

A, capillary‐based protein detection (ProteinSimple Wes) of primary neuronal cultures from DRP1fl/fl mice infected with AAV‐Cre, showing loss of DRP1 protein at different time points after transduction. B, quantification of DRP1 expression normalized to β‐actin (filled bars, left axis) and GFP expression (open bars, right axis) as a function of time. Control is non‐infected (NI) cultures. * P < 0.05 for DRP1 expression, and # P < 0.05 for GFP expression, relative to control. C–E, viral‐mediated acute targeted elimination of DRP1 in vivo. C, example confocal image of infected and uninfected neurons in the ventral cochlear nucleus (VCN) from P18 DRP1fl/fl mouse, stained with anti‐DRP1 (red). Infected cells are identified by GFP reporter expression from AAV‐Cre (green). Right panel is merged image. Cytosolic DRP1 expression is seen in uninfected cell somata. DRP1 signal surrounding postsynaptic bushy cell soma is due to glial expression, and/or the presynaptic endbulb of Held, another axosomatic calyceal synapse onto the bushy cell. AAV‐Cre‐positive GFP‐expressing neurons (*) show near complete loss of DRP1 signal in the cell soma, and displacement from enlarged mitochondria. D, contralateral calyx of Held terminals were identified and isolated from background by vGluT1 staining (magenta) in confocal image stacks. Transduced terminals are marked by GFP reporter (green). DRP1 signal intensity in a GFP‐expressing terminal (white arrowhead) was reduced relative to non‐GFP‐expressing terminals (blue arrowheads) in the same image stack. Scale bar: 20 μm. E, summary of DRP1 signal intensity. DRP1 signal intensity was measured in the volumes described by presynaptic vGluT1 expression in image stacks containing both infected and uninfected terminals in the same field of view and normalized to the mean DRP1 signal intensity in uninfected terminals. Infected terminals show ∼40% reduction in DRP1 expression at P18.
Presynaptic SV and mitochondrial distribution in ventral cochlear nucleus (VCN) cell bodies and at the calyx of Held were measured in images containing single, GFP‐positive terminals in DRP1fl/fl or WT genetic background (Fig. 2). The volume of the terminal was defined automatically by suprathreshold GFP signal. Synaptic vesicle distribution was defined by suprathreshold vGluT1 signal, using local contrast adjustment at 0.5 μm. Mitochondria populations were defined by thresholding against COX1 signal. The number of discrete objects above threshold (number of particles) and the volume of each object were recorded. The volumetric fraction of the terminal containing mitochondria was calculated as percentage of the volume of mitochondria signal (sum of all particles) versus the volume of the presynaptic terminal (GFP signal).
Figure 2. Mitochondrial morphology and cell health of VCN bushy cells and calyx terminals.

A, mitochondria were stained with anti‐cytochrome c (magenta), a marker for mitochondrial integrity and morphology, and 3D confocal image stacks were generated containing neurons in the VCN. Left, WT mouse injected with Cre‐AAV‐GFP shows good infectivity in VCN, and normal reticular mitochondrial morphology. Right, AAV‐Cre‐GFP‐expressing cells in the VCN of a DRP1fl/fl mouse show large swollen and rounded mitochondria at the cell soma due to elimination of DRP1. Insets are enlargement of boxed regions, with signal excised based on a GFP mask. B, summary data of mitochondrial content as percentage of cell volume shows mitochondrial occupancy is slightly reduced in targeted DRP1 knockout. n indicates number of image fields analysed. C, action potential recorded from control (black) and DRP1‐KO (red) globular bushy cells (GBCs) at anterior ventral cochlear nucleus (aVCN), due to brief (1 ms) depolarization via current injection. D, summary plot of the somatic resting membrane potential (RMP) of control and DRP1‐KO GBCs. E, example 3D projection of confocal images of control (WT × Cre‐AAV‐GFP) and DRP1‐preKO (DRP1fl/fl × Cre‐AAV‐GFP) calyx of Held presynaptic terminals, excised using GFP reporter signal from AAV transduction. Tissue was stained with anti‐COX1 (green) and anti‐vGluT1 (magenta). F, summary data measuring calyceal terminal volume described by GFP signal. G, summary data measuring distribution of vGluT1 signal within the calyx, expressed as percentage occupancy of presynaptic terminal volume. H, summary data of estimated volume of COX1 particles suggest increased mitochondrial size in DRP1‐preKO terminals. I, total mitochondrial fraction, measured as percentage occupancy of calyceal terminal volume, is increased in DRP1‐preKO terminals.
Acute brain slice preparation
Animals were rapidly decapitated and 200 μm‐thick transverse brainstem slices containing the MNTB and VCN were prepared using a vibrating blade microtome (VT 1200S, Leica Microsystems, Wetzlar, Germany), as previously described (Lujan et al. 2016). Slicing solution contained (in mM): 85 NaCl, 2.5 KCl, 25 glucose, 25 NaHCO3, 1.25 NaH2PO4, 75 sucrose, 0.5 CaCl2, 7 MgCl2, 3 myo‐inositol, 2 sodium pyruvate, 0.4 ascorbic acid; pH 7.4 when continuously bubbled with carbogen gas (95% O2–5% CO2). Slices were transferred to an incubation chamber containing recording artificial cerebrospinal fluid (ACSF; in mM): 125 NaCl, 2.5 KCl, 25 glucose, 25 NaHCO3, 1.25 NaH2PO4, 2 CaCl2, 1 MgCl2, 3 myo‐inositol, 2 sodium pyruvate, 0.4 ascorbic acid, 315–320 mOsm density, bubbled with carbogen gas for 30–45 min at 35°C, and afterwards maintained at room temperature (∼23°C) until used for recording.
Electrophysiology
Slices were transferred to a recording chamber on an upright microscope, and continuously perfused with recording ACSF at a rate of 1–2 ml min−1 at room temperature (23°C). For calyx of Held recordings in MNTB, extracellular buffer was augmented with (in μM) 50 d‐(−)‐2‐amino‐5‐phosphonopentanoic acid (d‐AP5), 10 (−)‐bicuculline methiodide, and 0.5 strychnine to isolate AMPA receptor currents. d‐AP5 and bicuculline were purchased from Alomone Labs (Jerusalem, Israel). In experiments illustrated in Figs 4, 5, 6 and 8, 9, 10, 11, kynurenic acid (1 mM) was added to block AMPA receptor desensitization (Wong et al. 2003). Patch pipettes were fabricated from 1.5 or 2.0 mm O.D. borosilicate capillary glass with open tip resistance of 2–3 MΩ for postsynaptic recordings, and 6–8 MΩ for presynaptic recordings. Voltage recordings from VCN bushy cells and the calyx terminal used a K+‐based internal solution with the following composition (in mM): 97.5 potassium gluconate, 32.5 KCl, 40 HEPES, 12 sodium phosphocreatine, 2 Mg‐ATP, 0.5 GTP, 0.5 EGTA, pH 7.2, ∼310 mOsm. Voltage clamp intracellular recording solution contained (in mM): 130 caesium gluconate, 10 CsCl, 5 sodium phosphocreatine, 10 HEPES, 5 EGTA, 10 TEA‐Cl, 4 Mg‐ATP, 0.5 GTP, 5 QX‐314, pH 7.2 and 310–315 mOsm density. All salts were purchased from Sigma‐Aldrich (St Louis, MO, USA), unless otherwise specified.
Figure 4. Short‐term depression is greatly enhanced by DRP1‐preKO.

A, representative traces showing responses to a 100 Hz stimulus train in control (black) and DRP1‐preKO calyces (red). B, summary data of short‐term depression curves, normalized to the first EPSC amplitude, in control (black) and DRP1‐preKO synapses (red). DRP1‐preKO depresses much faster than the control and has a smaller steady‐state response. C, depression curves were fitted with a single exponential decay and were significantly faster in DRP1‐preKO synapses. D, summary plot of steady‐state response, calculated as average of the last 5 EPSC amplitudes in a train of stimuli, and normalized to the first EPSC in the train. Steady‐state response is significantly reduced in DRP1‐preKO synapses. E, paired‐pulse ratio (PPR) is significantly reduced in DRP1‐preKO synapses. F, summary semi‐log plot of PPR for interstimulus intervals between 10 ms and 1 s. PPR is significantly depressed by DRP1‐preKO at all frequencies tested. G, summary semi‐log plot showing steady‐state current from last 5 responses in a 20‐pulse train for frequencies between 100 and 1 Hz (interstimulus interval 10–1000 ms).
Figure 5. DRP1‐preKO reduced RRP size and RRP replenishment, and increased initial release probability, estimated by multiple methods.

A, representative cumulative EPSC plot (SMN plot), used to estimate RRP replenishment rate. Maximal replenishment rate (slope of linear fit) was estimated per cell. B, summary data of RRP refilling rate. Refilling was significantly reduced in DRP1‐preKO terminals. C, representative EQ plots. EQ plot was used to estimate RRP size, as x‐intercept of linear fit to initial portion of the plot. D, summary of RRP estimates, per cell, expressed in SV. RRP size was significantly reduced in DRP1‐preKO terminals. E, summary of release probability (P ves) estimate as fraction of the RRP released by the first stimulus shows a prodigious increase in DRP1‐preKO terminals. F, Wesseling–Lo model was alternatively used to estimate RRP size, replenishment rate and P ves. In these experiments, longer trains of 60 pulses at 100 Hz were used. Shown is a representation of Wesseling–Lo plot, outlining detection of the RRP (shaded area) and replenishment of SVs via unitary refilling rate (red line). G, summary data of estimated RRP size. H, summary of estimated release probability. I, summary of estimated unitary refilling rate.
Figure 6. Readily releasable pool recovery following RRP depletion is slowed by DRP1‐preKO.

A, recovery from depression protocol. The synapse was challenged with a depleting train of 100 Hz × 20 stimuli, followed at variable intervals (10 ms to 12.10 s) by a second test train of the same duration and length. Current integral of each train was measured, after subtracting stimulus artifacts. RRP recovery is measured as RRP2/RRP1, for each recovery time point. Greater than 30 s was allowed between each pair of trains to permit full recovery. B, summary RRP recovery curves for control and DRP1‐preKO. RRP recovery time course could be adequately fit by a single exponential (dotted lines) and was measured per cell. C, summary plot of recovery rate constant. DRP1‐preKO terminals show a significant decrease in recovery rate after RRP depletion.
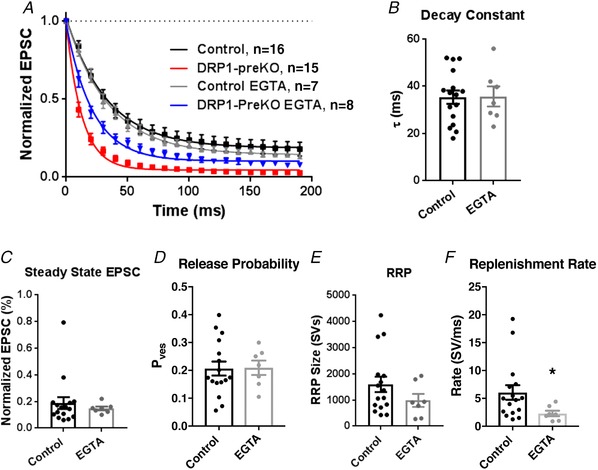
Figure 8. Increasing slow presynaptic terminal Ca2+ buffering via incubation in EGTA‐AM partially rescues DRP1‐preKO phenotype.

A, summary data of short‐term depression curves, normalized to the first EPSC amplitude, in control (black), control+EGTA (grey), DRP1‐preKO animals (red) and DRP1‐preKO+EGTA (blue). B–F, Summary plots showing that EGTA treatment slows decay constant (B), increases steady state EPSC (C), and reduces vesicle release probability (D). Notably, RRP size (E) and RRP replenishment rate (F) did not revert to control levels with EGTA treatment.
Figure 9. EGTA does not affect release probability at control synapses.
A, summary data of short‐term depression curves, normalized to the first EPSC amplitude, in control (black), control EGTA (grey), DRP1‐preKO animals (red) and DRP1‐preKO EGTA (blue). B–E, summary plots show that EGTA treatment does not alter decay constant (B), steady state EPSC (C), vesicle release probability (D), or RRP size (E). F, EGTA‐AM incubation reduced maximal replenishment rate in control animals.
Figure 10. Paired pre‐ and postsynaptic recordings from the calyx of Held.

Presynaptic whole cell voltage recordings were paired with postsynaptic whole cell voltage clamp recordings from control and DRP1‐preKO synapses. A, example traces, showing the first five stimuli and responses in a 100 Hz train within 2 min after establishing the presynaptic recording. Presynaptic action potentials were initiated by a 1 ms current injection (top trace) so that presynaptic APs were generated near the end of the current injection step (middle traces) and resulted in AMPAergic EPSCs (bottom traces). Recordings were performed in 1 mM kynurenic acid, to reduce receptor desensitization. B, summary data of EPSC responses during 100 Hz depression trains (n = 6–10 cells per condition and time point). C, postsynaptic responses during 100 Hz train, normalized to the first EPSC. D, resting presynaptic membrane potential taken at various time points after establishing presynaptic whole cell recording configuration. E, summary plot of peak (maximum) AP voltage of the first stimulus in a train, taken at various time points during the recording. F, summary data illustrating the time course of the falling phase of the first AP waveform in the train at various time points during the recording.
Figure 11. Paired pre‐ and postsynaptic voltage clamp recordings from the calyx of Held.

Both pre‐ and postsynaptic compartments were voltage‐clamped, to assay coupling between Ca2+ influx and exocytosis. A, Ca2+ influx was stimulated by 1 ms step depolarization to 0 mV, from holding potential of −80 mV (STIM, top trace). Leak‐subtracted (P/5) Ca2+ currents were recorded (Pre (I Ca), middle trace), along with the resulting postsynaptic response (Post (EPSC), bottom trace. Example recordings of the first five responses in a 100 Hz train (1 ms × 100 hz, 20 pulses) from control (black), and DRP‐preKO (red) are shown. B, scatter plot of Ca2+ current integral versus EPSC integral for the first stimulus in a train at 1–2 min after presynaptic break‐in, and at 10–12 min after break‐in, for control and DRP1‐preKO. C, transmission index, calculated as the integral of EPSC/I Ca, for successive time points during the recording. DRP1 showed similar index values to control. D, transmission indices (EPSC/I Ca) summarized for the 100 Hz train suggests that DRP1 have reduced excitation–secretion coupling.
Recordings were made from bushy cells of VCN and the postsynaptic principal cell in the MNTB using an Axon MultiClamp 700B amplifier running pCLAMP9 (Molecular Devices, Sunnyvale, CA, USA; RRID:SCR_011323). Voltage‐clamped cells were held at −70 mV command voltage, after correcting for liquid junction potential (estimated as −11 mV for caesium gluconate internal versus bath). Series resistance (R s) of recordings was in all cases < 8 MΩ and compensated so that residual R s was ∼0.5 MΩ. Calyx synapse recordings were sampled throughout the MNTB, with no attention paid to tonotopic location. Stimulation was delivered via a midline bipolar electrode at 0.5−1 V over the threshold voltage (5V maximum). Infected terminals were identified by GFP fluorescence in the calyx terminal, using an epifluorescence channel with excitation 470/40 nm, dichroic at 495 nm, and emission at 525/50). Illumination was provided by LED lamp (Lumencor SOLA, Beaverton, OR, USA). Fluorescence illumination was kept to a minimum, and tissue was not illuminated during recordings.
Paired recordings for presynaptic action potential (AP) waveforms (Fig. 10) used potassium gluconate‐based buffer in the presynaptic pipette, caesium‐based postsynaptic voltage clamp pipette buffer, and recording ACSF, as described above. Dual‐voltage clamp paired recordings (Fig. 11) used the caesium‐based internal solution in both pipettes, and the tip of the presynaptic pipette was wrapped in Parafilm to reduce pipette capacitance. Paired recordings were acquired using a HEKA EPC10 double amplifier (HEKA Instruments, Holliston, MA, USA), with the presynaptic cell in current clamp mode (I = 0) or voltage clamped to −80 mV for AP or Ca2+ current recordings, respectively. Presynaptic membrane voltages are corrected for liquid junction potential, estimated to be −9 mV for plotassium‐internal solution and −11 mV for caesium‐internal solution, relative to bath. Presynaptic R s was checked routinely during recordings, compensated 50–60% for I Ca recordings, and cells were discarded if R s > 30 MΩ. Gentle positive pressure was used intermittently between recording periods to facilitate ATP dialysis into the presynaptic compartment. In all cases, recordings were discarded if the leak current exceeded −200 pA, or when initial presynaptic membrane potential was not less than −60 mV. Postsynaptic recordings were performed as described above.
Data were imported to Igor Pro (WaveMetrics, Lake Oswego, OR, USA, RRID:SCR_000325), using NeuroMatic (pCLAMP data; RRID:SCR_004186; Rothman & Silver, 2018) or Patcher's Power Tools (HEKA data; RRID:SCR_001950), and analysed for statistics and presentation in Igor Pro and Prism (GraphPad Software, La Jolla, CA, USA, RRID:SCR_002798).
Estimation of the readily releasable pool (RRP) was done by using Elmqvist–Quastel method (EQ plot), where individual responses in a train on the y‐axis are plotted against the cumulative response on the x‐axis. A straight line is fitted to the initial four responses in the curve and the x‐axis intercept is used to estimate the RRP (Elmqvist & Quastel, 1965; Neher, 2015). Alternatively, RRP size was estimated using the Wesseling–Lo method, as described previously for the calyx of Held (Mahfooz et al. 2016). In brief, the integral of responses during a 100 Hz stimulation was measured after removing stimulus artifacts. RRP size at rest and maximal unitary recruitment rate can be determined numerically by comparing the initial release probability determined by measuring the RRP as a sum of all responses in a high frequency train to the release probability during steady state responses, when the SV pool is stimulated to near depletion. We refer the reader to the primary publications for a more detailed explanation of this method (Wesseling & Lo, 2002; Mahfooz et al. 2016).
Vesicle replenishment rate was calculated using a Schneggenburger‐Meyer‐Neher (SMN) plot, where the cumulative response during a high‐frequency stimulus train is plotted against stimulus number. A straight line is fitted to the late points of the cumulative response and the slope of the line is taken as the vesicle replenishment rate (Schneggenburger et al. 1999; Neher, 2015).
Temporal components of synaptic events (Fig. 3 G–I) were calculated using the maximum curvature method described previously (Fedchyshyn & Wang, 2007). Briefly, a Boltzmann charge–voltage equation was used to fit the initial onset of the excitatory postsynaptic current (EPSC) in the form
| (1) |
where I max is the EPSC amplitude, tc is a constant describing the slope of the falling current, and t mid is the midpoint of the fitting region. Levenberg–Marquardt algorithm with least‐squares minimization (Clampfit 10.6, Molecular Devices) was used to obtain best‐fit parameters. Then, the fourth derivative of I with respect to t was solved, and set to zero. Evaluations of the equation gave three solutions where,
| (2) |
| (3) |
| (4) |
Solutions for eqns (2) and (4) give the time of maximum curvature, and the solution that occurred earliest in time was used for EPSC onset.
Figure 3. Excitatory transmission is larger and slower in DRP1‐preKO.

A, representative traces from 0.1 Hz stimulation at the calyx of Held in 2 mM Ca2+ ACSF, showing DRP1‐preKO increased postsynaptic evoked responses to single nerve stimulation. Note delayed onset of EPSC in DRP1‐preKO synapse. B, summary of EPSC amplitude. A significant increase in EPSCs is observed in DRP1‐preKO synapses. C, calcium sensitivity of transmission was probed by recording EPSCs at different external bath [Ca2+]. Response amplitudes were normalized to 2 mM Ca2+ conditions. Calcium sensitivity was not affected by DRP1‐preKO. D, example traces of stimulation in 100 μM Cd, to elicit uniquantal responses (black trace), in tandem with synaptic failures (grey traces), at the calyx of Held. E, histogram of evoked responses showing distribution of response amplitude. F, summary plot of median quantal event amplitude, showing quantal size is not altered in DRP1‐preKO synapses. G, example EPSC recorded waveform, illustrating the different temporal components of transmission: conduction delay (CD), synaptic delay (SD) and transmission delay (TD = CD + SD). H and I, summary data for conduction delay and synaptic delay, respectively.
Ca2+‐imaging using AAV‐jRGECO1a
Adeno‐associated virus expressing the genetically encoded calcium sensor jRGECO1a was purchased from Vigene Biosciences (Rockville, MD, USA, no. BS8‐NOAAAV9). This sensitive red‐shifted calcium indicator is compatible with GFP imaging, though it does show photoconversion by 488 nm light (Dana et al. 2016). AAV‐jRGECO1a was mixed at 5:1 ratio with AAV‐Cre‐GFP, coinjected at P1 as described above (2 μL), and used to visualize Ca2+ in presynaptic‐specific DRP1 knockout (DRP1‐preKO) synapses where both fluorophores were seen at P20–23. Control synapses were from mice injected with AAV‐jRGECO1a alone, or terminals where GFP fluorescence (from AAV‐Cre‐GFP) was not visible. Infected terminals were identified by jRGECO1a fluorescence in the calyx terminal but was only clearly visible in response to orthodromic stimulation in healthy synapses. Midline stimulation (100 Hz, 200 ms) was used to visually identify infected terminals and validate axonal connectivity (see Fig. 7 A and B). Synapses where strong jRGECO1a fluorescence was visible at rest were not used for recording. Widefield fluorescence illumination was provided by a LED light engine (Lumencor SOLA). The light excitation filter (as middle wavelength/bandpass window) was 546/12 nm, with a 560 nm beam splitter, and emission filter 575/32 nm, mounted on a Zeiss AXIO Examiner A1 upright microscope (Carl Zeiss Microscopy, Thornwood, NY, USA) and visualized with a ×60 water‐immersion objective (1.0 NA). Ca2+ was imaged at 10 Hz during presynaptic depression trains, using an EM‐CCD camera (Hamamatsu ImagEM X2; Bridgewater NJ, USA) and controller software (HCImage, RRID:SCR_015041) with EM sensitivity gain at ×100, and 99 ms exposure. Images were analysed using HCImage software. The maximum stimulated response was used to define the region of interest. Maximal activity‐dependent change in fluorescence () was reported as ( for a sustained 2 s‐long train at 100 Hz to saturate jRGECO1a, similar to previous approaches (Sabatini et al. 2002; Egger & Stroh, 2009). The fluorescence change in response to a shorter 200 ms train was then reported as % , after linear baseline correction. These two stimulus trains were usually repeated three times per cell, with greater than 30 s rest between stimulus trains. Responses per stimulation paradigm were averaged per terminal, and terminals where baseline or response changed dramatically between stimulus bouts were discarded. All but one terminal showed consistent baseline and response amplitude during the course of the recording.
Figure 7. Cytosolic Ca2+ accumulation is enhanced in DRP1‐preKO terminals.
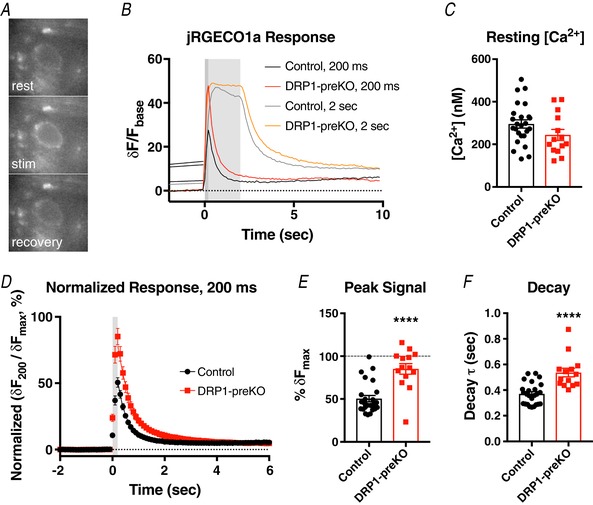
The genetically encoded Ca2+ sensor jRGECO1a was used to monitor free cytosolic Ca2+ in the calyx terminal, in response to high frequency stimulation for two different train lengths (100 Hz, 200 ms and 2 s duration). A, example images of jRGECO1a fluorescence at rest (top), during the stimulation train (middle), and 4 s after stimulation ended (bottom). B, example traces from two cells showing jRGECO1a response to 200 ms and 2 s trains. Note that DRP1‐preKO results in substantially larger 200 ms response, while 2 s response is similar to control. C, resting intraterminal free [Ca2+] was estimated using maximum fluorescence change from baseline, by the method of Maravall (2000; see Methods), and was not different between conditions. D, fluorescence change during a 200 ms train was normalized against maximum change during the longer 2 s train, per cell (δF 200/δF max), and corrected for signal drift (compare to panel B). E, peak fluorescence change in response to 200 ms train was significantly larger in DRP1‐preKO terminals. F, time constant of fluorescence signal decay to baseline (τ) was measured per cell, and was significantly slower in DRP1‐preKO terminals.
We used the method of Maravall et al. (2000) to estimate absolute cytosolic Ca2+ concentration at rest. Briefly, cytoplasmic Ca2+ concentration was calculated as
| (5) |
where K d is binding affinity (150 nM), is dynamic range of the probe (11‐fold), and is peak fluorescence change due to a 2 s stimulation train at 100 Hz. In control synapses, where did not saturate the sensor, we estimated free cytosolic [Ca2+] during the train as
| (6) |
jRGECO1a binding affinity and dynamic range at 25°C in vitro were from Lin & Schnitzer (2016), using values from Dana et al. (2016). Because the short 200 ms trains saturated DRP1‐preKO calyces, absolute [Ca2+] could not be determined.
Data analysis
Single exponential functions were used to fit depression and recovery time courses. Data are presented as the mean ± SEM, and number of biological replicates (cells or images analysed) mentioned per test in Results. Data were considered significant at P < 0.05, using Student's t test. The Holm–Sidak correction for multiple comparisons, or Welch's correction for differences in variance are referred to in Results.
Results
Viral Cre recombinase expression eliminates DRP1 at the presynaptic calyx of Held terminal
We used the LoxP‐mediated recombination method to conditionally eliminate DRP1 in neurons infected with rAAV‐Cre, in DRP1‐floxed mice. In vitro, this approach resulted in significantly reduced DRP1 expression within 5 days after infection of primary neurons with rAAV‐Cre, and complete loss of DRP1 expression at 8 days post‐transduction, inversely proportional to GFP expression (Fig. 1 A and B). For each time point, results of five independent cultures were evaluated for DRP1 detection, and three independent cultures were measured for GFP detection. In vivo, DRP1‐floxed (DRP1fl/fl) mice were injected with rAAV‐Cre in the ventral cochlear nucleus (VCN). At 17 days post‐infection (P18 mice) levels of DRP1 signal were undetectable in transduced cell soma of VCN bushy cells, while ubiquitous DRP1 signal was strong in uninfected cells and other cellular compartments (Fig. 1 C). DRP1 signal surrounding infected bushy cells is most likely from endbulbs of Held, an axosomatic synapse that terminates on these cells (Youssoufian et al. 2008). The contralateral projections of VCN bushy cells terminate in the calyx of Held presynaptic terminal, and the terminal can be visualized by staining for vGluT1 (Billups, 2005; Dondzillo et al. 2010; Kempf et al. 2013; see Methods). In the calyx terminal, DRP1 expression was reduced by nearly half, relative to neighbouring uninfected terminals (0.62 ± 0.04 versus normalized DRP1 signal in uninfected cells, n = 4 images from three animals; P = 0.001, t = 10.57, df = 3, paired t test; Fig. 1 D and E). Expression of vGluT1 was not visibly altered by DRP1 loss. Infection of WT (C57Bl/6) mice with rAAV‐Cre (‘WT controls’) did not result in any alteration of DRP1 signal at the calyx terminal (0.99 ± 0.04 versus uninfected cells, n = 9; P = 0.976, t = 0.0306, df = 8, paired t test).
Mitochondrial morphology in bushy cells of DRP1‐KO animals is altered
We investigated the effect of presynaptic DRP1 loss on mitochondrial morphology and localization at the calyx of Held. Animals were fixed, and mitochondria stained with anti‐cytochrome c. In VCN, transduced cell somas of bushy cells, which give rise to the calyx presynaptic terminal, showed a drastic change in mitochondrial morphology due to DRP1 loss. The normal reticular network of mitochondria was replaced by large spheroids (Fig. 2 A). The large immunoreactive particles are presumably hyper‐fused mitochondria, as described previously for neuronal and non‐neuronal cells (Uo et al. 2009; Kageyama et al. 2012; Shields et al. 2015; Fukumitsu et al. 2016; Oettinghaus et al. 2016). Deletion of DRP1 also reduced total mitochondrial content in the cell body (WT: 26.8 ± 0.8% of somatic volume, n = 41 cells from three image stacks, one animal; DRP1‐preKO: 22.0 ± 1.6% of volume, n = 19 cells from four image stacks, three animals; P = 0.011, t = 2.722, df = 26.15, t test with Welch's correction; Fig. 2 B).
Since deletion of DRP1 from globular bushy cells caused a substantial aberration in somatic mitochondrial morphology, we were interested to monitor whether it has any adverse effect on cellular health. Basic electrophysiological properties of bushy cells in the VCN were measured via whole cell voltage recordings. Bushy cells were identified based on single spiking events due to 50 ms depolarization, as previously described (Wu & Oertel, 1984). We did not observe any difference in the resting membrane potential (RMP) or ability to fire an action potential in control and DRP1‐KO neurons (RMP control: −67.1 ± 1.2 mV, n = 4; DRP1‐KO: −69.4 ± 1.3 mV, n = 5; P = 0.246, t = 1.267, df = 7; Fig. 2 C and D), indicating that basic neuronal properties were unaltered. In addition, several metrics of mitochondrial and cell health were evaluated, and suggest that neurons are not sick or undergoing apoptosis: cytochrome c staining was restricted to mitochondria (Fig. 2 A), Tetramethylrhodamine, Methyl Ester, Perchlorate (TMRM) staining (a measure of mitochondrial membrane potential) was not altered, no cleaved caspase‐3 staining was observed, and nuclei stained with 4′,6‐diamidino‐2‐phenylindole were not condensed (data not shown). Therefore, the ensuing results presented here are attributed to a defect in synaptic physiology, rather than generally degraded cellular health.
Presynaptic terminal volume, SV distribution, and mitochondrial morphology are altered in DRP1‐preKO
Laser scanning confocal microscopy images of the presynaptic terminal in fixed tissue were segmented from the rest of the tissue matrix, based on cytosolic GFP signal in DRP1fl/fl or WT mice injected with rAAV‐Cre (see Methods), and used to define the calyx volume and distribution of DRP1, mitochondria and SVs (Fig. 2 E). Deletion of DRP1 significantly reduced the total presynaptic calyx volume (Control: 848 ± 112 μm3, n = 11; DRP1‐preKO: 498 ± 44 μm3, n = 19; P = 0.012, t = 2.898, df = 13.16, t test with Welch's correction; Fig. 2 F). In calyx of Held terminals of adult rats, SVs are largely restricted to microscopic structures called ‘doughnuts’ (Wimmer et al. 2006). We noticed similar structures in control mouse calyx at P18 (Fig. 2 E) when labelling SVs with vGluT1. SV clusters occupied 42.2 ± 4.8% of the presynaptic volume. DRP1‐preKO terminals showed a significantly larger volume occupied by vGlut1 signal (58.5 ± 5.3%, P = 0.048, t = 2.068, df = 28, unpaired t test; Fig. 2 G), suggesting that these doughnut‐like structures are disrupted, and SVs are more dispersed within the presynaptic terminal.
Mitochondrial profiles were enlarged in DRP1‐preKO terminals, following the pattern observed at the soma, and consistent with findings in hippocampal synapses (Shields et al. 2015). While the estimation of mitochondrial size is clearly limited using light microscopy, we did attempt to quantify the size and occupancy of mitochondria, based on COX1 immunostaining signal, in the presynaptic terminal. The size of individual COX1 particles, likely small clusters of multiple mitochondria, was significantly increased in DRP1‐preKO, versus WT controls expressing AAV‐Cre (WT: 0.6 ± 0.1 μm3; DRP1‐preKO: 1.1 ± 0.2 μm3; P = 0.005, t = 3.182, df = 19.89, t test with Welch's correction; Fig. 2 H), suggestive of decreased mitochondrial fission at the presynaptic terminal. Total mitochondrial fraction at the presynaptic terminal, defined as presynaptic volume of anti‐COX1 stained volumes within the volume described by the GFP signal, was significantly enhanced in DRP1‐preKO mice (WT: 5.61 ± 1.04%; DRP1‐preKO: 9.74 ± 0.94%; P = 0.006, t = 2.938, df = 28, Student's t test; Fig. 2 I).
DRP1‐preKO synapses have increased response to low frequency stimulation
Stimulation of axons in the ventral stria efficiently elicits orthodromic action potentials at the calyx terminal, resulting in excitatory postsynaptic currents (EPSCs) in the innervated principal neuron of the MNTB. When stimulated at low frequency (0.1 Hz) in 2 mM Ca2+ ACSF, DRP1‐preKO synapses showed 1.25‐fold larger EPSCs, compared to uninfected controls (DRP1‐preKO: 13.2 ± 0.8 nA, n = 21; Control: 10.5 ± 0.7 nA, n = 25; P = 0.015, t = 2.543, df = 44, Student's t test; Fig. 3 A and B). This result indicates DRP1‐preKO may result in increased synaptic vesicle (SV) release probability (P r). One mechanism to increase evoked release is increased calcium sensitivity (Körber & Kuner 2016). To determine whether DRP1‐preKO synapses have altered calcium sensitivity, we recorded EPSCs in ACSF buffer with Ca2+ concentration from 0.5 to 2.0 mM. We did not find any difference in the EPSC size between control and infected synapses across extracellular calcium concentration, when normalized to the response in 2 mM [Ca2+], suggesting calcium sensitivity of SV release was not affected by loss of DRP1 (Fig. 3 C).
Alternatively, increased EPSC size could be due to an increase in SV quantal size, with no change in the number of SV released per EPSC. Therefore, we evoked uniquantal ‘miniature’ EPSCs (mEPSCs) by axonal stimulation in the presence of 100 μM cadmium chloride (CdCl2), to block the majority of voltage‐gated calcium channels and limit calcium entry, similar to a method previously described (Taschenberger et al. 2005). Stimuli were delivered at 10 Hz and events recorded gated by a window several milliseconds after the stimulation artifact (Fig 3 D). The median amplitude of mEPSCs obtained in this way can be used to estimate quantal size, and occasional successful events could be easily discriminated from failures. We did not find any difference in the quantal size between DRP1‐preKO and uninfected controls (Control: 39.9 ± 3.2 pA, n = 5 cells, 841 events; DRP1‐preKO: 40.5 ± 2.7 pA, n = 4 cells, 750 events; P = 0.893, t = 0.1388, df = 7, Student's t test; Fig. 3 E and F). The quantal amplitudes were comparable to those obtained from spontaneous quantal events (sEPSCs, data not shown). Thus, quantal size is not altered by DRP1‐preKO at the calyx of Held. Taken together, these results suggest that DRP1 loss results in an increase in quantal content of EPSCs at low frequency, but has no effect on SV transmitter content per se. We determined whether this increase in quantal content is due to larger RRP or altered release probability, below (see Figs. 4, 5).
We also observed a significant temporal delay in synaptic transmission in DRP1‐preKO (Fig. 3 A). Onset and timing of various transmission parameters preceding the postsynaptic EPSC are routinely visible in evoked traces and were used to determine the source of the delay in DRP1‐preKO responses. Briefly, the EPSC waveform includes three major temporal components, illustrated in Fig. 3 G: time from stimulus artifact to peak of presynaptic AP artifact (conduction delay, CD), time from pre‐AP artifact to EPSC onset (synaptic delay, SD). Transmission delay (TD) is the time from stimulus artifact to EPSC onset, the sum of CD and SD. Initiation of the postsynaptic EPSC was determined by the maximum curvature method (Fedchyshyn & Wang, 2007; see Methods). We did not find any significant difference in conduction delay between DRP1‐preKO and uninfected control cells (Control: 700 ± 50 μs, n = 15; DRP1‐preKO: 750 ± 60μs, n = 13; P = 0.521, t = 0.651, df = 26, Student's t test; Fig. 3 H). However, a significant increase was observed in synaptic delay in DRP1‐preKO (Control: 400 ± 30 μs, n = 15; DRP1‐preKO: 550 ± 40 μs, n = 13; P = 0.006, t = 3.031, df = 26, Student's t test; Fig. 3 I) indicating delayed SV release after arrival of the presynaptic AP. These results indicate that loss of DRP1 significantly slows down the timing of evoked synaptic vesicle release, similar to that shown for activity‐dependent slowing in normal synapses due to increased free Ca2+ load in the presynaptic terminal (Fedchyshyn & Wang, 2007). Alternatively, the increased synaptic delay could be due to an altered presynaptic AP waveform. We attempted to discriminate between these two possibilities with additional experiments, below (see Figs. 7 C and 10).
DRP1‐preKO shows faster synaptic depression and reduced relative RRP size
Mitochondria are abundant in the presynaptic compartment of many synapse types, and act to maintain calcium and energy homeostasis following high frequency transmission (Kann & Kovács, 2007). As the synaptic vesicle cycle is heavily dependent on ATP production and is closely regulated by the cytosolic calcium concentration, presynaptic mitochondria are expected to play a central role in maintaining efficient synaptic vesicle recycling (Vos et al. 2010; Smith et al. 2016; Devine & Kittler, 2018). Pharmacological approaches have shown that mitochondria can regulate short‐term plasticity by adjusting Ca2+‐dependent neurotransmitter release and synaptic vesicle recycling, and act to fulfil bioenergetic demands of the synapse by maintaining ATP during intense synaptic activity (Alnaes & Rahamimoff, 1975; Tang & Zucker, 1997; Li et al. 2013; Rangaraju et al. 2014). The calyx of Held can reliably follow several hundred hertz frequency stimulation, resulting in well‐characterized short term depression due to vesicle depletion, which can generally be fit with a single exponential decay time constant (von Gersdorff & Borst, 2002). We interrogated the calyx with trains of high frequency stimuli to determine whether presynaptic DRP1 loss affected short term plasticity.
The releasable pool size and rate of SV recycling can be determined by a short train of high frequency stimulation at 100–300 Hz. To investigate the role of fission‐deficient mitochondria in support of high frequency transmission, synapses were stimulated with 20 stimuli at 100 Hz (Fig. 4 A). In these experiments, and those below, 1 mM kynurenic acid was included in ACSF to limit AMPA receptor desensitization and provide a more accurate representation of glutamatergic SV release. DRP1‐preKO synapses showed profound depression in the EPSC response relative to controls, evident by a significantly faster decay time constant for synaptic pool depression (Control: 35.4 ± 2.8 ms, n = 16; DRP1‐preKO: 13.3 ± 1.8 ms, n = 15; P < 0.0001, t = 6.527, df = 29, Student's t test; Fig. 4 B and C). Steady‐state depression, a balance between release and replenishment of release competent SVs, was ∼20% of initial EPSC amplitude in control synapses, but significantly smaller in DRP1‐preKO, eventually resulting in a near‐complete loss of transmission (Control: 18.8 ± 4.5%; DRP1‐preKO: 3.0 ± 0.5%; P = 0.002, t = 3.396, df = 29, Student's t test; Fig. 4 D). Concomitantly, DRP1‐preKO synapses showed a significant decrease in the paired‐pulse ratio (EPSC2/EPSC1; Control: 0.84 ± 0.03; DRP1‐preKO: 0.43 ± 0.05; P < 0.0001, t = 6.995, df = 29, Student's t test; Fig. 4 E). While a majority of control recordings reliably resulted in postsynaptic EPSCs after each stimulus in a 300 Hz train without failure, presynaptic DRP1‐preKO synapses were incapable of following stimulation at this frequency, due to synaptic failures late in the train (data not shown). In fact, at all stimulation frequencies ≥1 Hz (up to 100 Hz), DRP1‐preKO mice showed a significant and consistent decrease in paired‐pulse ratio and steady‐state EPSC size, compared to controls (Fig. 4 F and G; n = 4–10 cells per condition and frequency; F = 54.48, DFn = 1, DFd = 66, P < 0.0001 between groups for steady state; F = 137.21. DFn = 1 DFd = 69, P < 0.0001 between groups for paired pulse; 2‐way ANOVA, followed by Fisher's uncorrected LSD test for multiple comparisons).
We used cumulative amplitude measurements of 100 Hz trains data to estimate the RRP size, P r and vesicle replenishment rate (Fig. 5). Two types of cumulative EPSC approaches are commonly used, depending upon the choice of the parameters to be determined (Neher, 2015; Kaeser & Regehr, 2017). Back extrapolation (plotted as cumulative EPSC versus stimulus number, SMN plot; Fig. 5 A) is useful to estimate the maximum rate at which vesicles are being replenished, whereas forward extrapolation (EPSC in a train vs cumulative EPSC, EQ plot; Fig. 5 C) is useful for estimating the initial RRP size when initial P r is high. We chose not to rely on the SMN plot to determine the RPP size for two reasons: increased initial P r, and newly recycled vesicles replenishing the RRP during the stimulus train will artificially inflate RRP estimates (Neher, 2015). The maximum vesicle replenishment rate during a train of stimuli, measured using the SMN plot, was significantly reduced by loss of DRP1 (Control: 6.0 ± 1.3 ms−1; DRP1‐preKO: 2.2 ± 0.4 ms−1; P = 0.010, t = 2.744, df = 29, Student's t test; Fig. 5 B). RRP size was calculated using an EQ plot, and presented as number of synaptic vesicles (SVs) per pool, by dividing by quantal size. Quantal size in these experiments was assumed to be constant throughout the train, as desensitization was blocked by kynurenic acid, and desensitization recovery is very fast at the ages examined in this study (Taschenberger et al. 2005). Quantal size was corrected for the effect of kynurenic acid, which reduces EPSC amplitude by ∼80% due to its property as a low affinity antagonist for AMPA receptors. Interestingly, the RRP was reduced twofold in DRP1‐preKO mice (795 ± 101 SVs), relative to control (1596 ± 293 SVs; P = 0.018, t = 2.517, df = 29, t test with Welch's correction; Fig. 5 D). SV release probability, estimated as the fraction of the RRP released by the first stimulus, was significantly increased in DRP1‐preKO synapses, as expected from the paired‐pulse ratio in the stimulation protocols above (Control: 0.21 ± 0.02; DRP1‐preKO: 0.56 ± 0.04; P = 0.0001, t = 7.448, df = 29, Student's t test; Fig. 5 E), again suggesting that loss of DRP1 interferes with intracellular calcium homeostasis.
We also calculated RRP and probability of release using the Wesseling–Lo model (Wesseling & Lo, 2002; Mahfooz et al. 2016). This model provides a more accurate estimation of RRP and P r than the EQ plot, as it takes into account pool replenishment during the stimulus train, when the pool is stimulated to near depletion (Fig. 5 F). Results using this model were consistent with the ones described above. DRP1‐preKO results in a smaller RRP (Control: 1525 ± 259 SVs, n = 9; DRP1‐preKO: 636 ± 104 SVs, n = 9; P = 0.0091, t = 3.189, df = 10.54, t test with Welch's correction; Fig. 5 G). Paired‐pulse ratio was decreased in DRP1‐preKO (0.34 ± 0.04) versus control (0.92 ± 0.06; P < 0.0001, t = 7.034, df = 16, unpaired t test), and release probability was increased in DRP1‐preKO (0.57 ± 0.05) relative to control (0.25 ± 0.02; P = 0.002, t = 5.365, df = 10.74; Fig. 5 H). RRP refilling is modelled as a unitary rate that depends on SV site vacancy and is decreased in DRP1‐preKO (1.55 ± 0.20 ms−1) versus control (3.78 ± 0.55 ms−1; P = 0.003, t = 3.82, df = 10.03, t test with Welch's correction; Fig. 5 I). Taken together, these results indicate loss of DRP1 results in a drastically reduced initial RRP size, as well as a defect in activity‐dependent vesicle pool refilling.
DRP1‐preKO synapses show slower RRP recovery at rest
Because DRP1‐preKO synapses showed slower replenishment of synaptic vesicles during a stimulus train, but characteristics that are compatible with increased intraterminal free Ca2+, it would be interesting to know if RRP recovery at rest is also affected after an RRP‐depleting stimulus. Previous work indicates that RRP recovery at the calyx synapse has a strong Ca2+‐dependent component and cytosolic calcium is quickly buffered from the calyx terminal during rest periods (Wang & Kaczmarek, 1998; Chen et al. 2013; Hosoi et al. 2007). We hypothesized that RRP recovery may be affected if resting intraterminal calcium were altered in DRP1‐preKO synapses. We used two bouts of 100 Hz stimulation trains, separated by defined rest intervals from 10 ms to 12 s, to assay recovery of the RRP (Fig. 6 A). Again, 1 mM kynurenic acid was used to limit receptor desensitization and permit examination of SV turnover. We found RRP recovery was significantly impaired in DRP1‐preKO synapses after a depleting train (Fig. 6 B). Recovery could be adequately fit in both cases by a single rate constant, which was significantly slower in DRP1‐preKO synapses (Control: 0.35 ± 0.02 s−1, n = 14; DRP1‐preKO: 0.27 ± 0.02 s−1, n = 12; P = 0.003, t = 2.285, df = 23, Student's t test; Fig. 6 C).
DRP1‐preKO increases cytosolic Ca2+ in the presynaptic terminal in response to stimulation
Increased vesicle release in DRP1‐preKO synapses could be due to mitochondrial defects, leading to an inability to buffer calcium efficiently. Alternatively, DRP1‐preKO could cause reduced ATP availability, as previously reported for other glutamatergic synapses (Verstreken et al. 2005; Shields et al. 2015; Oettinghaus et al. 2016), which could lead to reduced clearance from the presynaptic cytosol via plasma membrane calcium ATPases. In an attempt to discern whether Ca2+ accumulation in the terminal was affected, we expressed the red‐shifted Ca2+ indicator jRGECO1a in the presynaptic calyx terminal in control and DRP1‐preKO synapses. The synapse was activated with short trains of high frequency stimulation equivalent to that used for depression curves above, and longer trains (100 Hz, 2 s) to fully saturate jRGECO1a in the presynaptic terminal (Fig. 7). Only terminals that showed low baseline signal and a visible response to stimulation that returned to baseline were selected for analysis.
During 2 s‐long trains of stimulation at 100 Hz, free intracellular Ca2+ reached a plateau, suggesting the probe was saturated (Fig. 7 B). Since the maximum fluorescence change from baseline (δF max) was not significantly different between control (48.8 ± 3.4%, n = 25 terminals), and DRP‐preKO (59.8 ± 5.6%, n = 14 terminals; P = 0.086, t = 1.764, df = 37, unpaired t test), we assume that jRGEO1a is saturated under these conditions. Using the approach of Maravall et al. (2000) to estimate resting [Ca2+], we found that the two resting conditions were also similar: control (296 ± 19 nM) and DRP‐preKO terminals (244 ± 26 nM; P = 0.116, t = 1.609, df = 37, unpaired t test; Fig. 7 C).
The fluorescence response for short 200 ms trains was normalized against the maximum fluorescence change during a 2 s stimulation train, per cell (Fig. 7 D). Stimulation during short trains resulted in an increase in jRGECO1a signal to 50 ± 4% of maximum in control (Fig. 7 E). DRP1‐preKO terminals showed a significantly larger increase, to 85 ± 6% of maximum (P < 0.0001, t = 5.176, df = 37, unpaired t test). Recovery of jRGECO1a signal to baseline was fit by a single exponential in controls (τ = 371 ± 17 ms). Signal decay to baseline in DRP‐preKO terminals was also well fit by a single exponential in all cases, though it was significantly slower to return to baseline (τ = 537 ± 34 ms; P < 0.0001, t = 4.887, df = 37, unpaired t test; Fig. 7 F).
We attempted to estimate the change in [Ca2+] in control synapses during these shorter 200 ms trains. In 23 of 25 cases, the sensor was not saturated, and these terminals were used to estimate peak free [Ca2+], using Eqn (6). During a 200 ms train, peak [Ca2+]cyto was estimated to reach 1.46 ± 0.4 μM, which returned to baseline and could be adequately fit by a single exponential decay with a time constant of 141 ms. These values are consistent with those found previously, and are indicative of mitochondrial buffering to limit free cytosolic Ca2+ during activity (Kim et al. 2005). In a majority of cases, stimulation of DRP1‐preKO terminals saturated the sensor (8 of 14 terminals), so activity‐dependent free Ca2+ could not be estimated. Regardless, our results clearly show that free cytosolic Ca2+ is elevated in the presynaptic terminal by DRP1 loss.
Increasing slow Ca2+ buffering with EGTA‐AM in presynaptic terminals ameliorates the DRP1‐preKO phenotype
Slices were treated with EGTA‐AM (200 μM) at 35–37°C for 45 min, to increase slow Ca2+ buffering capacity in the presynaptic terminal, and thereafter washed thoroughly with normal ACSF containing no EGTA‐AM. Short‐term depression in response to a 100 Hz × 200 ms stimulus train was significantly improved in EGTA‐treated DRP1‐preKO synapses, while no effect was observed for control synapses (Figs. 8 and 9). In these experiments, 1 mM kynurenic acid was also used to limit receptor desensitization, and permit examination of SV turnover. EGTA treatment slowed the decay constant in DRP1‐preKO (DRP1‐preKO: 13.3 ± 1.8 ms, n = 15; DRP1‐preKO + EGTA: 22.1 ± 2.6, n = 8; P = 0.010, t = 2.831, df = 21, Student's t test; Fig. 8 A and B), and enhanced steady state current (DRP1‐preKO: 3.00± 0.52%; DRP1‐preKO + EGTA: 8.54 ± 1.39%; P = 0.0002, t = 4.522, df = 21, unpaired t test; Fig. 8 C). As expected from the effect of loading EGTA into the presynaptic terminal, we observed a significant reduction in vesicle release probability (P ves) at the DRP1‐preKO (DRP1‐preKO: 0.55 ± 0.04; DRP1‐preKO + EGTA: 0.35 ± 0.04; P = 0.004, t = 3.29, df = 21, Student's t test; Fig. 8 D), indicating improved calcium homeostasis. EGTA treatment did slightly reduce EQ estimation of the RRP size (DRP1‐preKO: 795 ± 101 SVs; DRP1‐preKO + EGTA: 525 ± 150 SVs; P = 0.142, t = 1.524, df = 21, Student's t test; Fig. 8 E); however, this effect was not significant due in part to heterogeneity in RRP size, but suggests EGTA further reduces RRP size, in opposite direction of controls. Maximal SV replenishment rate, estimated using an SMN plot, was not affected (DRP1‐preKO: 2.21 ± 0.39 SV ms−1; DRP1‐preKO+ EGTA: 1.99 ± 0.39 SV ms−1; P = 0.715, t = 0.37, df = 21, Student's t test; Fig. 8 F). Notably, EGTA loading in control synapses did not alter short‐term plasticity parameters (decay, steady‐state, release probability, or RRP size), indicating that Ca2+ buffering induced by EGTA‐AM loading is not fast enough to affect SV release in terminals at this age (Fedchyshyn & Wang, 2005; Fig. 9). However, EGTA did reduce the maximal rate of SV resupply (Control: 0.050 ± 0.011 ms−1, Control+EGTA: 0.019 ± 0.004; P = 0.014, t = 2.694, df = 18.66, t test with Welch's correction), an effect known to be dependent on slow cytosolic Ca2+ buffer capacity (Wang & Kaczmarek, 1998; Fig. 9 F).
Short‐term plasticity defects in DRP1‐preKO are not rescued by acute ATP dialysis into the presynaptic terminal
Defects in synaptic vesicle recycling in DRP1‐KO neurons have largely been attributed to an ATP deficit (Verstreken et al. 2005; Shields et al. 2015; Oettinghaus et al. 2016). This hypothesized mechanism suggests that increasing presynaptic ATP would reverse the synaptic defects towards control responses. In contrast, a recent paper suggests that DRP1 may act to directly facilitate SV retrieval from presynaptic terminal membrane, via interaction with clathrin complexes (Li et al. 2013). We used paired recordings in P13–16 control and DRP1‐preKO animals to determine if acute ATP restoration to physiological levels via the presynaptic patch pipette would reverse the short‐term depression phenotype of DRP1‐preKO synapses towards control (Fig. 10). Presynaptic patch pipette buffer contained several energetic substrates: physiological levels of ATP (2 mM; Jolivet et al. 2015; Lucas et al. 2018), 0.5 mM GTP and 12 mM phosphocreatine. The diffusion coefficient for ATP in cytosol has been estimated at ∼3.6 × 10⁻⁶ cm2 s−1 at room temperature, so should reach equilibrium in the terminal over the course of several minutes (Hubley et al. 1996; Le Masson et al. 2014; Lucas et al. 2018). In these experiments, 1 mM kynurenic acid was also used to limit receptor desensitization. Immediately after establishing the paired recording configuration (within 2 min of rupturing the presynaptic membrane), a high frequency stimulation train at 100 Hz (20 pulses, three trains at 30 s intervals) was elicited by suprathreshold presynaptic current injection (1 ms, 300–500 pA) and postsynaptic responses monitored (Fig. 10 A). Postsynaptic responses mimicked the DRP1‐preKO phenotype seen above (see Fig. 4), resulting in increased short‐term depression versus control synapses (Fig. 10 B and C). Notably, AP waveform did not degrade during the train, confirming that enhanced depression in DRP1‐preKO synapses is due to reduced SV release competency, and not AP failure (see Fig. 10 A, and data not shown). After 5 min rest, to permit equilibration of ATP concentration in the terminal, another series of three stimulation trains were elicited. A third set of stimulations was given at 10–12 min. There was no effect of ATP dialysis on the synaptic response profile of DRP1‐preKO synapses, at either 5 min or 10 min presynaptic dialysis (Fig. 10 B and C). Depression kinetics were similar to those shown for orthodromic axonal stimulation, and significantly faster for DRP1‐preKO synapses (Table 1). At times beyond 10 min, control synapses begin to fatigue (Fig. 10 B, and Renden and von Gersdorff, 2007), so recordings were not continued. This result suggests that in DRP1‐preKO, an acute ATP deficit, expected due to compromised mitochondrial morphology, is not the major cause of increased synaptic depression at the calyx of Held.
Table 1.
Metrics from paired AP recordings (Fig. 10)
| Experimental Condition | n | 1st EPSC (nA) | Depression τ (ms) | Steady‐state (%) | Pre‐V m (mV) | Pre‐AP peak | Pre‐AP falling (90–10%, μs) |
|---|---|---|---|---|---|---|---|
| Control | |||||||
| 1–2 min† | 10 | 1.186 ± 0.251 | 44.08 ± 8.93 | 39.18 ± 11.65 | −71.36 ± 1.35 | 25.93 ± 3.01 | 198.2 ± 10.7 |
| 5–7 min | 9 | 1.385 ± 0.293 | 35.40 ± 6.82 | 31.55 ± 8.11 | −69.16 ± 1.65 | 32.48 ± 5.69 | 197.7 ± 20.9 |
| 10–12 min | 7 | 0.983 ± 0.234 | 40.80 ± 8.51 | 29.71 ± 7.42 | −70.59 ± 1.68 | 35.32 ± 4.43 | 176.6 ± 15.4 |
| >15 min | 4 | 0.737 ± 0.231 | 42.24 ± 11.75 | 30.98 ± 10.63 | −73.85 ± 1.10 | 45.08 ± 6.56 | 160.5 ± 3.6 |
| DRP1‐preKO | |||||||
| 1–2 min† | 8 | 1.355 ± 0.216 | 16.40 ± 1.54* | 10.91 ± 2.96* | −65.82 ± 0.96* | 19.56 ± 1.60 | 310.0 ± 14.5*** |
| 5–7 min | 6 | 1.443 ± 0.183 | 13.15 ± 1.20* | 6.14 ± 0.83 | −64.58 ± 1.42 | 17.78 ± 4.05# | 352.6 ± 29.7**** |
| 10–12 min | 6 | 0.950 ± 0.161 | 15.00 ± 1.66* | 8.48 ± 1.37 | −66.98 ± 1.16 | 19.49 ± 5.89# | 321.1 ± 41.5**** |
| ANOVA‡ | 0.8991; 0.5044 | 3.788; 0.0041 | 2.859; 0.0194 | 4.64; 0.0011 | 4.16; 0.0024 | 12.19; < 0.0001 | |
†Time after presynaptic recording is initiated. ‡ANOVA results reported as F(6, 43); P value. Post hoc tests compared Control to DRP1‐preKO at each time point. Adjusted P‐values: # P = 0.0533, * P < 0.05, *** P < 0.001, **** P < 0.0001.
Other informative presynaptic metrics were also obtained from these recordings and are listed in Table 1. For example, the presynaptic membrane was initially less polarized in DRP1‐preKO (Fig. 10 D). Subthreshold depolarizations in this range have been shown to increase cytosolic [Ca2+], and contribute to release probability (Awatramani et al. 2005). A similar mechanism could be present in DRP1‐preKO terminals, increasing initial P r (see Fig. 5 E and H), but we do not think it is the major mechanism. Depression curves were largely unchanged during the course of the recording, where membrane potential became more hyperpolarized in both control and DRP1‐preKO synapses. Additionally, we did not observe a difference in resting [Ca2+] using jRGECO1a imaging (see above, Fig. 7 C).
While presynaptic current injection often occluded the rising phase of the presynaptic action potential (Fig. 10 A), we were able to monitor the AP peak and falling phase of the presynaptic AP waveform. The peak voltage of AP overshoot was not altered by DRP1‐preKO, nor was it altered by dialysis (Fig. 10 E). However, the falling phase of the AP was dramatically slower in DRP1‐preKO terminals (Fig. 10 F). This slower AP is thus likely to be the underlying cause of synaptic delay observed above and is also likely to contribute to increased initial release probability (see Fig. 3).
In a separate set of experiments, paired voltage clamp recordings were used to monitor the EPSC response to short 1 ms depolarizations and subsequent Ca2+ influx (Fig. 11). The excitation–secretion ratio (integral of EPSC/integral of Ca2+ pre) was slightly smaller in DRP1‐preKO synapses (2.96 ± 1.03, n = 4) relative to controls (3.9 ± 0.9, n = 9), but was not statistically different, and ran down proportionally over the course of 10 min after establishing presynaptic recordings (adjusted P‐value >0.5 at <2 min and 10 min; multiple t test with Holm–Sidak correction for multiple comparisons; Table 2). From this dataset, we propose that increased excitation–secretion coupling in DRP1‐preKO synapses is not due to increased calcium sensitivity for SV exocytosis and may even be impaired relative to control synapses.
Table 2.
Metrics from paired voltage‐clamp recordings (Fig. 11)
| Experimental Condition | n | Q Ca, 1 ms (pC) | Ca2±‐channel density (pC pF−1) | EPSC (pC) | Post/Pre index, 1 ms | Adjusted P‐value§ | Post/Pre index, 100 Hz | Adjusted P‐value§ |
|---|---|---|---|---|---|---|---|---|
| Control | ||||||||
| 1–2 min† | 9 | 1.46 ± 0.18 | 0.070 ± 0.01 | 6.55 ± 1.88 | 3.90 ± 0.89 | 0.76 ± 0.11 | ||
| 5–7 min | 6 | 1.48 ± 0.19 | 4.65 ± 1.46 | 3.13 ± 1.14 | 0.53 ± 0.09 | |||
| 10–12 min | 5 | 1.94 ± 0.46 | 6.02 ± 2.18 | 2.99 ± 0.55 | 0.46 ± 0.03 | |||
| DRP1‐preKO | ||||||||
| 1–2 min | 4 | 1.37 ± 0.23 | 0.084 ± 0.03 | 4.53 ± 1.92 | 2.96 ± 1.03 | 0.790 | 0.66 ± 0.19 | 0.748 |
| 5–7 min | 4 | 1.28 ± 0.43 | 4.35 ± 3.39 | 2.30 ± 1.13 | 0.790 | 0.43 ± 0.10 | 0.748 | |
| 10–12 min | 3 | 1.61 ± 0.72 | 4.01 ± 3.40 | 1.65 ± 0.95 | 0.553 | 0.27 ± 0.11 | 0.230 | |
| F (5, 25) = 0.4679‡ | t = 0.5377 df = 11¶ | F (5, 25) = 0.2273‡ | ||||||
| P‐value | 0.7964 | 0.6015 | 0.9471 | |||||
†Time after presynaptic recording is initiated. ‡ANOVA table results, F(DFn, DFd). §Multiple t test, P‐value corrected for multiple comparisons. ¶Unpaired t test.
Discussion
The ability of a synapse to successfully stimulate its postsynaptic accomplice depends on many presynaptic factors: calcium concentration, efficacy of fusion proteins for exocytosis, number of vesicles primed for release, and availability of cellular energy to fuel these processes. Using the calyx of Held as a model for examining presynaptic function, we hope to contribute to a greater mechanistic understanding of the synaptic basis of neurological and neurodegenerative diseases where dysregulation of mitochondrial dynamics and function is a likely culprit (Devine & Kittler, 2018). Here, we show DRP1 loss from the presynaptic compartment results in altered mitochondrial morphology and severe defects in multiple facets of synapse physiology.
We assumed that Cre‐mediated elimination of DRP1 takes at least 5 days, based on in vitro results in neuronal cultures (Fig. 1). Since the calyx terminal is formed within 2–3 days after birth (Hoffpauir et al. 2010) synaptogenesis is not perturbed by injections at P1. We saw a complete loss of DRP1 in vivo 17 days after injection at the soma of the globular bushy cells (GBCs) of aVCN. However, we observed only ∼40% reduction of DRP1 at the corresponding calyx of Held synapse. This discrepancy may be due to a longer lifetime of protein at the distal presynaptic terminal, or a floor effect of the immunostaining assay. Nevertheless, mitochondrial morphology was disrupted at the soma, and perhaps also at the presynaptic terminal, resulting in large mitochondrial profiles but normal somatic resting potential. These results indicate that the experimental system is working and does not result in general cell death. The overall phenotype of DRP1‐preKO terminals is similar to what would be expected in younger terminals, prior to the onset of hearing: slower presynaptic AP, loose spatial excitation–secretion coupling, increased P r, smaller RRP, and slower replenishment. However, cytosolic Ca2+ accumulation is substantially increased in DRP1‐preKO terminals. We suggest that altered mitochondrial morphology due to DRP1 loss has a proximal effect on activity‐dependent Ca2+ dynamics in the presynaptic terminal, and also arrests synaptic maturation at the calyx of Held. The mechanism(s) underlying altered Ca2+ accumulation, and the link between dysfunction induced by DRP1 loss and synaptic maturation require further clarification.
Comparison to previous studies
Earlier studies showed DRP1 deletion causes different levels of synaptic impairment, depending on the system tested. For example, at the Drosophila neuromuscular junction, basal neurotransmission remained unaffected, and aberrations in neurotransmission were only observed under intense synaptic activity (Verstreken et al. 2005). This stands in contrast to forebrain neurons of hippocampus and cortex, where loss of DRP1 impaired basal neurotransmission as well as the strength of repetitive neurotransmission (Shields et al. 2015; Oettinghaus et al. 2016). In these models, an ATP deficit is postulated as a causative factor for the phenotype observed. Our data at the calyx synapse show that cell‐autonomous loss of presynaptic DRP1 results in significant defects in both basal and activity‐dependent transmission, far more severe than that reported previously for conventional glutamatergic synapses. Importantly, the phenotypes we observe are not rescued by direct intraterminal ATP dialysis, but may be more dependent on chronically impaired synaptic maturation.
Altered free presynaptic Ca2+ during activity
In DRP1‐preKO synapses, we observed an increase in basal quantal content and increased SV release probability (Figs. 3 and 5). However, we did not see any effect of DRP1 loss on the Ca2+‐dependence of SV exocytosis by changing external Ca2+ concentration (Fig. 3 C). In fact, the calcium‐dependent efficacy of SV release was slightly reduced in DRP1‐preKO terminals relative to controls (Fig. 11 C and D, and Table 2). Thus, we assume these defects are due at least in part to increased intraterminal free calcium. We saw a substantial increase in activity‐dependent jRGECO1a signal, and slower decay (Fig. 7). This may be due to decreased volume of DRP1‐preKO calyces (Fig. 2 F), though Ca2+ channel density was not affected (Table 2). Broadening of the presynaptic AP waveform is also a likely culprit (see Fig. 10), as a slower AP would result in a synaptic delay and increase Ca2+ influx, leading to slower, larger EPSCs.
Presynaptic mitochondria have two major roles: buffering of cytosolic calcium, and ATP production (Billups & Forsythe, 2002; Pathak et al. 2015; Vos et al. 2010). At the calyx, mitochondria have been shown to buffer Ca2+ at a concentration of >2 μM (Billups & Forsythe, 2002; Kim et al. 2005). Our estimates in control terminals suggest that free intraterminal Ca2+ reaches ∼1.5 μM during a short 200 ms train at 100 Hz but is substantially larger in DRP1‐preKO terminals, saturating the jRGRCO1a sensor. We propose that loss of DRP1 may reduce activity‐dependent calcium buffering by mitochondria. However, this hypothesis requires additional experimentation to be substantiated. An attractive possibility is that the assembly of mitochondria and SVs observed at the mature calyx of Held, so‐called donuts (Wimmer et al. 2006), have a functional role to coordinate Ca2+ buffering and SV replenishment during activity. These structures form after the onset of hearing, and are composed of mitochondrial clusters anchored near presynaptic release sites, surrounded by microscopic clusters of SVs (Wimmer et al. 2006; Perkins et al. 2010). Loss of these donut structures in DRP1‐preKO terminals correlates with increased free Ca2+, reduced SV RRP size and slower SV replenishment. To test causation, orthogonal approaches are needed to disrupt these SV‐mitochondrial structures.
Defects in RRP size and SV recycling
DRP1‐preKO synapses had a smaller estimated RRP size and were slower to recover following RRP depletion. These defects indicate that fewer release‐competent vesicles are available at rest, or that activity‐dependent SV recycling is impaired. These two mechanisms are not mutually exclusive, and both could be at play. Lack of rescue due to acute ATP restoration in paired recordings (Figs 10 and 11) suggests that an ATP deficit is not an underlying cause of the synaptic defects we observed at the calyx of Held. However, the RRP may require several rounds of recycling to recover and may require new SV biogenesis to generate fully competent SVs, which would require additional time outside of the recording window we were limited to. Our stimulation paradigm stimulated recycling of ∼3 RRP equivalents at each time point. Alternatively, long‐term chronic ATP deficit and/or calcium buffering deficiency in the presynaptic terminal due to DRP1 loss may have resulted in allostatic changes to the RRP size, which could not be reversed by acute ATP resupply.
Alternatively, RRP size and SV recovery at infected calyces may be directly dependent on DRP1 activity, as opposed to bioenergetic or calcium buffering defects from impaired mitochondria. Previously, DRP1 has been reported to form a complex with B‐cell lymphoma extra large (Bcl‐xL) and clathrin on synaptic vesicles, and has been suggested to directly mediate SV endocytosis (Li et al. 2013). Our results are equivocal in support of a direct role of DRP1 in SV recovery. Our results could support a direct role for DRP1 in SV recovery, since transmission was not completely rescued by ATP dialysis (Figs. 10 and 11) or augmented Ca2+ buffering (Fig. 8). But, aberrant SV morphology shown by Li et al. (2013) predicts a change in quantal size, which we did not observe in our DRP1‐preKO synapses (Fig. 3). Both dynamin‐dependent and ‐independent forms of endocytosis exist at the calyx of Held synapse, and endocytosis is strongly suppressed when dynamin is poisoned, e.g. by chemical inhibitors or non‐hydrolysable GTP analogues (Yamashita et al. 2005; Lou et al. 2008; Xu et al. 2008). It is likely that these chemical inhibitors used previously would also impair endogenous DRP1 function, as both proteins have GTPase activity. Additional studies at this synapse are needed to dissect whether DRP1 can facilitate activity‐dependent SV endocytosis.
DRP1 loss impairs postnatal synaptic maturation
An additional interpretation of the data in this study is that loss of DRP1 at the presynaptic terminal impeded overall synaptic maturation, halting development at an immature stage. Normally, the calyx of Held synapse undergoes significant activity‐dependent changes during the first 2 weeks after birth in order to support high frequency transmission. These changes include acceleration of the AP waveform, tighter Ca2+ to SV coupling, reduced SV release probability, increased capacity for SV recycling, increased presynaptic surface area, and SV clustering into ‘donuts’ in older animals (Taschenberger & von Gersdorff, 2000; Taschenberger et al. 2002; Leão et al. 2005; Wimmer et al. 2006; Renden & von Gersdorff, 2007). Multiple observations support arrested development in DRP1‐preKO synapses: (1) a slower AP waveform, (2) calyx morphology and SV distribution show less clustering of SV and a smaller terminal volume, (3) short‐term depression is enhanced, (4) P r is elevated and sensitive to EGTA‐AM treatment, and (5) transmission defects cannot be rescued by acute presynaptic dialysis of ATP. Mitochondria are targeted to sites of activity and modulate axonal outgrowth and synaptogenesis (Chang et al. 2006; Lee & Peng, 2008; Schwarz, 2013; Sheng, 2014). While invertebrate DRP1 knockout did not alter synaptic morphology at the Drosophila neuromuscular junction (Verstreken et al. 2005), axonal and dendritic outgrowth was impaired in forebrain synapses (Oettinghaus et al. 2016), and synaptogenesis was impaired (Uo et al. 2009). These results suggest that DRP1‐dependent regulation of mitochondrial morphology may be necessary for activity‐dependent presynaptic remodelling. An additional experiment that would clarify whether these defects are developmentally related would be to eliminate DRP1 after synaptic maturation has completed, e.g. by viral injection into 18‐ to 20‐day‐old mice, and recording at around 1 month of age.
Conclusion
We have utilized the calyx of Held to perform targeted genetic deletion of DRP1 specifically from the presynaptic terminal without disrupting the innervated postsynaptic cell. Using a combination of structural imaging and extensive electrophysiological analysis, we found that disruption of mitochondrial dynamics in the presynaptic terminal via genetic elimination of DRP1 results in two clear synaptic defects: RRP organization and SV recycling is strongly impaired, and cytosolic calcium accumulation is increased. Since these defects could not be rescued by acute replacement of physiological levels of ATP, we suggest that they are due to chronic disruption of normal mitochondrial function, which in turn causes dysregulation of the presynaptic machinery coordinating SV release and recycling.
Additional information
Competing interests
The authors declare no competing financial interests.
Author contributions
All work was performed in R.R.’s laboratory, University of Nevada, Reno School of Medicine. M.S. and R.R. initiated the study and designed experiments. M.S., H.D., C.S., J.G. and R.R. performed experiments. M.S., H.D., C.S. and R.R. analysed data. M.S. and R.R. wrote the manuscript. All authors have approved the final version of the manuscript and agree to be accountable for all aspects of the work, ensuring that questions related to the accuracy or integrity of any part of the work are appropriately investigated and resolved. All persons designated as authors qualify for authorship and all those who qualify for authorship are listed.
Funding
Research reported in this publication was supported by National Institute of General Medical Sciences of the National Institutes of Health under grant number P20GM103554, and office of the Vice‐President for Research and Innovation at University of Nevada, Reno.
Acknowledgements
We thank Dr Ken Nakamura and Dr Hiromi Sesaki for providing DRP1fl/fl animals. Thanks to Janice Bautista and Katie Fisher for viral plasmid preparation, and viral packaging of rAAV‐Cre‐GFP. Thanks to Reilly McGwire for analysis of jRGECO1a data. We thank Dr Greg Macleod and Dr Thomas Schwarz for helpful discussion and comments on the manuscript.
Biography
Mahendra Singh obtained his PhD from National Institute of Mental Health and Neuroscience, Bangalore India. Thereafter he joined Robert Renden's lab as a postdoctoral fellow in the Department of Physiology and Cell Biology, University of Nevada. His primary research in the lab is focused on understanding the role of presynaptic mitochondria on the synaptic vesicle release profile at the calyx of Held.

Edited by: Kim Barrett & Ian Forsythe
References
- Abraham NM, Egger V, Shimshek DR, Renden R, Fukunaga I, Sprengel R, Seeburg PH, Klugmann M, Margrie TW, Schaefer AT & Kuner T (2010). Synaptic inhibition in the olfactory bulb accelerates odor discrimination in mice. Neuron 65, 399–411. [DOI] [PMC free article] [PubMed] [Google Scholar]
- Alnaes E & Rahamimoff R (1975). On the role of mitochondria in transmitter release from motor nerve terminals. J Physiol 248, 285–306. [DOI] [PMC free article] [PubMed] [Google Scholar]
- Awatramani GB, Price GD & Trussell LO (2005). Modulation of transmitter release by presynaptic resting potential and background calcium levels. Neuron 48, 109–121. [DOI] [PubMed] [Google Scholar]
- Benard G, Bellance N, Jose C, Melser S, Nouette‐Gaulain K & Rossignol R (2010). Multi‐site control and regulation of mitochondrial energy production. Biochim Biophys Acta 1797, 698–709. [DOI] [PubMed] [Google Scholar]
- Berthet A, Margolis EB, Zhang J, Hsieh I, Zhang J, Hnasko TS, Ahmad J, Edwards RH, Sesaki H, Huang EJ & Nakamura K (2014). Loss of mitochondrial fission depletes axonal mitochondria in midbrain dopamine neurons. J Neurosci 34, 14304–14317. [DOI] [PMC free article] [PubMed] [Google Scholar]
- Billups B (2005). Colocalization of vesicular glutamate transporters in the rat superior olivary complex. Neurosci Lett 382, 66–70. [DOI] [PubMed] [Google Scholar]
- Billups B & Forsythe ID (2002). Presynaptic mitochondrial calcium sequestration influences transmission at mammalian central synapses. J Neurosci 22, 5840–5847. [DOI] [PMC free article] [PubMed] [Google Scholar]
- Chang DTW, Honick AS & Reynolds IJ (2006). Mitochondrial trafficking to synapses in cultured primary cortical neurons. J Neurosci 26, 7035–7045. [DOI] [PMC free article] [PubMed] [Google Scholar]
- Chen H & Chan DC (2009). Mitochondrial dynamics—fusion, fission, movement, and mitophagy—in neurodegenerative diseases. Hum Mol Genet 18, 169–176. [DOI] [PMC free article] [PubMed] [Google Scholar]
- Chen Z, Cooper B, Kalla S, Varoqueaux F & Young SM (2013). The Munc13 proteins differentially regulate readily releasable pool dynamics and calcium‐dependent recovery at a central synapse. J Neurosci 33, 8336–8351. [DOI] [PMC free article] [PubMed] [Google Scholar]
- Dana H, Mohar B, Sun Y, Narayan S, Gordus A, Hasseman JP, Tsegaye G, Holt GT, Hu A, Walpita D, Patel R, Macklin JJ, Bargmann CI, Ahrens MB, Schreiter ER, Jayaraman V, Looger LL, Svoboda K & Kim DS (2016). Sensitive red protein calcium indicators for imaging neural activity. Elife 5, 413. [DOI] [PMC free article] [PubMed] [Google Scholar]
- Devine MJ & Kittler JT (2018). Mitochondria at the neuronal presynapse in health and disease. Nat Rev Neurosci 19, 63–80. [DOI] [PubMed] [Google Scholar]
- Dondzillo A, Sätzler K, Horstmann H, Altrock WD, Gundelfinger ED & Kuner T (2010). Targeted three‐dimensional immunohistochemistry reveals localization of presynaptic proteins Bassoon and Piccolo in the rat calyx of Held before and after the onset of hearing. J Comp Neurol 518, 1008–1029. [DOI] [PubMed] [Google Scholar]
- Egger V & Stroh O (2009). Calcium buffering in rodent olfactory bulb granule cells and mitral cells. J Physiol 587, 4467–4479. [DOI] [PMC free article] [PubMed] [Google Scholar]
- Elmqvist D & Quastel DM (1965). A quantitative study of end‐plate potentials in isolated human muscle. J Physiol 178, 505–529. [DOI] [PMC free article] [PubMed] [Google Scholar]
- Fedchyshyn MJ & Wang L‐YY (2005). Developmental transformation of the release modality at the calyx of Held synapse. J Neurosci 25, 4131–4140. [DOI] [PMC free article] [PubMed] [Google Scholar]
- Fedchyshyn MJ & Wang L‐Y (2007). Activity‐dependent changes in temporal components of neurotransmission at the juvenile mouse calyx of Held synapse. J Physiol 581, 581–602. [DOI] [PMC free article] [PubMed] [Google Scholar]
- Fukumitsu K, Hatsukano T, Yoshimura A, Heuser J, Fujishima K & Kengaku M (2016). Mitochondrial fission protein Drp1 regulates mitochondrial transport and dendritic arborization in cerebellar Purkinje cells. Mol Cell Neurosci 71, 56–65. [DOI] [PubMed] [Google Scholar]
- Hoffpauir BK, Kolson DR, Mathers PH & Spirou GA (2010). Maturation of synaptic partners: functional phenotype and synaptic organization tuned in synchrony. J Physiol 588, 4365–4385. [DOI] [PMC free article] [PubMed] [Google Scholar]
- Hosoi N, Sakaba T & Neher E (2007). Quantitative analysis of calcium‐dependent vesicle recruitment and its functional role at the calyx of Held synapse. J Neurosci 27, 14286–14298. [DOI] [PMC free article] [PubMed] [Google Scholar]
- Hubley MJ, Locke BR & Moerland TS (1996). The effects of temperature, pH, and magnesium on the diffusion coefficient of ATP in solutions of physiological ionic strength. Biochim Biophys Acta 1291, 115–121. [DOI] [PubMed] [Google Scholar]
- Jolivet R, Coggan JS, Allaman I & Magistretti PJ (2015). Multi‐timescale modeling of activity‐dependent metabolic coupling in the neuron‐glia‐vasculature ensemble. PLoS Comput Biol 11, e1004036. [DOI] [PMC free article] [PubMed] [Google Scholar]
- Kaeser PS & Regehr WG (2017). The readily releasable pool of synaptic vesicles. Curr Opin Neurobiol 43, 63–70. [DOI] [PMC free article] [PubMed] [Google Scholar]
- Kageyama Y, Zhang Z, Roda R, Fukaya M, Wakabayashi J, Wakabayashi N, Kensler TW, Reddy PH, Iijima M & Sesaki H (2012). Mitochondrial division ensures the survival of postmitotic neurons by suppressing oxidative damage. J Cell Biol 197, 535–551. [DOI] [PMC free article] [PubMed] [Google Scholar]
- Kann O & Kovács R (2007). Mitochondria and neuronal activity. Am J Physiol Cell Physiol 292, 641–657. [DOI] [PubMed] [Google Scholar]
- Kempf C, Staudt T, Bingen P, Horstmann H, Engelhardt J, Hell SW & Kuner T (2013). Tissue multicolor STED nanoscopy of presynaptic proteins in the calyx of Held. PLoS One 8, e62893. [DOI] [PMC free article] [PubMed] [Google Scholar]
- Kim M‐H, Korogod N, Schneggenburger R, Ho W‐K & Lee SH (2005). Interplay between Na+/Ca2+ exchangers and mitochondria in Ca2+ clearance at the calyx of Held. J Neurosci 25, 6057–6065. [DOI] [PMC free article] [PubMed] [Google Scholar]
- Körber C & Kuner T (2016). Molecular machines regulating the release probability of synaptic vesicles at the active zone. Front Synaptic Neurosci 8, 5. [DOI] [PMC free article] [PubMed] [Google Scholar]
- Leão RM, Kushmerick C, Pinaud R, Renden R, Li G‐L, Taschenberger H, Spirou G, Levinson SR & von Gersdorff H (2005). Presynaptic Na+ channels: locus, development, and recovery from inactivation at a high‐fidelity synapse. J Neurosci 25, 3724–3738. [DOI] [PMC free article] [PubMed] [Google Scholar]
- Lee CW & Peng HB (2008). The function of mitochondria in presynaptic development at the neuromuscular junction. Mol Biol Cell 19, 150–158. [DOI] [PMC free article] [PubMed] [Google Scholar]
- Le Masson G, Przedborski S & Abbott LF (2014). A computational model of motor neuron degeneration. Neuron 83, 975–988. [DOI] [PMC free article] [PubMed] [Google Scholar]
- Li H, Alavian KN, Lazrove E, Mehta N, Jones A, Zhang P, Licznerski P, Graham M, Uo T, Guo J, Rahner C, Duman RS, Morrison RS & Jonas EA (2013). A Bcl‐xL‐Drp1 complex regulates synaptic vesicle membrane dynamics during endocytosis. Nat Cell Biol 15, 773–785. [DOI] [PMC free article] [PubMed] [Google Scholar]
- Li Z, Okamoto K‐I, Hayashi Y & Sheng M (2004). The importance of dendritic mitochondria in the morphogenesis and plasticity of spines and synapses. Cell 119, 873–887. [DOI] [PubMed] [Google Scholar]
- Lin MZ & Schnitzer MJ, (2016). Genetically encoded indicators of neuronal activity. Nat Neurosci 19, 1142–1153. [DOI] [PMC free article] [PubMed] [Google Scholar]
- Lou X, Paradise S, Ferguson SM & De Camilli P (2008). Selective saturation of slow endocytosis at a giant glutamatergic central synapse lacking dynamin 1. Proc Natl Acad Sci U S A 105, 17555–17560. [DOI] [PMC free article] [PubMed] [Google Scholar]
- Lucas SJ, Michel CB, Marra V, Smalley JL, Hennig MH, Graham BP & Forsythe ID, (2018). Glucose and lactate as metabolic constraints on presynaptic transmission at an excitatory synapse. J Physiol 596, 1699–1721. [DOI] [PMC free article] [PubMed] [Google Scholar]
- Lujan B, Kushmerick C, Das Banerjee T, Dagda RK & Renden R (2016). Glycolysis selectively shapes the presynaptic action potential waveform. J Neurophysiol 116, 2523–2540. [DOI] [PMC free article] [PubMed] [Google Scholar]
- Mahfooz K, Singh M, Renden R & Wesseling JF (2016). A well‐defined readily releasable pool with fixed capacity for storing vesicles at calyx of Held. PLoS Comput Biol 12, e1004855. [DOI] [PMC free article] [PubMed] [Google Scholar]
- Maravall M, Mainen ZF, Sabatini BL & Svoboda K (2000). Estimating intracellular calcium concentrations and buffering without wavelength ratioing. Biophys J 78, 2655–2667. [DOI] [PMC free article] [PubMed] [Google Scholar]
- Mishra P & Chan DC (2016). Metabolic regulation of mitochondrial dynamics. J Cell Biol 212, 379–387. [DOI] [PMC free article] [PubMed] [Google Scholar]
- National Research Council (2011). Guide for the Care and Use of Laboratory Animals The National Academies Press, Washington, DC, 10.17226/12910. [DOI]
- Neher E (2015). Merits and limitations of vesicle pool models in view of heterogeneous populations of synaptic vesicles. Neuron 87, 1131–1142. [DOI] [PubMed] [Google Scholar]
- Oettinghaus B, Schulz JM, Restelli LM, Licci M, Savoia C, Schmidt A, Schmitt K, Grimm A, Morè L, Hench J, et al (2016). Synaptic dysfunction, memory deficits and hippocampal atrophy due to ablation of mitochondrial fission in adult forebrain neurons. Cell Death Differ 23, 18–28. [DOI] [PMC free article] [PubMed] [Google Scholar]
- Otera H & Mihara K (2011). Discovery of the membrane receptor for mitochondrial fission GTPase Drp1. Small GTPases 2, 167–172. [DOI] [PMC free article] [PubMed] [Google Scholar]
- Pathak D, Shields LY, Mendelsohn BA, Haddad D, Lin W, Gerencser AA, Kim H, Brand MD, Edwards RH & Nakamura K (2015). The role of mitochondrially derived ATP in synaptic vesicle recycling. J Biol Chem 290, 22325–22336. [DOI] [PMC free article] [PubMed] [Google Scholar]
- Perkins GA, Tjong J, Brown JM, Poquiz PH, Scott RT, Kolson DR, Ellisman MH & Spirou GA (2010). The micro‐architecture of mitochondria at active zones: electron tomography reveals novel anchoring scaffolds and cristae structured for high‐rate metabolism. J Neurosci 30, 1015–1026. [DOI] [PMC free article] [PubMed] [Google Scholar]
- Pilpel N, Landeck N, Klugmann M, Seeburg PH & Schwarz MK (2009). Rapid, reproducible transduction of select forebrain regions by targeted recombinant virus injection into the neonatal mouse brain. J Neurosci Methods 182, 55–63. [DOI] [PubMed] [Google Scholar]
- Rangaraju V, Calloway N & Ryan TA (2014). Activity‐driven local ATP synthesis is required for synaptic function. Cell 156, 825–835. [DOI] [PMC free article] [PubMed] [Google Scholar]
- Renden R & von Gersdorff H (2007). Synaptic vesicle endocytosis at a CNS nerve terminal: faster kinetics at physiological temperatures and increased endocytotic capacity during maturation. J Neurophysiol 98, 3349–3359. [DOI] [PubMed] [Google Scholar]
- Rothman JS & Silver RA (2018). NeuroMatic: An integrated open‐source software toolkit for acquisition, analysis and simulation of electrophysiological data. Front Neuroinform 12, 1159–21. [DOI] [PMC free article] [PubMed] [Google Scholar]
- Rowland KC, Irby NK & Spirou GA (2000). Specialized synapse‐associated structures within the calyx of Held. J Neurosci 20, 9135–9144. [DOI] [PMC free article] [PubMed] [Google Scholar]
- Sabatini BL, Oertner TG & Svoboda K (2002). The life cycle of Ca2+ ions in dendritic spines. Neuron 33, 439–452. [DOI] [PubMed] [Google Scholar]
- Schneggenburger R, Meyer AC & Neher E (1999). Released fraction and total size of a pool of immediately available transmitter quanta at a calyx synapse. Neuron 23, 399–409. [DOI] [PubMed] [Google Scholar]
- Schwarz TL (2013). Mitochondrial trafficking in neurons. Cold Spring Harb Perspect Biol 5, a011304. [DOI] [PMC free article] [PubMed] [Google Scholar]
- Sheng Z‐H (2014). Mitochondrial trafficking and anchoring in neurons: New insight and implications. J Cell Biol 204, 1087–1098. [DOI] [PMC free article] [PubMed] [Google Scholar]
- Shields LY, Kim H, Zhu L, Haddad D, Berthet A, Pathak D, Lam M, Ponnusamy R, Diaz‐Ramirez LG, Gill TM, Sesaki H, Mucke L & Nakamura K (2015). Dynamin‐related protein 1 is required for normal mitochondrial bioenergetic and synaptic function in CA1 hippocampal neurons. Cell Death Dis 6, e1725. [DOI] [PMC free article] [PubMed] [Google Scholar]
- Smith HL, Bourne JN, Cao G, Chirillo MA, Ostroff LE, Watson DJ & Harris KM (2016). Mitochondrial support of persistent presynaptic vesicle mobilization with age‐dependent synaptic growth after LTP. Elife 5, 1–30. [DOI] [PMC free article] [PubMed] [Google Scholar]
- Spirou GA, Rowland KC & Berrebi AS (1998). Ultrastructure of neurons and large synaptic terminals in the lateral nucleus of the trapezoid body of the cat. J Comp Neurol 398, 257–272. [DOI] [PubMed] [Google Scholar]
- Tang Y‐G & Zucker RS (1997). Mitochondrial involvement in post‐tetanic potentiation of synaptic transmission. Neuron 18, 483–491. [DOI] [PubMed] [Google Scholar]
- Taschenberger H & von Gersdorff H (2000). Fine‐tuning an auditory synapse for speed and fidelity: developmental changes in presynaptic waveform, EPSC kinetics, and synaptic plasticity. J Neurosci 20, 9162–9173. [DOI] [PMC free article] [PubMed] [Google Scholar]
- Taschenberger H, Leão RM, Rowland KCKC, Spirou GAGA & von Gersdorff H (2002). Optimizing synaptic architecture and efficiency for high‐frequency transmission. Neuron 36, 1127–1143. [DOI] [PubMed] [Google Scholar]
- Taschenberger H, Scheuss V & Neher E (2005). Release kinetics, quantal parameters and their modulation during short‐term depression at a developing synapse in the rat CNS. J Physiol 568, 513–537. [DOI] [PMC free article] [PubMed] [Google Scholar]
- Uo T, Dworzak J, Kinoshita C, Inman DM, Kinoshita Y, Horner PJ & Morrison RS (2009). Drp1 levels constitutively regulate mitochondrial dynamics and cell survival in cortical neurons. Exp Neurol 218, 274–285. [DOI] [PMC free article] [PubMed] [Google Scholar]
- van der Bliek AM, Shen Q & Kawajiri S (2013). Mechanisms of mitochondrial fission and fusion. Cold Spring Harb Perspect Biol 5, a011072–a011072. [DOI] [PMC free article] [PubMed] [Google Scholar]
- Verstreken P, Ly CV, Venken KJT, Koh TW, Zhou Y & Bellen HJ (2005). Synaptic mitochondria are critical for mobilization of reserve pool vesicles at Drosophila neuromuscular junctions. Neuron 47, 365–378. [DOI] [PubMed] [Google Scholar]
- von Gersdorff H & Borst JGG (2002). Short‐term plasticity at the calyx of held. Nat Rev Neurosci 3, 53–64. [DOI] [PubMed] [Google Scholar]
- Vos M, Lauwers E & Verstreken P (2010). Synaptic mitochondria in synaptic transmission and organization of vesicle pools in health and disease. Front Synaptic Neurosci 2, 139. [DOI] [PMC free article] [PubMed] [Google Scholar]
- Wakabayashi J, Zhang Z, Wakabayashi N, Tamura Y, Fukaya M, Kensler TW, Iijima M & Sesaki H (2009). The dynamin‐related GTPase Drp1 is required for embryonic and brain development in mice. J Cell Biol 186, 805–816. [DOI] [PMC free article] [PubMed] [Google Scholar]
- Wang L‐YY & Kaczmarek LK (1998). High‐frequency firing helps replenish the readily releasable pool of synaptic vesicles. Nature 394, 384–388. [DOI] [PubMed] [Google Scholar]
- Wesseling JF & Lo DC (2002). Limit on the role of activity in controlling the release‐ready supply of synaptic vesicles. J Neurosci 22, 9708–9720. [DOI] [PMC free article] [PubMed] [Google Scholar]
- Wimmer VC, Horstmann H, Groh A & Kuner T (2006). Donut‐like topology of synaptic vesicles with a central cluster of mitochondria wrapped into membrane protrusions: a novel structure‐function module of the adult calyx of Held. J Neurosci 26, 109–116. [DOI] [PMC free article] [PubMed] [Google Scholar]
- Wong AYC, Graham BP, Billups B & Forsythe ID (2003). Distinguishing between presynaptic and postsynaptic mechanisms of short‐term depression during action potential trains. J Neurosci 23, 4868–4877 [DOI] [PMC free article] [PubMed] [Google Scholar]
- Wu SH & Oertel D (1984. Intracellular injection with horseradish peroxidase of physiologically characterized stellate and bushy cells in slices of mouse anteroventral cochlear nucleus. J Neurosci 4, 1577–1588. [DOI] [PMC free article] [PubMed] [Google Scholar]
- Xu J, McNeil B, Wu W, Nees D, Bai L & Wu L‐G (2008). GTP‐independent rapid and slow endocytosis at a central synapse. Nat Neurosci 11, 45–53. [DOI] [PubMed] [Google Scholar]
- Yamashita T (2005). Vesicle Endocytosis Requires Dynamin‐Dependent GTP Hydrolysis at a Fast CNS Synapse. Science 307, 124–127. [DOI] [PubMed] [Google Scholar]
- Youssoufian M, Couchman K, Shivdasani MN, Paolini AG & Walmsley B (2008). Maturation of auditory brainstem projections and calyces in the congenitally deaf (dn/dn) mouse. J Comp Neurol 506, 442–451. [DOI] [PubMed] [Google Scholar]