The taxonomic composition and functional potential of animal gut microbiota in deep-sea environments remain largely unknown. Here, by performing comparative metagenomics, we suggest that the gut microbial compositions of two Hirondellea gigas populations from the Mariana Trench and the Japan Trench have undergone significant divergence. Through analyses of functional potentials and microbe-microbe correlations, our findings shed light on the contributions of animal gut microbiota to host adaptation to hadal environments.
KEYWORDS: amphipod, gut microbiota, hadal trench, metagenomics
ABSTRACT
Hadal environments sustain diverse microorganisms. A few studies have investigated hadal microbial communities consisting of free-living or particle-associated bacteria and archaea. However, animal-associated microbial communities in hadal environments remain largely unexplored, and comparative analyses of animal gut microbiota between two isolated hadal environments have never been done so far. In the present study, 228 Gb of gut metagenomes of the giant amphipod Hirondellea gigas from two hadal trenches, the Mariana Trench and Japan Trench, were sequenced and analyzed. Taxonomic analysis identified 49 microbial genera commonly shared by the gut microbiota of the two H. gigas populations. However, the results of statistical analysis, in congruency with the alpha and beta diversity analyses, revealed significant differences in gut microbial composition across the two trenches. Abundance variation of Psychromonas, Propionibacterium, and Pseudoalteromonas species was observed. Microbial cooccurrence was demonstrated for microbes that were overrepresented in the Mariana trench. Comparison of functional potential showed that the percentage of carbohydrate metabolic genes among the total microbial genes was significantly higher in the guts of H. gigas specimens from the Mariana Trench. Integrating carbon input information and geological characters of the two hadal trenches, we propose that the differences in the community structure might be due to several selective factors, such as environmental variations and microbial interactions.
IMPORTANCE The taxonomic composition and functional potential of animal gut microbiota in deep-sea environments remain largely unknown. Here, by performing comparative metagenomics, we suggest that the gut microbial compositions of two Hirondellea gigas populations from the Mariana Trench and the Japan Trench have undergone significant divergence. Through analyses of functional potentials and microbe-microbe correlations, our findings shed light on the contributions of animal gut microbiota to host adaptation to hadal environments.
INTRODUCTION
Hadal trenches at water depths below 6,000 m constitute the deepest and least-explored biosphere on Earth (1–3). Hadal trenches are formed when old ocean crust from one tectonic plate is pushed beneath another plate, causing the seafloor and outermost crust to bend, generating a V-type depression (4). Hadal environments are characterized by elevated hydrostatic pressure, although the salinity, temperature, dissolved oxygen, and nutrients are comparable to those in abyssal depths (3, 5).
Studies have revealed a variety of metazoan organisms thriving in hadal environments, such as fish, polychaetes, and amphipods (6–9). The richness of these organisms is speculated to originate from the abyssal plains (10, 11). These organisms may play important roles in biogeochemical cycling within the hadal biosphere. Based on records in deep-sea sampling, amphipods (Arthropoda: Crustacea: Peracarida: Amphipoda) are one of the dominant carrion feeders in hadal habitats, and scavenging amphipods have been studied from deep-sea depths ranging from 4,855 to 10,897 m in a number of trenches (6–9).
Hadal environments also sustain diverse microorganisms, mainly consisting of bacteria and archaea, either free living or host associated (5, 12–14). Despite the well-recognized importance of these microbes with regard to their biogeochemical roles in hadal zones, their adaptive strategies remain poorly studied. In recent research studies, the aquatic microbial communities in the Mariana Trench were investigated (12, 13), and the microbial decomposition of organic matter was found to be a common trait of trench sediment ecosystems (14). However, despite the common origin and shared features of hadal trenches, regional variation often leads to distinct combinations of physical and chemical parameters and the existence of microorganisms with unique adaptive strategies. In particular, the composition and functional potential of animal-associated microbial communities in hadal environments remain largely unexplored, and comparisons of microbial communities in the animal guts of two isolated hadal environments have never been attempted so far.
Animal (including human) gut microbial composition is affected by long-term dietary input (15), and the animal gut microbiota can take part in several aspects of normal host physiology, including nutritional status and environmental adaptation (16, 17). In the present study, we compared populations of the giant amphipod Hirondellea gigas from the Mariana Trench and the Japan Trench with regard to their phylogenetic relationships and gut microbial compositions. Moreover, comparison of functional potentials was conducted to explore the potential mechanisms governing the divergence of gut microbial composition.
RESULTS
Phylogenetic analyses of the host.
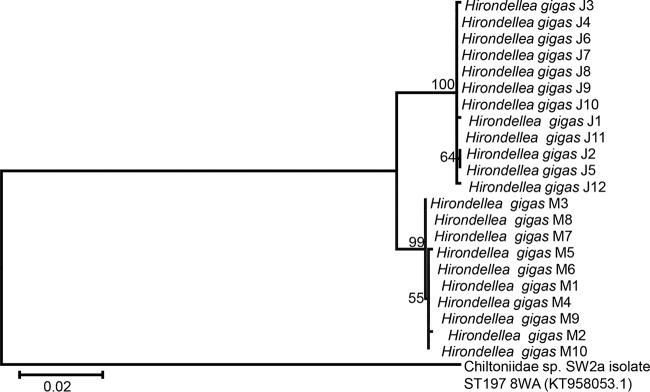
Included in the present study were 10 H. gigas individuals collected from the Mariana Trench (four from one station in the Challenger Deep and six from one station in the Sirena Deep) and 12 H. gigas individuals from one station in the Japan Trench. DNA extracted from the gut was used to sequence both the hosts and associated microbes, generating metagenomic data sets totaling 228 Gb. Information on the number of reads and the assemblies of Illumina sequencing is summarized in Table S1. Phylogenetic analysis for the amphipods was performed based on the cytochrome c oxidase subunit I (COI) genes extracted from 22 metagenomes. Maximum-likelihood analysis of the nearly complete COI gene DNA sequences (>1,400 bp) produced a well-supported tree (Fig. 1). The amphipod Chiltoniidae sp. SW2a isolate ST197 8WA, which is the closest relative of H. gigas with a nearly complete COI gene sequence available in the NCBI database, was used to root the tree. Support values from the bootstrap analysis calculated under a single model of sequence evolution indicated that the topology formed by the major branches was well-supported. Although the COI gene sequences shared >99% identity across all H. gigas individuals, the Mariana Trench H. gigas individuals were clearly clustered separately from the Japan Trench H. gigas individuals (Fig. 1). On the other hand, the Challenger Deep H. gigas individuals (M1 to M4) could not be separated from those of the Sirena Deep (M5 to M10) (Fig. 1). These results indicated that the geological isolation may have generated genetic divergence between H. gigas individuals from the two trenches, whereas no divergence was evident between the two locations within the Mariana Trench.
FIG 1.
Phylogenetic relationships between individuals of the amphipod Hirondellea gigas. The maximum-likelihood tree was constructed based on the nearly full-length cytochrome c oxidase subunit I (COI) genes (>1,400 bp). The COI genes of the H. gigas individuals share >99% similarity across all specimens examined. The bootstrap values are based on 1,000 permutations, and the COI gene from the amphipod Chiltoniidae sp. SW2a isolate ST197 8WA was used as the root. The length of the tree branch in the horizontal dimension indicates the amount of evolutionary lineage change, while the bar at the bottom of the figure indicates a scale for such changes. M1 to M4 refer to Challenger Deep H. gigas specimens, M5 to M10 refer to Sirena Deep H. gigas specimens, and J1 to J12 refer to Japan Trench H. gigas specimens.
Community structure of the gut microbiota and alpha diversity.
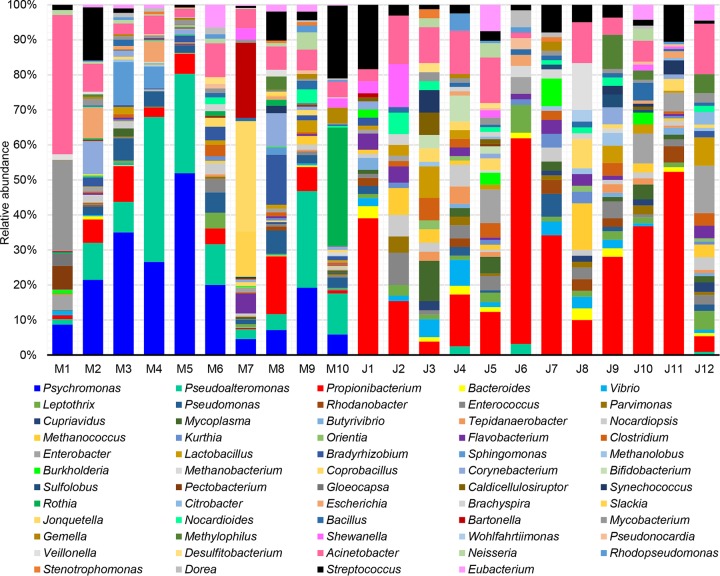
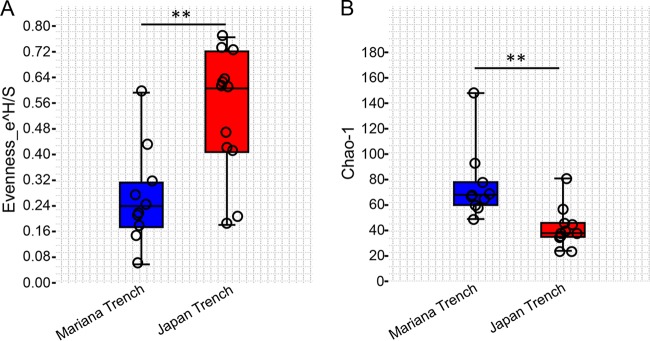
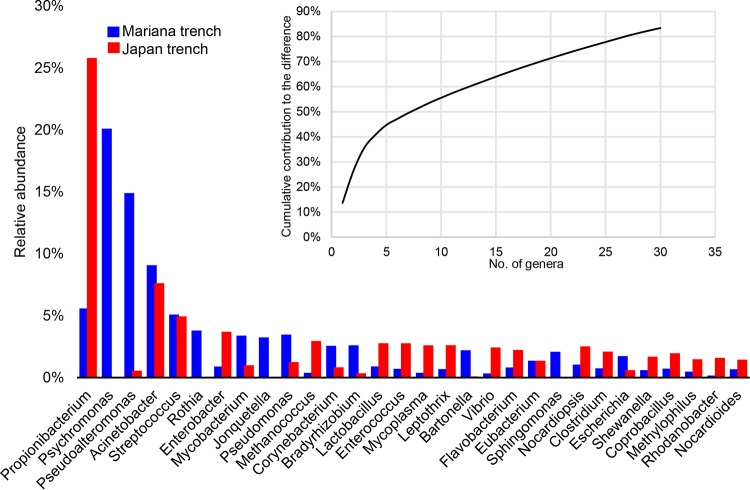
Taxonomic classification based on unique clade-specific marker genes revealed in total 10 phyla for all the gut microbial communities, including Proteobacteria, Actinobacteria, Bacteroidetes, Cyanobacteria, Firmicutes, Spirochaetes, Synergistetes, Tenericutes, Crenarchaeota, and Euryarchaeota (Fig. S1). Proteobacteria were further broken down into Alphaproteobacteria, Betaproteobacteria, and Gammaproteobacteria (Fig. S1). Two-tailed Student’s t-tests (after a Shapiro-Wilk test to confirm the normal distribution of these data) indicated that eight taxa, namely, Alphaproteobacteria, Betaproteobacteria, Gammaproteobacteria, Actinobacteria, Bacteroidetes, Firmicutes, Tenericutes, and Euryarchaeota, showed significant changes (P < 0.05) between the Mariana Trench and the Japan Trench. At the genus level, a total of 59 genera were identified (Fig. 2), of which 49 were shared by the two H. gigas populations, six were unique for the Mariana Trench, and four were unique for the Japan Trench. Overall, Propionibacterium, Acinetobacter, and Streptococcus were more abundant than other genera in most of the gut microbiota. Psychromonas was the most enriched genus in the gut microbiota of the Mariana Trench H. gigas individuals, whereas it was completely absent in the Japan Trench H. gigas individuals (Fig. 2). Two-tailed Student’s t tests (after a Shapiro-Wilk test to confirm the normal distribution of these data) demonstrated significant differences of 11 genera across gut microbiota of the two trenches (P < 0.05), including Psychromonas, Pseudoalteromonas, Pseudomonas, Bacteroides, Propionibacterium, Vibrio, Rhodanobacter, Leptothrix, Bradyrhizobium, Butyrivibrio, and Enterococcus. Alpha diversity indexes calculated based on the genus number and abundance revealed significantly higher (two-tailed Student’s t test after Shapiro-Wilk test to confirm the normal distribution of these data) median evenness (Fig. 3A) in the gut microbiota of the Japan Trench H. gigas, whereas the Chao diversity (Fig. 3B) was higher in the gut microbiota of the Mariana Trench H. gigas. These results indicated that the composition of the gut microbiota differs between the H. gigas inhabiting the two trenches.
FIG 2.
Genus-level microbial composition based on maker gene analysis. The genera were identified by searching against the MetaPhlAn2 marker gene database, using normalized prokaryotic reads as input. The query and hit sequences had more than 95% similarity.
FIG 3.
Alpha diversity of the gut microbiota based on genera composition and relative abundance. Evenness (A) and Chao (B) indexes are displayed by box and jitter plot. ** indicates a significant difference (two-tailed Student’s t test following a Shapiro-Wilk test to confirm the normal distribution of these data; P < 0.01) between the gut microbiota of the two H. gigas populations.
Beta diversity of the gut microbiota.
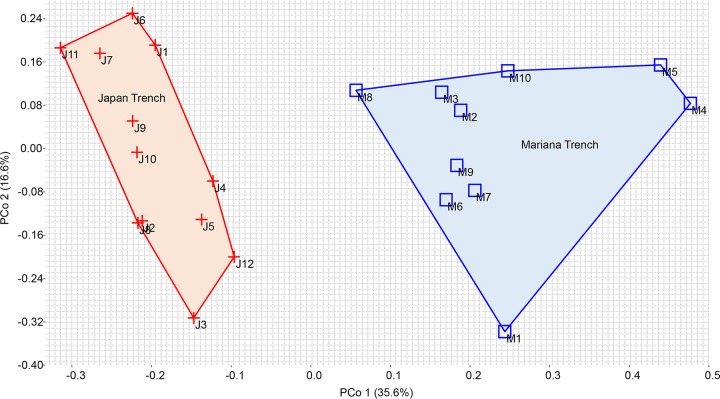
To investigate the taxonomic structural similarity between the gut microbiota of the two H. gigas populations, principal-coordinate analysis (PCoA) based on the relative abundances of the genera was performed (Fig. 4). The gut microbiota of the Mariana Trench and the Japan Trench formed two distinct groups, which were clearly separated by principal coordinate 1 (PCo1) and explained 35.6% of the variance (Fig. 4). Within the Mariana Trench, the gut microbiota of the Challenger Deep (M1 to M4) were clustered together with those of the Sirena Deep (M5 to M10) by either PCo1 or PCo2 (Fig. 4). Moreover, similarity percentages (SIMPER) analysis was performed to evaluate the contributions of the genera to the differences between gut microbial compositions from the two H. gigas populations (Fig. 5). The genera with the top 30 contributions are shown, which contributed up to 83% of the difference (Fig. 5). Specifically, Psychromonas, Propionibacterium, and Pseudoalteromonas had significantly higher contributions than those of the other genera (Fig. 5). The average relative abundance indicated that 13 of the 30 genera had more than 5-fold changes between the gut microbiota of the two H. gigas populations.
FIG 4.
Beta diversity of the gut microbiota from different H. gigas individuals. Bray-Curtis distances were calculated based on the genus composition and relative abundance and visualized through PCoA. Eigenvalues (percentages of variance for the first two principal components) are shown in the figure. The lines around the samples are convex hulls. Significant difference of genus composition between the two sites was confirmed by one-way nonparametric multivariate analysis of variance (NPMANOVA) (F = 7.627, P = 0.0001).
FIG 5.
Top 30 genera ranked by their contributions to the difference between the two H. gigas populations. The contributions were analyzed through SIMPER analysis, and the average values of the relative abundances among different H. gigas individuals are shown.
Microbe-microbe correlations.
To evaluate the robustness of the differences between the gut microbiota of the two H. gigas populations, microbe-microbe correlation analysis was performed at the genus level (Fig. S2). Of the 59 detected genera, 19 showed relatively higher average abundances in the Mariana Trench, whereas 40 showed relatively higher average abundances in the Japan Trench. A Spearman rank analysis was used to investigate the interactions between different genera, which revealed four significant positive correlations, involving Slackia, Penicillium, Jonquetella, Pseudoalteromonas, and Psychromonas (Fig. S2). All five genera were overrepresented in the Mariana trench, and no correlations between genera overrepresented in different trenches was observed. The microbe-microbe correlations were, to some extent, consistent with the above-mentioned analyses of alpha diversity, PCoA, and SIMPER, where the gut microbiota of the two trenches formed two distinct groups in terms of the taxonomic composition.
Comparison of functional potentials.
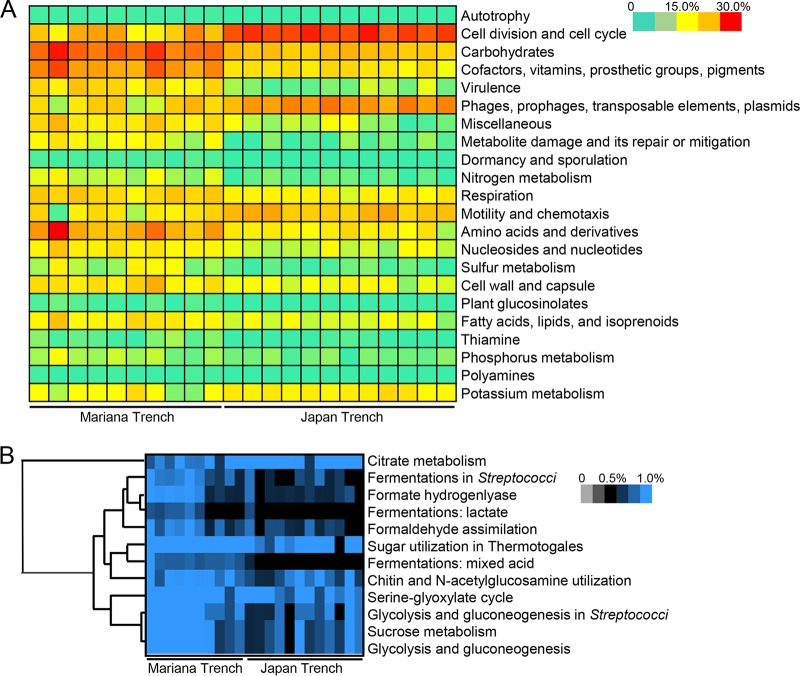
Given that the Japan Trench is much closer to the coast than the Mariana Trench and the two trenches are supplied with distinct carbon inputs, we speculated that metabolic pathways in the gut microbiota may differ between H. gigas individuals from the two trenches. The SEED1 functional classification comparison revealed different metabolic profiles between the gut microbiota of the two H. gigas populations. In total, 22 functional categories showed significantly different profiles (Student’s t test following a Shapiro-Wilk test to confirm the normal distribution of these data; P < 0.01), such as genes in the categories of “autotrophy,” “cell division and cell cycle,” and “carbohydrate metabolism” (Fig. 6A). Specifically, the relative abundance of carbohydrate metabolic genes among the total gut microbial genes was significantly higher in the Mariana Trench than that in the Japan Trench (Fig. 6A). Further analysis of the genes for carbohydrate metabolism by classifying these genes to a lower SEED level (SEED2) revealed the relative abundance (percentage in the total microbial genes) of genes involved in 44 different types of carbohydrate utilization. Statistical analysis (Student’s t test following a Shapiro-Wilk test to confirm the normal distribution of these data; P < 0.01) revealed genes for 12 types of carbohydrate metabolism with significantly changed relative abundances (P < 0.01) (Fig. 6B), including the utilization of the intermediate metabolites citrate, sucrose, lactate, mixed acid, and formate. Eleven of the 12 categories of genes were enriched in the gut microbiota of the Mariana Trench H. gigas individuals, with 1.5- to 10-fold changes. Consistent with the SEED classification, Kyoto Encyclopedia of Genes and Genomes (KEGG) annotation revealed a number of genes specific for gut microbiota from the Mariana Trench amphipods, such as genes involved in UDP sugar metabolism via the phosphoenolpyruvate (PEP)-dependent phosphotransferase system (PTS) (Fig. S3) and genes for fermentation (e.g., l-lactate dehydrogenase [Enzyme Commission (EC) number 1.1.1.27], aldehyde dehydrogenase [NAD(P)+] [EC 1.2.1.5], and alcohol dehydrogenase [EC 1.1.2.8]) (Fig. S4). Furthermore, we identified a complex of formate hydrogenlyase in the gut microbiota of the Mariana Trench H. gigas population (Table S2), and these genes probably belonged to Psychromonas species, which are missing in the gut microbiota of the Japan Trench H. gigas population.
FIG 6.
Metabolic profiles of the gut microbiota based on SEED classification. (A) Significantly changed (two-tailed Student’s t test following a Shapiro-Wilk test to confirm the normal distribution of these data; P < 0.01) functional potentials, as revealed by the functional profile at SEED1 level. (B) Significantly changed SEED2 functional potentials belonging to the carbohydrate metabolism category. In total, 12 functional potentials showed significant changes between the gut microbiota of the two H. gigas populations, and 11 of them had higher abundance in the Mariana Trench H. gigas population.
DISCUSSION
We used comparative metagenomics to characterize the gut microbiota of the giant amphipod H. gigas from two hadal trenches, the Mariana Trench and Japan Trench. Our results revealed a significant difference between the two H. gigas populations, as determined by statistical analysis, as well as by alpha and beta diversity analyses of the taxonomic compositions. In addition, comparative analyses of the functional potentials revealed preliminary reasons for the gut microbial divergence between the two trenches.
So far, only two studies have analyzed the difference of microbial composition between the Mariana Trench and the Japan Trench (12, 18). Based on the comparison of water microbial community from these two locations, the predominance of marine group I (MGI) Thaumarchaea in the shallow waters above 500 m was found in the Japan Trench but not in the Mariana Trench; Nitrospina overcame Nitrospira in the Japan Trench in the predominant nitrite-oxidizing bacterial populations in hadal waters, whereas the opposite trend has been found in the Challenger Deep. In the present study, Psychromonas, Propionibacterium, and Pseudoalteromonas contributed most to the difference between the two H. gigas populations. The genus Psychromonas includes piezophilic (high-pressure adapted), halophilic (high-salt adapted), and psychrophilic (low-temperature adapted) species that are widely distributed in marine environments, including the polar zones (19, 20). A Psychromonas strain (CNPT3) has been isolated from the gut of a decaying amphipod collected at a depth of 5,700 m in the North Pacific Ocean (21), suggesting a close relationship between Psychromonas and amphipods in certain deep-sea habitats. In a more recent study of the amphipod gut microbiota from the Mariana Trench, the draft genome of a Psychromonas strain (CDP1) was analyzed, which revealed a significant genome reduction driven by host association (22). Members of the genus Propionibacterium were found in the gut of the bark beetle Dendroctonus rhizophagus and are persistent in all life stages of this insect (23). Members of Pseudoalteromonas were detected in the gut microbiota of a variety of marine animals, such as the sea cucumber Apostichopus japonicus (24) and the small abalone Haliotis diversicolor (25). Thus, members of Psychromonas, Pseudoalteromonas, and Propionibacterium may possess features of animal gut colonization. Remarkably, Psychromonas and Pseudoalteromonas were overrepresented in the Mariana Trench H. gigas population, and significant associations between these two genera were identified. Members of these two genera share common features, such as unsaturated fatty acids and/or genes involved in membrane fluidity (26), which facilitate cold and pressure adaptation and survival in deep-sea amphipods. However, the complete absence of Psychromonas species in the Japan Trench amphipods suggested that their function is dispensable or their counterparts have emerged in the guts of these amphipods.
To further understand H. gigas gut microbial diversification between the two trenches, analysis of functional potential was performed. The potential contribution of dietary input, reflected by the carbohydrate metabolic pathways in the gut microbial diversification, can be observed. Geographically, the Japan Trench runs from the Kuril Islands to the Bonin Islands, whereas the Mariana Trench is located in the western Pacific Ocean and is on average 200 km to the east of the Mariana Islands. Thus, the Mariana Trench is a greater distance from the nearest coast. The microbial communities in the Mariana Trench are supported by the internal recycling of organic carbon in the water, such as resuspended sediments (13), whereas the Japan Trench receives abundant organic matter in sinking particles from the surface water, a large portion of which comes from plankton (27). Consistently, the organic carbon content in the bottom of the Japan Trench is almost 9-fold higher than that of the Mariana Trench (28). Therefore, the difference in carbohydrate metabolic pathways could be interpreted as a result of different methods of organic carbon utilization. For example, the enrichment of mixed acids and fatty acids for metabolism may indicate exhaustive carbohydrate utilization (29). The phosphotransferase system (PTS) is a major mechanism used by bacteria for uptake of carbohydrates, particularly hexoses, hexitols, and disaccharides (30); the function of the PTS is inhibited by high concentration of several metabolizable PTS sugars (31); thus, the enrichment of PTS in the gut microbiota of the Mariana Trench amphipods is consistent with the low carbon content in the Mariana Trench. Moreover, the enrichment of formate hydrogenlyase genes is often linked to mixed acid and glucose fermentation, with formate, succinate, acetate, lactate, and ethanol as products (32). These findings point to the enrichment of particular carbohydrate pathways in the gut microbiota of the Mariana Trench amphipods. In summary, the significant differences in the abundances of gut microbes between the two H. gigas populations might be due to several selective factors, such as carbon content in external environments and microbial interactions.
MATERIALS AND METHODS
Sample collection.
H. gigas individuals were collected from the Challenger Deep in the Mariana Trench (11°22′11′′N, 142°35′25′′E) at a depth of 10,929 m, the Sirena Deep in the Mariana Trench (12°30′27′′N, 144°67′38′′E) at a depth of 7,929 m, and the Japan Trench near the triple junction (00°12′56′′N, 142°06′24′′E), at a depth of 9,149 m. The Mariana Trench samples were collected during the cruise of the Schmidt Ocean Institute in December 2014 (http://schmidtocean.org/cruise/expanding-mariana-trench-perspectives), whereas the samples from the Japan Trench were collected in June 2012 during the YK12-09 cruise of R/V Yokosuka (cruise principal investigator [PI], Takashi Toyofuku). The samples were obtained using landers and immediately frozen upon recovery at −80°C.
DNA extraction and metagenomic sequencing.
After microscopic observation and dissection of the 22 H. gigas individuals, DNA was extracted from the whole gut using the AllPrep DNA/RNA minikit (Qiagen, Germany), following standard protocols. Quality control of the DNA was carried out with a UV spectrophotometer (NanoDrop 2000; Thermo Fisher Scientific, San Jose, CA) based on the A260/A280 and A260/A230 values and agarose gel electrophoresis. The quantity of the DNA was calculated by Qubit fluorometric quantitation (Life Technologies, USA). A microbial short insert library (500-bp insert length) was constructed and sequenced using a HiSeq 2500 platform (Illumina) at Novogene Bioinformatics Technology Co., Ltd. (Beijing, China).
Metagenomic assembly and contig coverage calculation.
The NGS QC Toolkit (version 2.3.3) (33) was used to remove low-quality reads from raw metagenomic reads (2 × 125 bp). Specifically, reads containing bases with a quality score of <20 and those with a < 70% read length were removed, and automatic detection of the FASTQ variant was performed. The filtered paired-end reads were assembled on the MegaHit (version 1.0.2) platform (34), with kmer values from 21 to 121. The reads were mapped to the assembled contigs using the Bowtie 2 aligner (35). The coverage information was calculated and visualized using SAMtools (36). The gene coding sequences were predicted using Prodigal (version 2.60) (37) in the metagenomic mode.
Phylogenetic analysis.
Phylogenetic analysis of the amphipod individuals was performed based on nearly complete cytochrome c oxidase subunit I (COI) gene sequences, aligned to generate a final alignment with a length of 1,436 nucleotides. The alignment was imported into MEGA (version 7.0.21) (38) to construct a maximum-likelihood tree using the Jones-Taylor-Thornton model and a bootstrap replication number of 1,000.
Taxonomic and functional profiling.
The taxonomic structure of the gut microbial communities was determined using the software MetaPhlAn2, which relies on unique clade-specific marker genes identified from 3,000 reference genomes to profile community structure (39). Prokaryotic reads were extracted from the metagenomes by a BLASTx search against the NCBI NR prokaryotic gene database. Qualified and normalized prokaryotic reads (100,000 reads for each sample) were used as inputs of the MetaPhlAn2 analysis, and a 95% similarity cutoff was set. All of the marker gene sequences used for taxonomic analysis in the present study are annotated by BLASTx (E value, <1 × 10⁻⁷) against the Clusters of Orthologous Groups of proteins (COGs) database (version updated in 2014) (40) are listed in Table S3. The Evenness_eH/S (where H is Shannon's diversity index and S is the total number of species in the community) and Chao-1 indexes were calculated using PAST software (version 2.0) (41), based on relative abundance of all the detected genera. Principal coordinate analysis (PCoA) was performed using PAST software, based on Bray-Curtis distances of the microbial composition at the genus level. Microbe-microbe correlation analysis was performed based on the Spearman’s rank correlation coefficient test, and all genera were used as the input. Functional hierarchical comparison of the metagenomes was conducted using the SEED (42) functional classification system implemented in MEGAN (version 6.0) (43), where BLASTp (E value, <1 × 10⁻⁷) results against the NCBI nonredundant (nr) database (version updated in 2017) were used as the input. The protein-coding genes were also annotated by a BLASTp (E value, <1 × 10⁻⁷) search against the KEGG database (version updated in 2016) (44), and the metabolic pathways were visualized by using KEGG Mapper (https://www.genome.jp/kegg/mapper.html).
Statistical analysis.
A Shapiro-Wilk test and Levene’s test were used to confirm the normality and homogeneity of variances, respectively. For the normally distributed data, a two-tailed Student’s t test was performed to identify significantly changed items, including phyla, genera, and functional categories, between the gut microbiota of the two H. gigas populations. The P values were adjusted by Holm-Bonferroni sequential correction. SIMPER implemented in PAST software (version 2.0) (41) was performed to evaluate the contribution of each genus to the differences between gut microbial compositions from the two H. gigas populations. In addition, a significant difference in the genus composition between the two sites was confirmed by one-way nonparametric multivariate analysis of variance (NPMANOVA).
Supplementary Material
ACKNOWLEDGMENTS
This study was supported by grants from the National Key Research and Development Program of China (2018YFC0310603), the Strategic Priority Research Program of the Chinese Academy of Sciences (XDB06010102), and the Nature Science Foundation of China (U1301232).
Footnotes
Supplemental material for this article may be found at https://doi.org/10.1128/AEM.02032-18.
REFERENCES
- 1.Wolff T. 1959. The hadal community, an introduction. Deep Sea Res 6:95–124. doi: 10.1016/0146-6313(59)90063-2. [DOI] [Google Scholar]
- 2.Angel MV. 1982. Ocean trench conservation. Environmentalist 2:1–17. doi: 10.1007/BF02340472. [DOI] [Google Scholar]
- 3.Jamieson AJ, Fujii T, Mayor DJ, Solan M, Priede IG. 2010. Hadal trenches: the ecology of the deepest places on Earth. Trends Ecol Evol 25:190–197. doi: 10.1016/j.tree.2009.09.009. [DOI] [PubMed] [Google Scholar]
- 4.Harris PT, Macmillan-Lawler M, Rupp J, Baker EK. 2014. Geomorphology of the oceans. Mar Geol 352:4–24. doi: 10.1016/j.margeo.2014.01.011. [DOI] [Google Scholar]
- 5.Liu R, Wang L, Wei Y, Fang J. 2017. The hadal biosphere: Recent insights and new directions. Deep Sea Res Part 2. doi: 10.1016/j.dsr2.2017.04.015. [DOI] [Google Scholar]
- 6.Hessler RR, Isaacs JD, Mills EL. 1972. Giant amphipod from the abyssal Pacific Ocean. Science 175:636–663. doi: 10.1126/science.175.4022.636. [DOI] [PubMed] [Google Scholar]
- 7.Dahl E. 1979. Deep-sea carrion feeding amphipods—evolutionary patterns in niche adaptation. Oikos 33:167–175. doi: 10.2307/3543994. [DOI] [Google Scholar]
- 8.Thurston MH. 1979. Scavenging abyssal amphipods from the north-east Atlantic Ocean. Mar Biol 51:55–68. doi: 10.1007/BF00389031. [DOI] [Google Scholar]
- 9.Lacey NC, Rowden AA, Clark MR, Kilgallen NM, Linley T, Mayor DJ, Jamieson AJ. 2016. Community structure and diversity of scavenging amphipods from bathyal to hadal depths in three South Pacific trenches. Deep Sea Res Part 1 Oceanogr Res Pap 111:121–137. doi: 10.1016/j.dsr.2016.02.014. [DOI] [Google Scholar]
- 10.Wolff T. 1970. The concept of the hadal or ultra-abyssal fauna. Deep Sea Res and Oceanographic Abstracts 17:983–1003. doi: 10.1016/0011-7471(70)90049-5. [DOI] [Google Scholar]
- 11.Vinogradova NG. 1997. Zoogeography of the abyssal and hadal zones. Adv Mar Biol 32:325–387. doi: 10.1016/S0065-2881(08)60019-X. [DOI] [Google Scholar]
- 12.Nunoura T, Takaki Y, Hirai M, Shimamura S, Makabe A, Koide O, Kikuchi T, Miyazaki J, Koba K, Yoshida N, Sunamura M, Takai K. 2015. Hadal biosphere: insight into the microbial ecosystem in the deepest ocean on Earth. Proc Natl Acad Sci U S A 112:E1230–E1236. doi: 10.1073/pnas.1421816112. [DOI] [PMC free article] [PubMed] [Google Scholar]
- 13.Tarn J, Peoples LM, Hardy K, Cameron J, Bartlett DH. 2016. Identification of free-living and particle-associated microbial communities present in hadal regions of the Mariana trench. Front Microbiol 7:665. doi: 10.3389/fmicb.2016.00665. [DOI] [PMC free article] [PubMed] [Google Scholar]
- 14.Glud RN, Wenzhöfer F, Middelboe M, Oguri K, Turnewitsch R, Canfield DE, Kitazato H. 2013. High rates of microbial carbon turnover in sediments in the deepest oceanic trench on Earth. Nat Geosci 6:284–288. doi: 10.1038/ngeo1773. [DOI] [Google Scholar]
- 15.Smith CC, Snowberg LK, Caporaso JG, Knight R, Bolnick DI. 2015. Dietary input of microbes and host genetic variation shape among-population differences in stickleback gut microbiota. ISME J 9:2515–2526. doi: 10.1038/ismej.2015.64. [DOI] [PMC free article] [PubMed] [Google Scholar]
- 16.Clarke G, Stilling RM, Kennedy PJ, Stanton C, Cryan JF, Dinan TG. 2014. Minireview: Gut microbiota: the neglected endocrine organ. Mol Endocrinol 28:1221–1238. doi: 10.1210/me.2014-1108. [DOI] [PMC free article] [PubMed] [Google Scholar]
- 17.Dugas LR, Fuller M, Gilbert J, Layden BT. 2016. The obese gut microbiome across the epidemiologic transition. Emerg Themes Epidemiol 13:2. doi: 10.1186/s12982-015-0044-5. [DOI] [PMC free article] [PubMed] [Google Scholar]
- 18.Nunoura T, Hirai M, Yoshida-Takashima Y, Nishizawa M, Kawagucci S, Yokokawa T, Miyazaki J, Koide O, Makita H, Takaki Y, Sunamura M, Takai K. 2016. Distribution and niche separation of planktonic microbial communities in the water columns from the surface to the hadal waters of the Japan trench under the eutrophic ocean. Front Microbiol 7:1261. doi: 10.3389/fmicb.2016.01261. [DOI] [PMC free article] [PubMed] [Google Scholar]
- 19.Miyazaki M, Nogi Y, Fujiwara Y, Horikoshi K. 2008. Psychromonas japonica sp. nov., Psychromonas aquimarina sp. nov., Psychromonas macrocephali sp. nov. and Psychromonas ossibalaenae sp. nov., psychrotrophic bacteria isolated from sediment adjacent to sperm whale carcasses off Kagoshima, Japan. Int J Syst Evol Microbiol 58:1709–1714. doi: 10.1099/ijs.0.65744-0. [DOI] [PubMed] [Google Scholar]
- 20.Groudieva T, Grote R, Antranikian G. 2003. Psychromonas arctica sp. nov., a novel psychrotolerant, biofilm-forming bacterium isolated from Spitzbergen. Int J Syst Evol Microbiol 53:539–545. doi: 10.1099/ijs.0.02182-0. [DOI] [PubMed] [Google Scholar]
- 21.Lauro FM, Stratton TK, Chastain RA, Ferriera S, Johnson J, Goldberg SM, Yayanos AA, Bartlett DH. 2013. Complete genome sequence of the deep-sea bacterium Psychromonas strain CNPT3. Genome Announc 1:e00304-13. doi: 10.1128/genomeA.00304-13. [DOI] [PMC free article] [PubMed] [Google Scholar]
- 22.Zhang W, Tian RM, Sun J, Bougouffa S, Ding W, Cai L, Lan Y, Tong H, Li Y, Jamieson AJ, Bajic VB, Drazen JC, Bartlett D, Qian PY. 2018. Genome reduction in Psychromonas species within the gut of an amphipod from the ocean’s deepest point. mSystems 3:e00009-18. doi: 10.1128/mSystems.00009-18. [DOI] [PMC free article] [PubMed] [Google Scholar]
- 23.Briones-Roblero CI, Hernández-García JA, Gonzalez-Escobedo R, Soto-Robles LV, Rivera-Orduña FN, Zúñiga G. 2017. Structure and dynamics of the gut bacterial microbiota of the bark beetle, Dendroctonus rhizophagus (Curculionidae: Scolytinae) across their life stages. PLoS One 12:e0175470. doi: 10.1371/journal.pone.0175470. [DOI] [PMC free article] [PubMed] [Google Scholar]
- 24.Jo J, Choi H, Lee SG, Oh J, Lee HG, Park C. 2017. Draft genome sequences of Pseudoalteromonas tetraodonis CSB01KR and Pseudoalteromonas lipolytica CSB02KR, isolated from the gut of the sea cucumber Apostichopus japonicus. Genome Announc 5:e00627-17. doi: 10.1128/genomeA.00627-17. [DOI] [PMC free article] [PubMed] [Google Scholar]
- 25.Zhao J, Shi B, Jiang QR, Ke CH. 2012. Changes in gut-associated flora and bacterial digestive enzymes during the development stages of abalone (Haliotis diversicolor). Aquaculture 338-341:147–153. doi: 10.1016/j.aquaculture.2012.01.016. [DOI] [Google Scholar]
- 26.Casanueva A, Tuffin M, Cary C, Cowan DA. 2010. Molecular adaptations to psychrophily: the impact of ‘omic’ technologies. Trends Microbiol 18:374–381. doi: 10.1016/j.tim.2010.05.002. [DOI] [PubMed] [Google Scholar]
- 27.Ishiwatari R, Yamada K, Matsumoto K, Naraoka H, Yamamoto S, Handa N. 2000. Source of organic matter in sinking particles in the Japan Trench: molecular composition and carbon isotopic analyses, p 141–168. In Handa N, Tanoue E, Hama T (ed), Dynamics and characterization of marine organic matter. Kluwer, Tokyo, Japan. [Google Scholar]
- 28.Wenzhöfer F, Oguri K, Middelboe M, Turnewitsch R, Toyofuku T, Kitazato H, Glud RN. 2016. Benthic carbon mineralization in hadal trenches: assessment by in situ O2 microprofile measurements. Deep Sea Res Part 1 116:276–286. doi: 10.1016/j.dsr.2016.08.013. [DOI] [Google Scholar]
- 29.Payne AN, Chassard C, Zimmermann M, Müller P, Stinca S, Lacroix C. 2011. The metabolic activity of gut microbiota in obese children is increased compared with normal-weight children and exhibits more exhaustive substrate utilization. Nutr Diabetes 1:e12. doi: 10.1038/nutd.2011.8. [DOI] [PMC free article] [PubMed] [Google Scholar]
- 30.Kunding W. 1974. Molecular interactions in the bacterial phosphoenolpyruvate-phosphotransferase system (PTS). J Supramol Struct 2:695–714. doi: 10.1002/jss.400020514. [DOI] [PubMed] [Google Scholar]
- 31.Ye JJ, Saier MH. 1996. Regulation of sugar uptake via the phosphoenolpyruvate-dependent phosphotransferase systems in Bacillus subtilis and Lactococcus lactis is mediated by ATP-dependent phosphorylation of seryl residue 46 in HPr. J Bacteriol 178:3557–3563. doi: 10.1128/jb.178.12.3557-3563.1996. [DOI] [PMC free article] [PubMed] [Google Scholar]
- 32.McDowall JS, Murphy BJ, Haumann M, Palmer T, Armstrong FA, Sargent F. 2014. Bacterial formate hydrogenlyase complex. Proc Natl Acad Sci U S A 111:3948–3956. [DOI] [PMC free article] [PubMed] [Google Scholar]
- 33.Patel RK, Mukesh J. 2012. NGS QC Toolkit: a toolkit for quality control of next generation sequencing data. PLoS One 7:e30619. doi: 10.1371/journal.pone.0030619. [DOI] [PMC free article] [PubMed] [Google Scholar]
- 34.Li D, Liu CM, Luo R, Sadakane K, Lam TW. 2015. MEGAHIT: an ultra-fast single-node solution for large and complex metagenomics assembly via succinct de Bruijn graph. Bioinformatics 31:1674–1676. doi: 10.1093/bioinformatics/btv033. [DOI] [PubMed] [Google Scholar]
- 35.Langmead B, Salzberg SL. 2012. Fast gapped-read alignment with Bowtie 2. Nat Methods 9:357–359. doi: 10.1038/nmeth.1923. [DOI] [PMC free article] [PubMed] [Google Scholar]
- 36.Li H, Handsaker B, Wysoker A, Fennell T, Ruan J, Homer N, Marth G, Abecasis G, Durbin R. 2009. The sequence alignment/map format and SAMtools. Bioinformatics 25:2078–2079. doi: 10.1093/bioinformatics/btp352. [DOI] [PMC free article] [PubMed] [Google Scholar]
- 37.Hyatt D, Chen GL, LoCascio PF, Land ML, Larimer FW, Hauser LJ. 2010. Prodigal: prokaryotic gene recognition and translation initiation site identification. BMC Bioinformatics 11:119. doi: 10.1186/1471-2105-11-119. [DOI] [PMC free article] [PubMed] [Google Scholar]
- 38.Kumar S, Stecher G, Tamura K. 2016. MEGA7: Molecular Evolutionary Genetics Analysis version 7.0 for bigger datasets. Mol Biol Evol 33:1870–1874. doi: 10.1093/molbev/msw054. [DOI] [PMC free article] [PubMed] [Google Scholar]
- 39.Truong DT, Franzosa EA, Tickle TL, Scholz M, Weingart G, Pasolli E, Tett A, Huttenhower C, Segata N. 2015. MetaPhlAn2 for enhanced metagenomic taxonomic profiling. Nat Methods 12:902. doi: 10.1038/nmeth.3589. [DOI] [PubMed] [Google Scholar]
- 40.Galperin MY, Makarova KS, Wolf YI, Koonin EV. 2014. Expanded microbial genome coverage and improved protein family annotation in the COG database. Nucleic Acids Res 43:261–269.. [DOI] [PMC free article] [PubMed] [Google Scholar]
- 41.Hammer Ø, Harper DAT, Ryan PD. 2001. PAST: paleontological statistics software package for education and data analysis. Palaeontol Electronica 4:1–9. [Google Scholar]
- 42.Disz T, Akhter S, Cuevas D, Olson R, Overbeek R, Vonstein V, Stevens R, Edwards RA. 2010. Accessing the SEED genome databases via Web services API: tools for programmers. BMC Bioinformatics 11:319. doi: 10.1186/1471-2105-11-319. [DOI] [PMC free article] [PubMed] [Google Scholar]
- 43.Huson DH, Beier S, Flade I, Górska A, El-Hadidi M, Mitra S, Ruscheweyh HJ, Tappu R. 2016. MEGAN community edition-interactive exploration and analysis of large-scale microbiome sequencing data. PLoS Comput Biol 12:e1004957. doi: 10.1371/journal.pcbi.1004957. [DOI] [PMC free article] [PubMed] [Google Scholar]
- 44.Kanehisa M, Furumichi M, Tanabe M, Sato Y, Morishima K. 2016. KEGG: new perspectives on genomes, pathways, diseases and drugs. Nucleic Acids Res 45:D353–D361. doi: 10.1093/nar/gkw1092. [DOI] [PMC free article] [PubMed] [Google Scholar]
Associated Data
This section collects any data citations, data availability statements, or supplementary materials included in this article.


