Abstract
Hepatic glutathione S-transferases (GSTs) are dysregulated in human obesity, nonalcoholic fatty liver disease, and diabetes. The multifunctional GST pi-isoform (GSTP) catalyzes the conjugation of glutathione with acrolein and inhibits c-Jun NH2-terminal kinase (JNK) activation. Herein, we tested whether GSTP deficiency disturbs glucose homeostasis in mice. Hepatic GST proteins were downregulated by short-term high-fat diet in wild-type (WT) mice concomitant with increased glucose intolerance, JNK activation, and cytokine mRNAs in the liver. Genetic deletion of GSTP did not affect body composition, fasting blood glucose levels, or insulin levels in mice maintained on a normal chow diet; however, compared with WT mice, the GSTP-null mice were glucose intolerant. In GSTP-null mice, pyruvate intolerance, reflecting increased hepatic gluconeogenesis, was accompanied by elevated levels of activated JNK, cytokine mRNAs, and glucose-6-phosphatase proteins in the liver. Treatment of GSTP-null mice with the JNK inhibitor 1,9-pyrazoloanthrone (SP600125) significantly attenuated pyruvate-induced hepatic gluconeogenesis and significantly altered correlations between hepatic cytokine mRNAs and metabolic outcomes in GSTP-null mice. Collectively, these findings suggest that hepatic GSTP plays a pivotal role in glucose handling by regulating JNK-dependent control of hepatic gluconeogenesis. Thus, hepatic GSTP-JNK dysregulation may be a target of new therapeutic interventions during early stages of glucose intolerance to prevent the worsening metabolic derangements associated with human obesity and its relentless progression to diabetes.
Keywords: gluconeogenesis, glucose intolerance, JNK, obesity, type 2 diabetes
INTRODUCTION
High-calorie diets have fostered the current pandemic of obesity and comorbid conditions of nonalcoholic fatty liver disease (NAFLD), systemic insulin resistance (IR), and type 2 diabetes (T2D; 17, 36, 41). More than one-third (34.9% or 78.6 million) of US adults are obese, and 68% are overweight (33). According to the US Centers for Disease Control and Prevention, in 2015 nearly 30 million Americans had T2D (6). T2D is strongly associated with NAFLD, and >90% of obese patients with T2D have NAFLD (48). In addition, ~20% of patients with NAFLD progress to nonalcoholic steatohepatitis, liver cirrhosis, and liver failure (37). However, not all obese individuals develop T2D (14), suggesting that during obesity, key genetic and environmental factor(s) modulate the development of IR and T2D (53). On the other hand, not all patients with NAFLD or T2D are obese. For example, in South Asians, NAFLD and/or T2D are prevalent in young, lean individuals (7). Therefore, it is likely that early metabolic changes, independent of obesity, are critical regulators of the development of systemic IR and T2D.
Early changes in obesity, NAFLD, and T2D have been linked with aberrant expression of hepatic glutathione S-transferase (GST) isozymes (23, 29, 31). The GSTs are a multigene family of ubiquitous and abundant phase II enzymes that catalyze the conjugation of glutathione (GSH) with unsaturated aldehydes such as acrolein and 4-hydroxynonenal generated endogenously via lipid peroxidation (4-HNE; 25) or from exogenous sources. Given that consumption of high-calorie diets results in oxidative stress-mediated formation of unsaturated aldehydes, a loss of GST activity could lead to accumulation of unmetabolized aldehydes. Accordingly, downregulation of GST alpha-isoform (GSTA) in obese, insulin-resistant humans or in high fat diet (HFD)-fed mice results in the accumulation of protein-HNE adducts (carbonylated proteins) in the adipose tissue (11, 19). Moreover, polymorphisms in the human GST mu 1 (GSTM1), GST theta 1 (GSTT1), and GST pi 1 (GSTP1) genes that lead to altered GST activity (35, 47) are associated with increased risk of T2D (4, 20, 43, 45), yet the modulating role of GSTs in this pathway is unknown.
The GST pi-isoform (GSTP) plays a critical and nonredundant role in the metabolism and detoxification of highly reactive, small-chain aldehydes such as acrolein (21). Diet-induced obesity (DIO) in mice is accompanied by downregulation of hepatic GSTP (29). GSTP also binds c-Jun NH2-terminal kinase (JNK), regulating its activation (1). Consistent with this noncatalytic role of GSTP, it has been shown that GSTP-null mice exhibit constitutive JNK activation in liver and lungs (16). Because JNK activation can trigger IR (28, 30, 40) and JNK-deficient mice are protected against DIO and IR (12, 22, 38), less GSTP protein may diminish insulin sensitivity by promoting JNK activation. However, the specific role of GSTP in regulation of JNK activation during the early stages of DIO has not been studied.
Thus, the present study was designed to test the hypothesis that metabolic derangements of DIO result from altered GSTP abundance and JNK activation in the liver. In a murine model of DIO, short-term HFD feeding downregulated hepatic GSTP (and other GSTs) coincident with JNK activation and glucose intolerance. To further test the hypothesis that glucose intolerance was a consequence of GST downregulation, we used mice genetically deficient in GSTP (yet replete with other GSTs) and found that these mice were glucose intolerant basally independent of obesity or HFD feeding. Intervention with a JNK inhibitor reversed glucose-intolerant phenotype, confirming JNK dependence. Collectively, this study reveals that HFD-induced downregulation of hepatic GSTP contributes to the early development of systemic glucose intolerance, a prediabetes stage of metabolic dysfunction.
METHODS
Animals.
Animal studies were in accordance with the Declaration of Helsinki and with the Guide for the Care and Use of Laboratory Animals as adopted and promulgated by the National Institutes of Health and were approved by the University of Louisville Institutional Animal Care and Use Committee. Male C57BL/6 and db/db mice (6–8 wk old) were purchased from the Jackson Laboratory (Bar Harbor, ME). GSTP-null mice, generated on a MF1 background strain using homologous recombination, were bred for >12 generations with C57BL/6J mice and were maintained and genotyped as previously described (8). Mice were maintained under temperature- and humidity-controlled conditions with a 12:12-h light-dark cycle and food and water ad libitum. At the end of each protocol, mice were euthanized (pentobarbital sodium, ~150 mg/kg body wt ip). Plasma and harvested organs/tissues were immediately snap-frozen in liquid nitrogen and stored at −80°C until further analyses.
Metabolic phenotyping.
To assess DIO, 8-wk-old C57BL/6J and GSTP-null mice were fed normal chow (NC, 12.5% kcal fat; no. D-12450; Research Diets, New Brunswick, NJ) or HFD (60% kcal fat, no. D-12492; Research Diets; 42% kcal fat, TD.88137; Harlan Teklad, Madison, WI) for 6 wk. Dual-energy X-ray absorptiometry (DEXA) and glucose homeostasis analyses were performed in age (12–31-wk)- and diet-matched wild-type (WT) and GSTP-null mice in multiple independent experiments. DEXA (PIXImus; Lunar, Madison, WI) was used to measure body composition. Glucose handling was evaluated using both glucose (GTT) and pyruvate tolerance tests (PTT) based on lean mass. For GTT and PTT, mice were fasted for 6 and 16 h, respectively. Blood glucose levels were measured by tail snip using an Accu-Chek glucometer (Roche, Indianapolis, IN) after intraperitoneal injections with either d-glucose (1 mg/g lean mass; Sigma-Aldrich, St. Louis, MO) or sodium pyruvate (2 mg/g lean mass, Sigma-Aldrich) over 120 min. The GTT and PTT area under the curve (AUC) values were calculated using the trapezoid rule. To account for baseline differences in blood glucose, baseline AUC was subtracted from total AUC to estimate the GTTAUC and PTTAUC of each mouse (2).
Fed blood glucose levels were determined between 8 and 10 AM. Homeostatic model assessment of IR (HOMA-IR) and homeostatic model assessment of β-cell function (HOMA-%β) scores were calculated from fasting blood glucose and plasma insulin levels as follows: HOMA-IR = fasting blood glucose (mg/dl) × fasting plasma insulin levels (mU/l) ÷ 405; and, HOMA-%β = 360 × fasting plasma insulin levels (mU/l)/[fasting blood glucose (mg/dl) − 63]. For the analysis of insulin signaling, insulin (1.5 U/kg lean mass ip, Humulin; Eli Lilly, Indianapolis, IN) was injected in 6 h-fasted mice, and liver, gastrocnemius skeletal muscle, and epididymal white adipose tissue were harvested within 15 min postinjection. Metabolic profiles were recorded using a combined indirect calorimetry system (PhenoMaster; TSE Systems, Chesterfield, MO) in adult NC-fed WT and GSTP-null mice.
JNK inhibitor treatment.
To examine the role of JNK in glucose intolerance, GSTP-null mice were screened for level of intolerance. This screen revealed that 75% of GSTP-null mice had elevated to severe glucose intolerance. Littermates of screened mice were randomly assigned to treatment with 1,9-pyrazoloanthrone (SP600125, 5 mg·kg−1·day−1 ip, 7 days; Sigma-Aldrich) or vehicle [DMSO diluted in saline; modified after Drosatos et al. (13)]. A PTT was performed after 7 days of treatment, and blood and organs were collected immediately after PTT as described.
RT-PCR.
Total RNA was isolated and reverse transcribed, and quantitative RT-PCR was performed (8). Relative mRNA expression was estimated by the 2−∆∆Ct method (where Ct is threshold cycle; 51). Acidic ribosomal phosphoprotein P0 (Rplp0) was used as an internal standard. X-box-binding protein-1 (XBP1) splicing was analyzed using primers spanning the splice junction of XBP1 as described (44). The primer sequences used for quantitative RT-PCR are in Table 1.
Table 1.
Oligonucleotide primers used for PCR analysis
| Gene | Accession No. | Forward Primer | Reverse Primer |
|---|---|---|---|
| Mip1a | NM_011337.2 | 5′-ACTGACCTGGAACTGAATGCCTGA-3′ | 5′-GTGGCTACTTGGCAGCAAACAG-3′ |
| Mcp1 | NM_011333.3 | 5′-ATGCAGGTCCCTGTCATG-3′ | 5′-GCTTGAGGTGGTTGTGGA-3′ |
| Il1b | NM_008361.3 | 5′-CTCCATGAGCTTTGTACAAGG-3′ | 5′-TGCTGATGTACCAGTTGGGG-3′ |
| Il6 | NM_031168 | 5′-CTCTGGGAAATCGTGGAAAT-3′ | 5′-CCAGTTTGGTAGCATCCATC-3′ |
| Tnf1a | NM_013693.3 | 5′-CCCTCACACTCAGATCATCTTCT-3′ | 5′-GCTACGACGTGGGCTACAG-3 |
| Pck1 | NM_011044.2 | 5′-CTGCATAACGGTCTGGACTTC-3′ | 5′-CAGCAACTGCCCGTACTCC-3′ |
| Pck2 | NM_028994.2 | 5′-ATGGCTGCTATGTACCTCCC-3′ | 5′-GCGCCACAAAGTCTCGAAC-3′ |
| Fbp1 | NM_019395.3 | 5′-TATGGTGGAAAGGGACGGGAA-3′ | 5′-CCTCTGGTGATACTCAAGGATGG-3′ |
| Fbp2 | NM_007994.3 | 5′-ACCCTGACCCGTTACGTTATG-3′ | 5′-CACTTCACGCTCCCCGAAATC-3′ |
| G6pc | NM_008061.4 | 5′-CGACTCGCTATCTCCAAGTGA-3′ | 5′-GTTGAACCAGTCTCCGACCA-3′ |
| G6pc2 | NM_021331.4 | 5′-CAGGAGGACTACCGGACTTAC-3′ | 5′-TCAACTGAAACCAAAGTGGGAA-3′ |
| G6pc3 | NM_175935.3 | 5′-CTGAGCGCGGGCATCATAAT-3′ | 5′-GATTCTTAGGATCGCCCAGAAAG-3′ |
| Grp78 | NM_022310.2 | 5′-CACGTCCAACCCCGAGAA-3′ | 5′-ATTCCAAGTGCGTCCGATG-3′ |
| Herp | NM_022331.1 | 5′-CGTTCAGACAGAGGCCAGTTC-3′ | 5′-CTCGAGGACCACCATCATCC-3′ |
| Xbp1 | NM_013842.2 | 5′-TTACGGGAGAAAACTCACGGC-3′ | 5′-GGGTCCAACTTGTCCAGAATGC-3′ |
| Gsta4 | NM_010357.3 | 5′-TGATTGCCGTGGCTCCATTTA-3′ | 5′-CAACGAGAAAAGCCTCTCCGT-3′ |
| Gstm4.1 | NM_026764.3 | 5′-AGCTCACGCTATTCGGCTG-3′ | 5′-GCTCCAAGTATTCCACCTTCAGT-3′ |
| Gstp1 | NM_013541.1 | 5′-ATGCCACCATACACCATTGTC-3′ | 5′-GGGAGCTGCCCATACAGAC-3′ |
| Rplp0 | NM_007475.5 | 5′-AGATTCGGGATATGCTGTTGGC-3′ | 5′-TCGGGTCCTAGACCAGTGTTC-3′ |
Fbp, fructose-1,6-bisphosphatase; G6pc, glucose-6-phosphatase catalytic subunit; Grp, glucose-regulated protein; Gsta, glutathione S-transferase (GST) alpha-isoform; Gstm, GST mu-isoform; Gstp, GST pi-isoform; Herp, HES-related repressor protein; Mcp, monocyte chemoattractant protein; Mip, macrophage inflammatory protein; Pck, phosphoenolpyruvate carboxykinase; Rplp, acidic ribosomal phosphoprotein, Xbp, X-box binding protein.
Immunoblot analysis.
Total tissue homogenates were prepared using radioimmunoprecipitation (RIPA) assay buffer (51). Protein lysates (2–50 µg) were loaded onto 12.5% Bis-Tris·HCl or TGX (Tris-Glycine eXtended) gels (Bio-Rad, Hercules, CA). Proteins were separated by gel electrophoresis and transferred to PVDF membranes. Membranes were incubated with appropriate antibodies and developed with ECL Plus reagent (Thermo Fisher Scientific, Waltham, MA, or Amersham Biosciences, Piscataway, NJ), and band intensities were detected using a Typhoon 9400 variable-mode imager (Amersham Biosciences). Band intensities were quantified using ImageQuant TL software (Amersham Biosciences) and normalized to an appropriate loading control (e.g., GAPDH or α-tubulin). Antibodies purchased from commercial sources were: phospho-JNK (Thr183/Tyr185), JNK, phospho-Akt (Ser473), Akt, and GAPDH (Cell Signaling Technology); GSTP (BD Biosciences); α-tubulin (Sigma-Aldrich); glucose-6-phosphatase catalytic subunit (G6PC, ab96142; Abcam); and G6PC3 (ab133964; Abcam). Polyclonal antibodies against GSTA and GSTM were a gift from Dr. R. A. Prough, University of Louisville (54).
Immunohistochemistry.
Formalin-fixed, paraffin-embedded liver sections (5 µm) were stained with GSTP1 antibody (1:1,500; Novocastra, Buffalo Grove, IL) as described (9). For microscopic imaging a digital SPOT camera mounted on an Olympus (Center Valley, PA) microscope was used.
Biochemical measurements.
Plasma total cholesterol, HDL cholesterol, LDL cholesterol, and triglycerides were measured using commercial kits (Wako, Richmond, VA) and a COBAS MIRA Plus Analyzer (Roche).
Plasma insulin levels were measured by ELISA (Mercodia, Winston-Salem, NC). Hepatic cholesterol and triglycerides were extracted using the method of Bligh and Dyer (5) and measured using commercial kits (Wako). Total hepatic GST activity [1-chloro-2,4-dinitrobenzene (CDNB) as substrate] was measured by colorimetric assay kit (Cayman Chemical, Ann Arbor, MI). Phosphoenolpyruvate carboxykinase (PCK) activity was measured using an NADH-coupled system to quantitate the conversion of phosphoenolpyruvate into oxaloacetate (with or without 3-mercaptopicolinic acid, an inhibitor of PCK activity) and subsequent conversion to malate (52). Activity was expressed as nanomoles of NAD+ per minute per milligram protein in liver supernatant.
Statistics.
Statistical analyses were performed with GraphPad Prism version 5 (GraphPad Software, La Jolla, CA). Comparisons between two groups were performed by unpaired Student’s t-test or Mann-Whitney’s U-test, whereas multiple groups were compared using one-way or two-way ANOVA followed by Tukey post hoc test. Spearman’s rank correlation coefficients were computed using R software (37a). Data are presented as means ± SE, and P < 0.05 was considered to indicate statistical significance.
RESULTS
DIO, glucose intolerance, GSTP downregulation, and JNK activation.
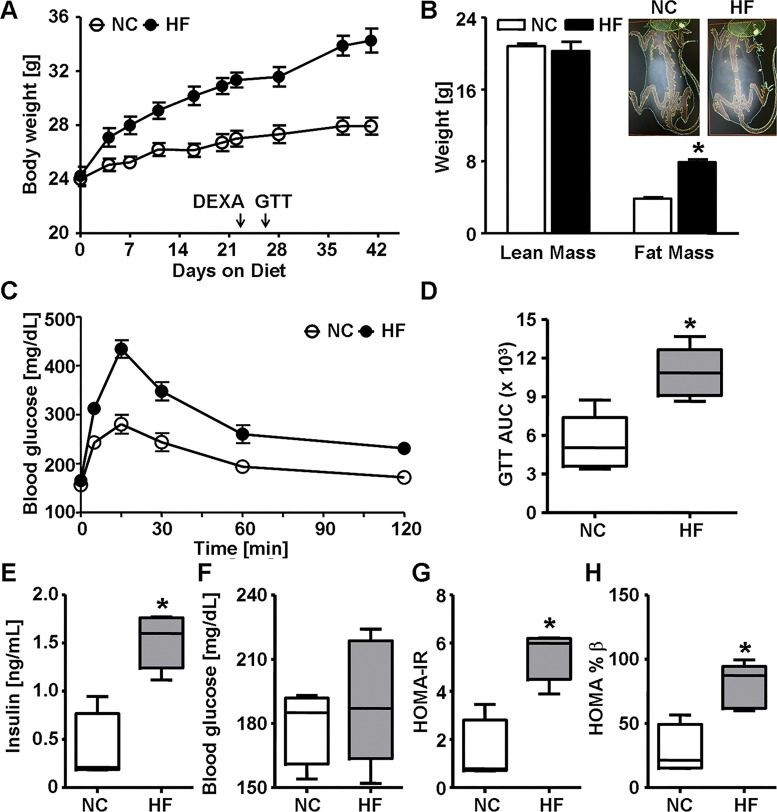
Numerous studies indicate that GSTs are dysregulated in DIO and in humans with NAFLD (11, 19, 23, 29), yet whether altered GSTs are mechanistically involved in the development of glucose intolerance is unclear. To examine the effects of diet on GSTs, 8-wk-old male C57BL/6 (WT) mice were fed either NC or HFD (60% kcal fat) for 6 wk. As expected, the HFD group gained more body weight and fat mass than the NC group (Fig. 1, A and B). A GTT performed at 3.5 wk of feeding showed that HFD-fed mice were glucose intolerant compared with NC-fed mice as reflected in a decline in glucose excursion (Fig. 1C) and a greater AUC (GTTAUC, Fig. 1D). Fasting plasma insulin levels and HOMA-IR and HOMA-%β scores were greater in HFD-fed than in NC-fed mice (Fig. 1, E, G, and H) indicating a diet-induced onset of IR.
Fig. 1.
High fat diet-induced obesity and glucose intolerance in wild-type mice. A: body weight of male wild-type C57BL/6J mice fed normal chow (NC, 12.5% kcal fat) or high-fat diet (HF, 60% kcal fat) for 6 wk. Body weight was measured regularly, and arrows indicate when dual-energy X-ray absorptiometry (DEXA) scanning and glucose tolerance test (GTT) were performed. B: quantification of the DEXA scan analysis (and representative images, inset) of lean and fat mass in mice after 3 wk of diet. C and D: blood glucose levels during GTT (C) and calculated area under the curve (GTTAUC, D) in mice fed NC or HF for 3.5 wk. E–H: fasting (6-h) plasma insulin levels (E), blood glucose levels (F), homeostatic model assessment of insulin resistance (HOMA-IR) score (G), and homeostatic model assessment of β-cell function (HOMA-%β) score (H) in mice fed NC or HF for 6 wk. Values are means ± SE (n = 5, *P < 0.05, NC vs. HF).
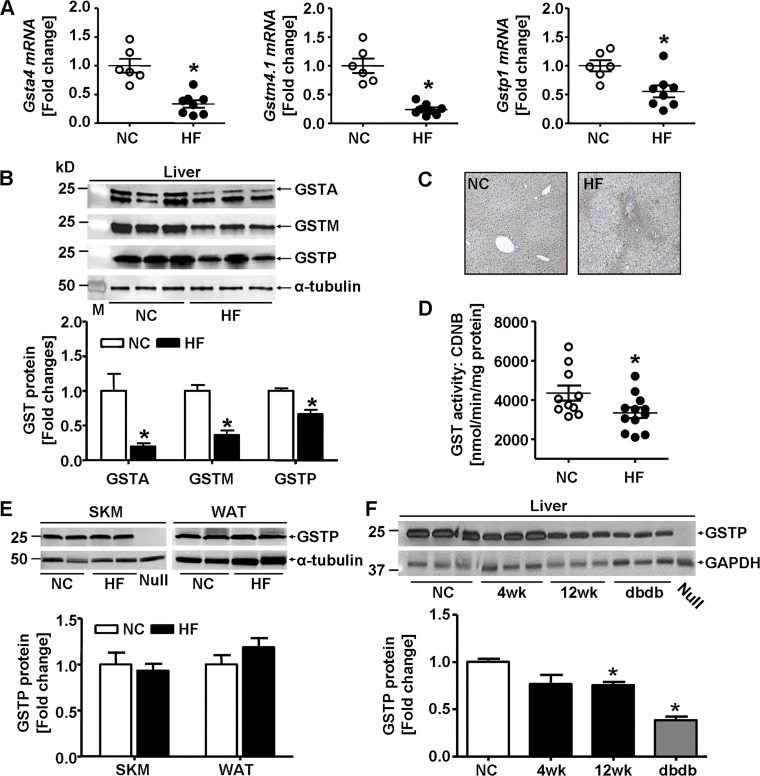
To evaluate the effects of diet on GSTs, we measured mRNA levels and protein abundance of major GST isozymes in major insulin-responsive tissues in mice fed NC or HFD for 6 wk (Fig. 2). The mRNA levels of the GST isoforms Gsta4, Gstm4.1, and Gstp1 were decreased in the livers of mice fed HFD compared with those fed NC (Fig. 2A). Western blot results using antibodies against GSTA, GSTM, and GSTP confirmed our mRNA data (Fig. 2B). Consistent with HFD-induced downregulation of GSTP protein, positive GSTP staining was substantially decreased and more restricted to portal triad region in livers of HFD-fed mice (42% kcal fat; 12 wk; Fig. 2C). The decrease in hepatic GSTP protein was accompanied by a decrease in GST activity in the livers of HFD-fed mice (Fig. 2D) indicating a reduced capacity to metabolize lipid peroxidation products. Whereas HFD feeding for 6 wk reduced the abundance of GSTP protein in the liver (Fig. 2B), HFD did not affect GSTP levels in the skeletal muscle or the white adipose tissue of these mice (Fig. 2E). Similar to the effects of the 6 wk of HFD (60% kcal fat), hepatic GSTP protein also was significantly decreased both in WT mice fed a different HFD composition (42% kcal fat; 4 or 12 wk) and in a genetic model of obesity (db/db mice; Fig. 2F). Collectively, these results show that HFD-induced or genetically induced obesity in mice resulted in decreased abundance of hepatic GSTP.
Fig. 2.
Glutathione S-transferases (GSTs) in insulin-sensitive organs in high fat diet-induced obesity. A: hepatic levels of GST alpha 4 (Gsta4), GST mu 4.1 (Gstm4.1), and GST pi 1 (Gstp1) mRNA of male C57BL/6J mice fed normal chow (NC, 12.5% kcal fat) or high-fat diet (HF, 60% kcal fat) for 6 wk. GST mRNA abundance measured by quantitative RT-PCR was normalized to acidic ribosomal phosphoprotein P0 (Rplp0) mRNA, and each point represents one animal (NC, n = 6; HF, n = 8). B: representative Western blots and densitometric analyses of the hepatic abundance of GSTA (n = 5), GSTM (n = 5), and GSTP (NC, n = 13; HF, n = 11) in mice fed NC or HF for 6 wk (M, molecular weight marker). C: representative microscopic images of GSTP immunohistochemical staining in liver sections of mice fed NC or HF (42% kcal fat) for 12 wk. D: hepatic GST activity measured with 1-chloro-dinitrobenzene (CDNB) as substrate (NC, n = 10; HF, n = 12) in mice fed NC or HF for 6 wk. E: representative Western blots and densitometric analyses of the GSTP abundance in skeletal muscle (SKM) and white adipose tissue (WAT) of mice fed NC or HF (n = 4) for 6 wk. F: representative Western blots and densitometric analyses of hepatic GSTP abundance of C57BL/6J mice fed NC or HF (42% kcal fat) for 4 or 12 wk and in age-matched db/db mice (n = 3) fed NC. Liver homogenate of GSTP-null mice (Null) was used as negative control. Values are means ± SE (*P < 0.05, NC vs. HF or vs. db/db).
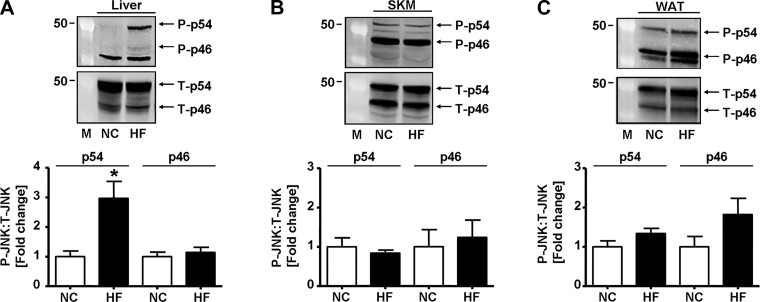
Given that GSTP regulates JNK activation and signaling (16) and that activated JNK inhibits insulin signaling (28, 34), we assessed whether HFD feeding affected hepatic JNK phosphorylation. As shown in Fig. 3A, the abundance of hepatic phospho-p54 JNK (yet not phospho-p46) was increased ~3-fold in the liver of HFD-fed mice compared with NC-fed mice. Moreover, hepatic phosphorylation of p54 JNK was positively correlated (linear fit: y = A + B · x, r2 = 0.3, P < 0.05) with the GTTAUC measured in the same mice at 3.5 wk (see Fig. 1D). In contrast, HFD feeding had no effect on status of JNK phosphorylation in the skeletal muscle (Fig. 3B) or in white adipose tissue (Fig. 3C).
Fig. 3.
High-fat diet increases hepatic JNK phosphorylation. Representative Western blots and densitometric analyses of the phosphorylation of JNK (p54/p46, phospho-Thr183/Tyr185) in the liver [normal chow (NC), n = 6; high fat (HF), n = 5; A], skeletal muscle (SKM; gastrocnemius: NC, n = 4; HF, n = 4; B), and white adipose tissue (WAT; epididymal: NC, n = 5; HF, n = 5; C) of mice fed NC or HF for 6 wk. M, molecular weight marker; P, phosphorylated; T, total. Values are means ± SE (*P < 0.05, NC vs. HF).
Taken together, we found that HFD feeding impaired systemic glucose handling, an effect that was paralleled by the depletion of GSTs and an increase in p54 JNK phosphorylation in the liver, but not in skeletal muscle or white adipose tissue of male WT mice. These results indicate that diet-induced GST depletion could contribute to the development of glucose intolerance by increasing JNK activation. Because short-term HFD dysregulated multiple hepatic GSTs, we tested whether GSTP deficiency alone could recapitulate the phenotypic effects of HFD on glucose tolerance. For this, we examined glucose homeostasis in GSTP-null mice.
GSTP deficiency induces glucose intolerance.
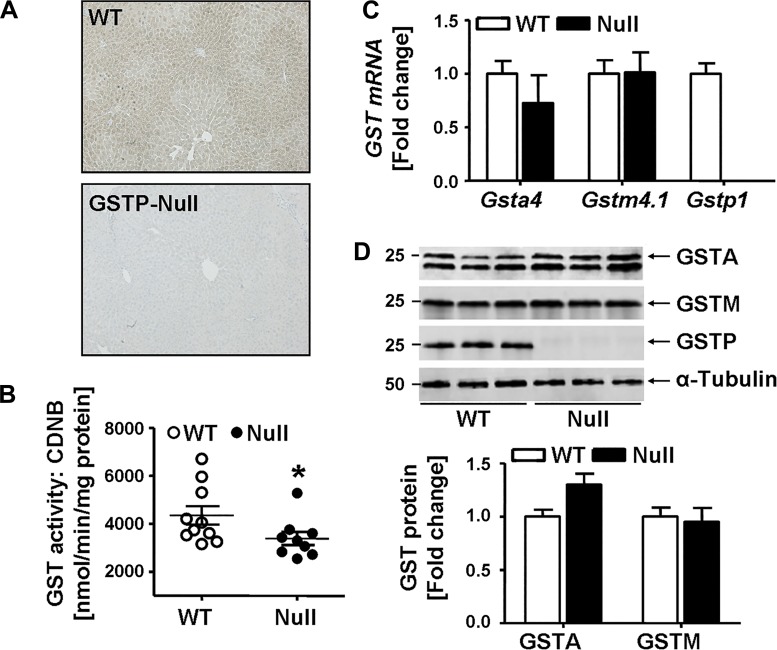
As reported (8), GSTP-null mice reproduce and grow normally without any obvious phenotype. The body weight, body composition (fat and lean mass), and organ weights (including liver) of male GSTP-null mice were comparable to those of age-matched male WT mice (Table 2). Immunohistochemical staining of liver sections confirmed GSTP deficiency (Fig. 4A). Consistent with a cytosolic distribution of GSTP, there was diffuse staining throughout liver parenchyma with slightly greater staining around the portal triads in WT mice that was absent in GSTP-null mice. Total hepatic GST activity in GSTP-null mice was decreased by 24% (Fig. 4B), a decrease in activity similar to that measured in HFD-fed WT mice (see Fig. 2D). However, no compensatory upregulation of other abundant GST isoforms was observed in GSTP-null mice. For example, neither hepatic mRNA levels of Gsta4 and Gstm4.1 (Fig. 4C) nor the protein abundance of GSTA and GSTM (Fig. 4D) were changed in GSTP-null mice compared with age-matched WT mice.
Table 2.
Metabolic and plasma parameters of male WT and GSTP-null mice
| Parameter | WT | GSTP-Null |
|---|---|---|
| Body composition, g | ||
| Body weight | 29.57 ± 0.36 (24) | 29.36 ± 0.40 (23) |
| Lean mass | 21.04 ± 0.32 (24) | 21.34 ± 0.31 (23) |
| Fat mass | 4.88 ± 0.14 (24) | 4.56 ± 0.17 (23) |
| Organ weights, %body wt | ||
| Liver | 4.33 ± 0.11 (16) | 4.26 ± 0.09 (17) |
| WAT | 1.03 ± 0.09 (16) | 1.24 ± 0.08 (17) |
| BAT | 0.18 ± 0.02 (16) | 0.28 ± 0.01 (17)* |
| Plasma lipids, mg/dl | ||
| HDL-C | 75.65 ± 2.70 (8) | 74.97 ± 2.48 (18) |
| LDL-C | 11.67 ± 0.54 (8) | 12.84 ± 0.54 (18) |
| TG | 44.42 ± 2.73 (8) | 40.20 ± 2.12 (18) |
| Plasma biochemistry | ||
| Albumin, g/dl | 2.579 ± 0.07 (8) | 2.501 ± 0.03 (18) |
| Total protein, g/dl | 4.384 ± 0.08 (8) | 4.285 ± 0.05 (18) |
| CK, U/l | 234.7 ± 57.31 (6) | 190.8 ± 27.87 (15) |
| LDH, U/l | 205.6 ± 25.46 (6) | 164.8 ± 10.89 (15) |
| ALT, U/l | 55.95 ± 6.99 (6) | 35.49 ± 3.10 (15)* |
| AST, U/l | 79.98 ± 13.82 (6) | 57.18 ± 6.85 (15) |
Values are means ± SE; number of mice is in parentheses. ALT, alanine aminotransferase; AST, aspartate aminotransferase; BAT, brown adipose tissue; CK, creatine kinase; GSTP, glutathione S-transferase pi-isoform; HDL-C, high-density lipoprotein cholesterol; LDH, lactate dehydrogenase; LDL-C, low-density lipoprotein cholesterol; TG, triglycerides; WAT, white adipose tissue; WT, wild-type mice.
P < 0.05, WT vs. GSTP-null.
Fig. 4.
Hepatic glutathione S-transferase (GST) abundance and activity in wild-type (WT) and GST pi-isoform (GSTP) mice. A: representative microscopic images of liver sections from WT and GSTP-deficient (GSTP-null) mice stained immunohistochemically with GSTP antibody. B: hepatic GST activity measured with 1-chloro-dinitrobenzene (CDNB) substrate (WT, n = 10; GSTP-null, n = 9). C: hepatic mRNA levels of GST alpha 4 (Gsta4), GST mu 4.1 (Gstm4.1), and Gstp1 [normalized to acidic ribosomal phosphoprotein P0 (Rplp0)] of WT (n = 6) and GSTP-null mice (n = 6). D: representative Western blots and densitometric analyses of the hepatic abundance of GSTA, GSTM, and GSTP (WT, n = 3; GSTP-null, n = 3). Values are means ± SE (*P < 0.05, WT vs. GSTP-null).
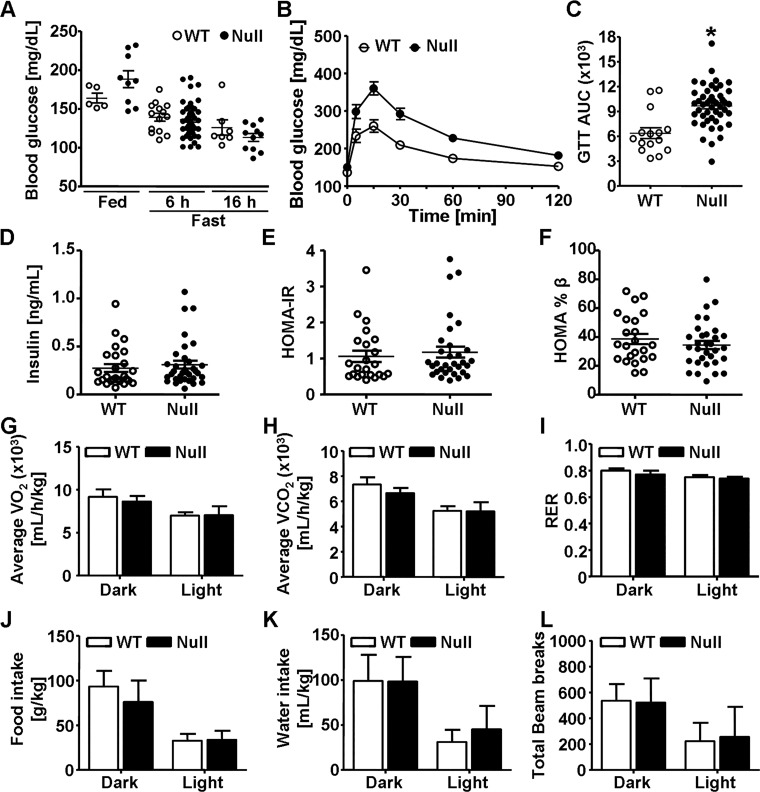
Next, we assessed the effect of GSTP deletion on whole body glucose homeostasis and metabolic parameters (Fig. 5). Blood glucose levels were similar in fed and fasted WT and GSTP-null mice (Fig. 5A), yet GSTP-null mice had impaired glucose excursion during a GTT compared with WT mice (Fig. 5, B and C) indicating that GSTP-null mice were glucose intolerant. In contrast, levels of fasting plasma insulin and calculated HOMA-IR and HOMA-%β scores in GSTP-null mice were not significantly different from those of WT mice (Fig. 5, D–F) indicating that depletion of GSTP induced neither systemic IR nor pancreatic β-cell dysfunction. Moreover, metabolic parameters (energy expenditure, food and water intake, and locomotor movement) were similar in WT and GSTP-null mice (Fig. 5, G–L).
Fig. 5.
Glutathione S-transferase (GST) pi-isoform (GSTP) deletion leads to glucose intolerance. Glycemic and metabolic parameters measured in age-matched (12–26-wk) male wild-type (WT) and GSTP-deficient (GSTP-null) mice. A: blood glucose levels in fed (WT, n = 5; GSTP-null, n = 9) and fasted (6 h: WT, n = 14; GSTP-null, n = 46; 16 h: WT, n = 7; GSTP-null, n = 11) mice. B and C: blood glucose levels during glucose tolerance test (GTT, B) and calculated area under the curve (GTTAUC, C) in WT and GSTP-null mice (WT, n = 15; GSTP-null, n = 47). D–F: fasting plasma insulin levels (WT, n = 26; GSTP-null, n = 34; D) and homeostatic model assessment of insulin resistance (HOMA-IR, E) and homeostatic model assessment of β-cell function (HOMA-%β, F) scores (WT, n = 23; GSTP-null, n = 32). G–L: metabolic parameters, oxygen consumption (V̇o2, G), carbon dioxide production (V̇co2, H), respiratory exchange ratio (RER, I), food consumption (J), water intake (K), and total activity (beam breaks per 12-h cycle, L), measured by indirect calorimetry in 13-wk-old male WT and GSTP-null mice (WT, n = 5; GSTP-null, n = 7). Values are means ± SE (*P < 0.05, WT vs. GSTP-null).
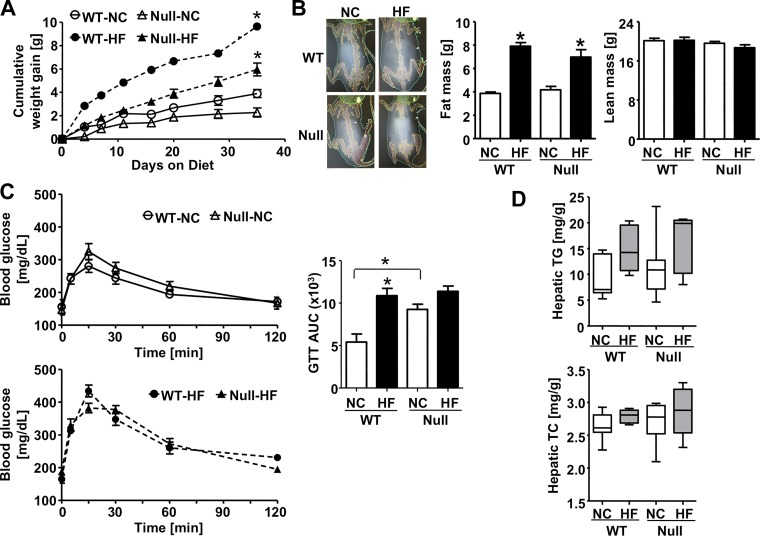
To address whether HFD-induced glucose intolerance was worsened by GSTP deficiency, we fed HFD to WT and GSTP-null mice. Short-term HFD (60% kcal fat) increased adiposity in GSTP-null mice similarly to WT mice (Fig. 6, A and B); however, there was no added effect of HFD on glucose intolerance in GSTP-null mice, unlike the effect in WT mice (Fig. 6C). Moreover, the glucose intolerance in GSTP-null mice (regardless of diet) was similar to the glucose intolerance of WT mice on a HFD (Fig. 6C) suggesting that HFD-induced glucose intolerance in WT mice may be attributable solely to the downregulation of hepatic GSTP. It has been suggested that fat accumulation in the liver causes hepatic IR and subsequently systemic IR and glucose intolerance (39). The levels of hepatic triglycerides and cholesterol, however, were similarly affected in WT and GSTP-null mice fed either NC or HFD (Fig. 6D) suggesting that GSTP depletion did not enhance fat accumulation in the liver. These data show that GSTP genetic deficiency recapitulated the effects of short-term HFD on glucose intolerance in WT mice.
Fig. 6.
High fat diet-induced obesity and glucose intolerance in wild-type (WT) and glutathione S-transferase (GST) pi-isoform (GSTP)-deficient (GSTP-null) mice. A: cumulative body weight gain in WT and GSTP-null mice fed normal chow (NC, 12.5% kcal fat) or high-fat diet (HF, 60% kcal fat) for 6 wk. B: representative images and quantification of the dual-energy X-ray absorptiometry scanning and analysis of fat and lean mass in mice after 3 wk of NC or HFD feeding. C: blood glucose levels during glucose tolerance test (GTT) and calculated area under the curve (GTTAUC) in mice after 3.5 wk of diet (WT, n = 5; GSTP-null, n = 7). D: hepatic levels of triglycerides (TG, top) and total cholesterol (TC, bottom) measured in mice (WT-NC, n = 8; GSTP-null-NC, n = 10; WT-HF, n = 5; GSTP-null-HF, n = 5). Values are means ± SE (*P < 0.05, NC vs. HF or WT vs. GSTP-null as indicated).
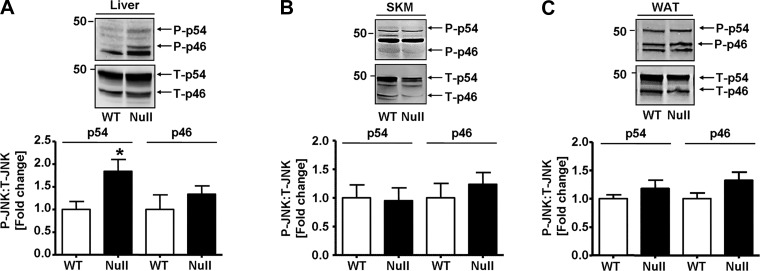
Because GSTP-null mice have increased JNK activation under basal and stressed conditions (10, 16), we measured JNK phosphorylation in the major organs of glucose regulation (Fig. 7). As observed before in HFD-fed WT mice (see Fig. 3A), the level of phosphorylated-p54 JNK (but not phospho-p46) was greater in liver of GSTP-null than in WT mice (Fig. 7A). No differences in phospho-JNK levels were present in skeletal muscle and white adipose tissue of GSTP-null and WT mice (Fig. 7, B and C).
Fig. 7.
JNK phosphorylation in wild-type (WT) and glutathione S-transferase (GST) pi-isoform (GSTP)-deficient (GSTP-null) mice. Representative Western blots and densitometric analyses of the phosphorylation of JNK (p54/p46, phospho-Thr183/Tyr185) in liver (WT, n = 5; GSTP-null, n = 6; A), skeletal muscle (SKM; WT, n = 8; GSTP-null, n = 9; B), and white adipose tissue (WAT; WT, n = 8; GSTP-null, n = 10; C). P, phosphorylated; T, total. Values are means ± SE (*P < 0.05, WT vs. GSTP-null).
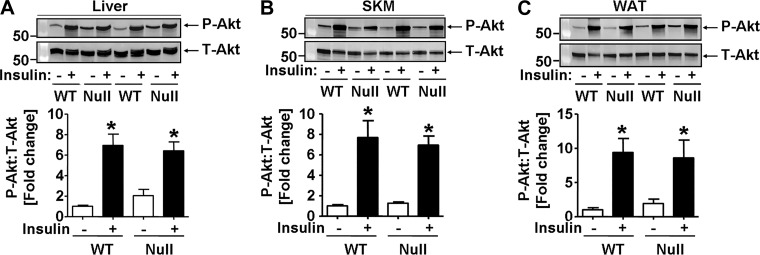
It is unclear how hepatic JNK activation in GSTP-null mice increases glucose intolerance. Because it is suggested that JNK activation impairs insulin signaling in obesity (28, 34), we examined insulin sensitivity in the liver, skeletal muscle, and white adipose tissue in GSTP-null and WT mice. To assess insulin signaling, mice received insulin, and insulin-stimulated phosphorylation of Akt was measured as an index of signaling. As expected, insulin bolus led to robust Akt phosphorylation (Ser473) in the liver, skeletal muscle, and white adipose tissue in WT mice (Fig. 8, A–C). Surprisingly, equally robust phospho-Akt signaling was observed in organs of insulin-injected GSTP-null mice (Fig. 8, A–C). Thus, genetic deletion of GSTP did not induce IR in the major organs of glucose homeostasis.
Fig. 8.
Organ-specific insulin sensitivity in wild-type (WT) and glutathione S-transferase (GST) pi-isoform (GSTP)-deficient (GSTP-null) mice. Representative Western blots and densitometric analyses of the phosphorylation of Akt (phospho-Ser473) in liver (A), skeletal muscle (SKM, B), and white adipose tissue (WAT, C) of WT and GSTP-null mice fasted for 6 h and then injected with saline (−) or insulin (+, 1.5 U/kg lean mass ip). Ratios of phospho-Akt-to-total Akt (P-Akt:T-Akt) were normalized to saline-treated WT mice. Values are means ± SE [WT, n = 6; GSTP-null, n = 5; *P < 0.05, saline (−) vs. insulin (+)].
Hepatic gluconeogenesis and inflammation in GSTP-null mice: a mechanism?
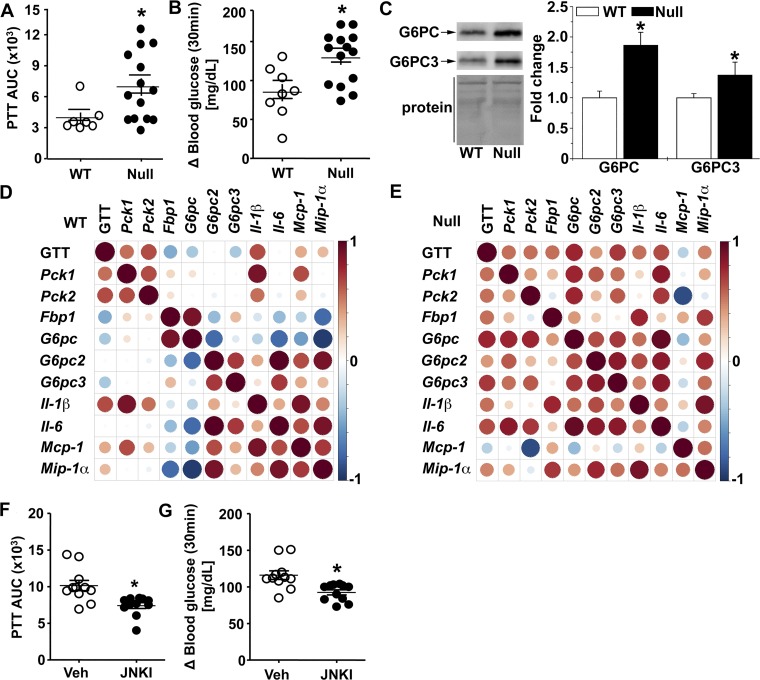
Because the level of blood glucose is a consequence of the opposing forces of glucose uptake and glucose output (49) and because the depletion of GSTP had no effect on insulin signaling in insulin-sensitive organs (i.e., liver, skeletal muscle, or adipose tissue), we tested whether GSTP-null mice had increased glucose output. For this, we conducted a PTT that largely reflects hepatic gluconeogenesis. After the pyruvate bolus injection, GSTP-null mice had a significantly greater blood glucose excursion (i.e., greater PTTAUC) and a higher glucose appearance rate than WT mice (Fig. 9, A and B). Moreover, the PTTAUC was significantly correlated with the GTTAUC (r2 = 0.3, P = 0.02) in the same individual GSTP-null mice. These data further support the idea that hepatic glucose output is a major contributor to glucose intolerance in GSTP-null mice.
Fig. 9.
Glutathione S-transferase (GST) pi-isoform (GSTP) deficiency increases gluconeogenesis via JNK signaling. A and B: blood glucose levels after pyruvate tolerance test (PTT) measured as area under the curve (PTTAUC, A) and glucose appearance rate (delta 30-min blood glucose values relative to baseline, B) in wild-type (WT, n = 7) and GSTP-deficient (GSTP-null, n = 15) mice. C: representative Western blots of hepatic levels of gluconeogenic proteins, glucose-6-phosphatase catalytic subunit (G6PC) and G6PC3, in NC-fed WT and GSTP-null mice (n = 6 WT and GSTP-null mice for each blot). D and E: Spearman’s correlation coefficient analyses between hepatic mRNA levels of gluconeogenic and inflammatory markers in normal chow-fed WT and GSTP-null mice (n = 6–8). Color and size of spheres represent strength of correlation; that is, large, dark brown spheres represent perfect positive correlation (+1), and large, dark blue spheres represent perfect negative correlation (−1). Fbp, fructose-1,6-bisphosphatase; Mcp, monocyte chemoattractant protein; Mip, macrophage inflammatory protein; Pck, phosphoenolpyruvate carboxykinase. F and G: in GSTP-null mice treated with either vehicle (Veh, n = 11) or JNK inhibitor [JNKI, 1,9-pyrazoloanthrone (SP600125), 5 mg·day−1·kg body wt−1, 7 days, n = 11], blood glucose levels after PTT measured as area under the curve (F) and glucose appearance rate (delta 30-min blood glucose values relative to baseline, G). Values are means ± SE (*P < 0.05, WT vs. GSTP-null or Veh vs. JNKI).
Because hepatic glucose output is a product of gluconeogenesis that is dependent on its rate-limiting enzymes, PCK and glucose-6-phosphatase (G6PC; 27), we examined hepatic Pck1 and Pck2 mRNA levels and PCK activity using a well-established assay (52). We did not detect any differences in Pck1 or Pck2 mRNA or PCK activity between WT and GSTP-null mice (Table 3; data not shown). Thus, we measured mRNA levels of three isoforms of G6pc, which encode enzymes regulating the last step in glucose formation, i.e., dephosphorylation of glucose-6-phosphate. Surprisingly, we found increased abundance of hepatic G6pc2 and G6pc3 mRNA in GSTP-null mice compared with WT mice (Table 3). To validate the mRNA levels, we measured the protein levels of G6PC enzymes, and indeed, levels of G6PC and G6PC3 were significantly higher in livers of GSTP-null versus WT mice (Fig. 9C).
Table 3.
Levels of metabolic and inflammatory marker gene mRNAs in livers of male WT and GSTP-null mice fed normal chow diet
| WT |
GSTP-Null |
||||
|---|---|---|---|---|---|
| Gene | Ct | Relative Rplp0 ∆Ct | Ct | Relative Rplp0 ∆Ct | GSTP-Null/WT 2−∆∆Ct |
| Pck1 | 23.2 ± 0.3 | 1.6 ± 0.1 | 23.8 ± 0.3 | 2.1 ± 0.3 | 0.7 ± 0.3 |
| Pck2 | 34.8 ± 0.7 | 13.2 ± 0.6 | 34.5 ± 0.2 | 12.9 ± 0.2 | 1.2 ± 0.3 |
| Fbp1 | 31.6 ± 0.3 | 10.0 ± 0.0 | 31.2 ± 0.2 | 9.6 ± 0.2 | 1.3 ± 0.2 |
| G6pc | 25.0 ± 0.3 | 3.4 ± 0.5 | 25.6 ± 0.4 | 4.0 ± 0.3 | 0.7 ± 0.3 |
| G6pc2 | 29.8 ± 0.7 | 8.1 ± 0.9 | 28.8 ± 0.6 | 7.2 ± 0.4 | 2.0 ± 0.3 |
| G6pc3 | 29.3 ± 0.6 | 7.6 ± 0.6 | 28.1 ± 0.4 | 6.4 ± 0.2 | 2.2 ± 0.1 |
| Il1b | 29.2 ± 0.4 | 8.6 ± 0.3 | 29.3 ± 0.4 | 9.1 ± 0.3 | 0.7 ± 0.3 |
| Il6 | 28.3 ± 0.5 | 7.8 ± 0.6 | 28.2 ± 0.6 | 8.0 ± 0.5 | 0.9 ± 0.5 |
| Mcp1 | 28.9 ± 0.5 | 8.4 ± 0.4 | 29.1 ± 0.4 | 8.9 ± 0.4 | 0.7 ± 0.4 |
| Mip1a | 29.7 ± 0.5 | 9.1 ± 0.7 | 28.1 ± 0.4 | 7.9 ± 0.2 | 2.3 ± 0.1 |
| Rplp0 | 20.5 ± 0.4 to 21.6 ± 0.4 | 20.2 ± 0.3 to 21.6 ± 0.2 | |||
Values are means ± SE; n = 6 mice for wild-type (WT) and glutathione S-transferase pi-isoform (GSTP)-null mice. Ct, threshold cycle; Fbp, fructose-1,6-bisphosphatase; G6pc, glucose-6-phosphatase catalytic subunit; Mcp, monocyte chemoattractant protein; Mip, macrophage inflammatory protein; Pck, phosphoenolpyruvate carboxykinase; Rplp0, acidic ribosomal phosphoprotein P0.
JNK, inflammation, and hepatic gluconeogenesis.
Because activated JNK is linked with inflammatory signaling (22, 42), we measured the hepatic abundance of several inflammatory genes. The hepatic mRNA level of macrophage inflammatory protein-1α (Mip1a; ~6-fold, P < 0.05), but not monocyte chemotactic protein-1 (Mcp1), interleukin-6 (Il6), or interleukin-1β (Il1b), was significantly greater in GSTP-null mice compared with WT mice (Table 3). To address whether the hepatic levels of gluconeogenic and inflammatory marker mRNAs were related, we performed Spearman’s rank correlation coefficient test. Several inflammatory-gluconeogenic marker pairs were regulated differentially between WT and GSTP-null mice. For example, four of the five pairs of differentially correlated genes were between an inflammatory gene and a gluconeogenic gene (Fig. 9, D and E). This difference revealed a strong relationship between basally activated JNK, inflammatory cytokines, and altered gluconeogenic genes in the liver of GSTP-null mice, which may contribute to increased glucose output in both GTT and PTT challenges.
To test the idea that activated JNK promoted glucose intolerance by increasing both inflammation and gluconeogenesis, we treated sibling-matched GSTP-null mice with either vehicle or JNK inhibitor, SP600125 (3, 13). After 7 days, the JNK inhibitor treatment significantly suppressed glucose intolerance by 45 ± 7% (as PTTAUC) and decreased glucose appearance at 30 min compared with vehicle-treated controls (Fig. 9, F and G). To assess the targets altered by SP600125 treatment, we measured hepatic mRNA levels of gluconeogenic and inflammatory marker genes. As expected, JNK inhibitor significantly altered the relationships between functional outcomes and levels of hepatic mRNAs versus vehicle-treated mice. For example, correlations between PTTAUC and Pck (P = 0.05) and G6pc and Mcp1 (P = 0.02) were significantly altered, indicating that JNK-dependent inflammatory signaling likely increased basal hepatic gluconeogenesis in GSTP-null mice. The JNK inhibitor treatment, however, had no effect on fasting blood glucose, body weight, fat mass, or hepatic JNK phosphorylation compared with saline-treated controls (data not shown). These latter data suggest that upstream kinases, such as MKK4, were not inhibited by SP600125 in GSTP-null mice and that there was no off-target toxicity. Collectively, JNK activation, likely hepatic (and parenchymal) in origin, appeared responsible, in part, for the increased hepatic gluconeogenesis in NC-fed GSTP-null mice (Fig. 10).
Fig. 10.
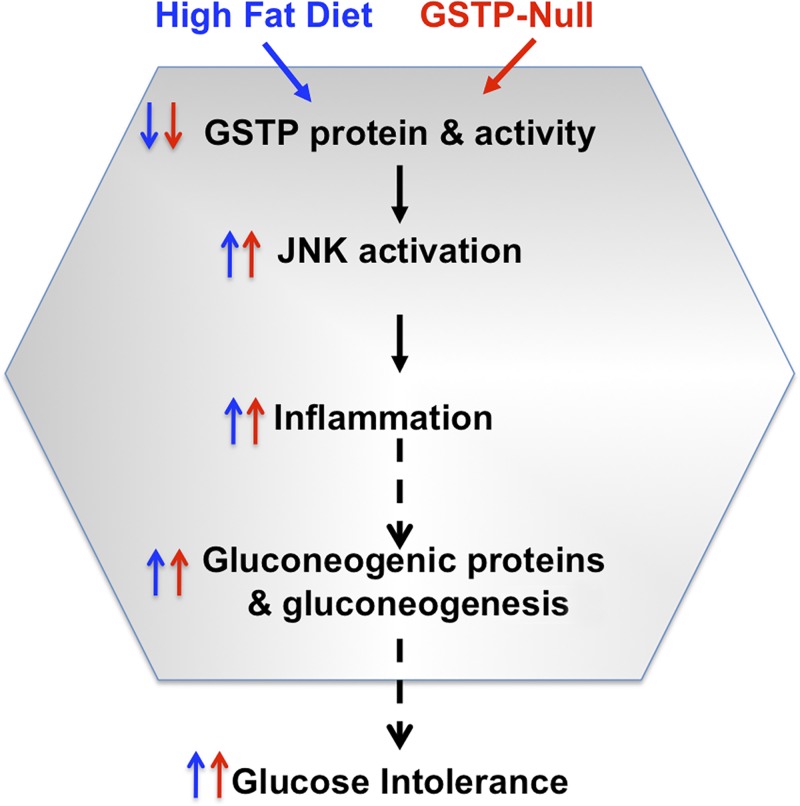
Schematic illustrating the parallel, sequential, and shared effects between our two models: high-fat diet feeding in wild-type mice (blue) and glutathione S-transferase pi-isoform (GSTP) depletion in GSTP-null mice (red) on glucose homeostasis via a hepatic-specific and JNK-dependent inflammatory process that increased hepatic gluconeogenesis and glucose intolerance, an early stage of metabolic dysregulation.
DISCUSSION
The major finding of this study is the novel contribution of hepatic GSTP in glucose handling. We found that short-term (4-wk) HFD feeding in mice significantly downregulates several hepatic GST proteins including GSTP and that glucose intolerance in HFD-fed mice correlated with the hepatic levels of JNK activation (phospho-p54). These early HFD-induced hepatic changes were recapitulated in GSTP-null mice fed normal chow, indicating that GSTP deficiency alone is sufficient to induce a state of glucose intolerance (Fig. 10). Hepatic JNK activation in GSTP-null mice was documented nearly two decades ago (16). Thus, it was not a surprise that HFD feeding in GSTP-null mice did not exaggerate glucose intolerance as it was present basally. This supports a novel, nonredundant role of GSTP downregulation in subsequent JNK activation in the liver. Our experiments showing that inhibition of JNK reverses hepatic gluconeogenesis in GSTP-null mice support the role of activated JNK in mediating glucose intolerance via augmenting hepatic glucose output in GSTP-null mice. Taken together, these findings suggest that downregulation of hepatic GSTP (whether by HFD, genetic manipulation, or perhaps genetic polymorphism) may selectively increase hepatic JNK activation, which, in turn, alters hepatic signaling to promote gluconeogenesis and glucose intolerance especially during a glucose challenge, as occurs in normal feeding. We believe that early changes in hepatic GSTP promote a subsequent cascade of deleterious events (Fig. 10) that ultimately promotes the development of diabetes.
In the present study, we provide several lines of evidence that hepatic JNK activation contributes to the early derangements in systemic glucose homeostasis. First, we show that JNK phosphorylation (phospho-p54) is selectively increased in the livers of both HFD-fed WT mice (after short-term feeding) and basally in NC-fed GSTP-null mice. Second, the level of phospho-JNK is positively correlated with the level of glucose intolerance. Third, the JNK inhibitor, SP600125, significantly corrected pyruvate bolus-induced glucose excursions (PTT; see Fig. 9). The latter experiment supports the idea that JNK activity augments hepatic gluconeogenesis independently of obesity. Thus, the absence of GSTP is sufficient to promote hepatic JNK activation and hepatic gluconeogenesis, both of which are known mediators of hyperglycemia in T2D (18). Even though augmented JNK activation in peripheral tissues is known to mediate glucose intolerance and IR in mouse models (28, 34), previous work has not addressed the earliest events that precede the development of systemic IR. Indeed, our study shows that insulin signaling is intact and robust in all major glucose disposal organs (liver, skeletal muscle, and adipose tissue) of GSTP-null mice despite activation of JNK in the liver. These observations suggest that increased hepatic glucose output precedes systemic and hepatic IR per se and that GSTP activity, particularly in the liver, is an important regulator of glucose intolerance, even in the absence of frank systemic IR. Importantly, GSTP-null mice were identical to WT mice in body composition, metabolism, activity, fasting blood glucose and plasma insulin levels, and food and water intake (Fig. 5 and Table 2). These data indicate a selective effect of GSTP deletion on hepatic glucose output especially during postprandial blood glucose excursions. Moreover, we observed a continuum of glucose intolerance in GSTP-deficient mice (see Fig. 5, B and C) that likely reflects a currently unidentified environmental or genetic stress factor in these mice.
Hepatic JNK activation has been shown to play a pivotal role in causing glucose intolerance and systemic IR in obese animals (32). Although the mechanisms by which JNK augments hepatic gluconeogenesis remain unclear, we uncovered a strong relationship between rate-limiting gluconeogenic enzymes, especially G6PC and G6PC3, in GSTP-null mice. Both G6PC and G6PC3 proteins were significantly increased in livers of GSTP-null mice, a novel finding that links JNK activation with a direct mechanism of increased glucose output. How JNK activation increases G6PC proteins is unclear, but it is known that the cytokines IL-1β and IL-10 can influence hepatocyte PCK mRNA, protein, and enzyme activity demonstrating an interaction between Kupffer cells and hepatocyte gluconeogenesis (55). Similarly, hepatic and circulating chemokines such as MIP-1α and MCP-1 are potential candidates linking obesity with systemic IR in humans and mice (24, 50). In our present study, JNK inhibitor treatment disrupted the relationships both between metabolic phenotype (PTTAUC) and hepatic Pck mRNA and between G6pc and Mcp1 mRNAs (see Fig. 9, D and E) indicating complex relationships between JNK signaling, inflammation, and gluconeogenesis. Yet SP600125 treatment did not alter Mip1a mRNA levels, and thus, we infer that MIP-1α acts upstream of JNK rather than being a consequence of JNK activity. Nonetheless, further analyses of specific signaling events (e.g., cell type and JNK isoform) and targets of JNK (e.g., activator protein-1 signaling and transcription) are required to delineate the selective role of GSTP deficiency in JNK-augmented hepatic gluconeogenesis, especially as an early event in diet-induced glucose intolerance.
In summary, we show that short-term HFD feeding induces glucose intolerance in mice that is concomitant with decreased GSTP abundance and increased phospho-p54 JNK in the liver. This phenotype was recapitulated in a mouse model of GSTP deficiency independent of HFD, obesity, or defects in insulin signaling in major glucose disposal organs. Activated JNK (perhaps JNK1 in hepatic macrophages or parenchyma or both) appears to orchestrate a relationship between hepatic cytokines (inflammation) and the gluconeogenic G6P enzymes that predisposes the liver of GSTP-null mice to increased glucose output during a challenge (i.e., GTT or PTT). Because GSTP is normally expressed at low levels in human liver (26) and is highly polymorphic (25), additional studies of diet-induced dysregulation of hepatic GSTP in human obesity, NAFLD, and diabetes are warranted (23). Modulating changes in hepatic GSTP abundance, e.g., dietary intervention with cruciferous vegetables to increase GSTP expression (56), may provide insight into mechanisms underlying diet-induced glucose intolerance and interindividual variations in T2D susceptibility.
GRANTS
This study was supported by National Institute of General Medical Sciences Grant GM-103492 and University of Louisville Integrated Programs in Biomedical Sciences Fellowship Award (to S. G. Dastidar). The study was also supported in part by the National Heart, Lung, and Blood Institute (HL130174) and the American Diabetes Association Pathway to Stop Diabetes (ADA 1-16-JDF-041).
DISCLAIMERS
The content is solely the responsibility of the authors and does not necessarily represent the official views of the grant-funding agency.
DISCLOSURES
No conflicts of interest, financial or otherwise, are declared by the authors.
AUTHOR CONTRIBUTIONS
S.G.D., A.B., and D.J.C. conceived and designed research; S.G.D., G.J., and D.J.C. performed experiments; S.G.D., G.J., J.S., and D.J.C. analyzed data; S.G.D., G.J., B.G.H., and D.J.C. interpreted results of experiments; S.G.D., P.H., and D.J.C. prepared figures; S.G.D. and D.J.C. drafted manuscript; S.G.D., G.J., P.H., J.S., B.G.H., A.B., and D.J.C. edited and revised manuscript; S.G.D., G.J., P.H., J.S., B.G.H., A.B., and D.J.C. approved final version of manuscript.
ACKNOWLEDGMENTS
We thank G. Shirk, D. Mosley, E. Steinmetz, D. Hoetker, Y. Zheng, and A. Kalani (Diabetes and Obesity Center, University of Louisville) for expert technical assistance. We are grateful to Dr. R. A. Prough, University of Louisville, for the gift of GST antibodies. We also thank Drs. C. Henderson and R. Wolf, University of Dundee, for the donation of GSTP1/P2 WT and null mice.
A portion of this study was presented in poster form at Experimental Biology 2016, San Diego, CA, on April 4, 2016 [Dastidar SG, Jagatheesan G, Bhatnagar A, Conklin DJ, Glutathione S-transferase-P and JNK activation in glucose intolerance in mice (Abstract), FASEB J 30, Suppl: 956.2, 2016].
REFERENCES
- 1.Adler V, Yin Z, Fuchs SY, Benezra M, Rosario L, Tew KD, Pincus MR, Sardana M, Henderson CJ, Wolf CR, Davis RJ, Ronai Z. Regulation of JNK signaling by GSTp. EMBO J 18: 1321–1334, 1999. doi: 10.1093/emboj/18.5.1321. [DOI] [PMC free article] [PubMed] [Google Scholar]
- 2.Ayala JE, Samuel VT, Morton GJ, Obici S, Croniger CM, Shulman GI, Wasserman DH, McGuinness OP; NIH Mouse Metabolic Phenotyping Center Consortium . Standard operating procedures for describing and performing metabolic tests of glucose homeostasis in mice. Dis Model Mech 3: 525–534, 2010. doi: 10.1242/dmm.006239. [DOI] [PMC free article] [PubMed] [Google Scholar]
- 3.Bennett BL, Sasaki DT, Murray BW, O’Leary EC, Sakata ST, Xu W, Leisten JC, Motiwala A, Pierce S, Satoh Y, Bhagwat SS, Manning AM, Anderson DW. SP600125, an anthrapyrazolone inhibitor of Jun N-terminal kinase. Proc Natl Acad Sci USA 98: 13681–13686, 2001. doi: 10.1073/pnas.251194298. [DOI] [PMC free article] [PubMed] [Google Scholar]
- 4.Bid HK, Konwar R, Saxena M, Chaudhari P, Agrawal CG, Banerjee M. Association of glutathione S-transferase (GSTM1, T1 and P1) gene polymorphisms with type 2 diabetes mellitus in north Indian population. J Postgrad Med 56: 176–181, 2010. doi: 10.4103/0022-3859.68633. [DOI] [PubMed] [Google Scholar]
- 5.Bligh EG, Dyer WJ. A rapid method of total lipid extraction and purification. Can J Biochem Physiol 37: 911–917, 1959. doi: 10.1139/y59-099. [DOI] [PubMed] [Google Scholar]
- 6.Cefalu WT, Petersen MP, Ratner RE. The alarming and rising costs of diabetes and prediabetes: a call for action! Diabetes Care 37: 3137–3138, 2014. doi: 10.2337/dc14-2329. [DOI] [PMC free article] [PubMed] [Google Scholar]
- 7.Chan JC, Malik V, Jia W, Kadowaki T, Yajnik CS, Yoon KH, Hu FB. Diabetes in Asia: epidemiology, risk factors, and pathophysiology. JAMA 301: 2129–2140, 2009. doi: 10.1001/jama.2009.726. [DOI] [PubMed] [Google Scholar]
- 8.Conklin DJ, Guo Y, Jagatheesan G, Kilfoil PJ, Haberzettl P, Hill BG, Baba SP, Guo L, Wetzelberger K, Obal D, Rokosh DG, Prough RA, Prabhu SD, Velayutham M, Zweier JL, Hoetker JD, Riggs DW, Srivastava S, Bolli R, Bhatnagar A. Genetic deficiency of glutathione S-transferase P increases myocardial sensitivity to ischemia-reperfusion injury. Circ Res 117: 437–449, 2015. doi: 10.1161/CIRCRESAHA.114.305518. [DOI] [PMC free article] [PubMed] [Google Scholar]
- 9.Conklin DJ, Haberzettl P, Lesgards JF, Prough RA, Srivastava S, Bhatnagar A. Increased sensitivity of glutathione S-transferase P-null mice to cyclophosphamide-induced urinary bladder toxicity. J Pharmacol Exp Ther 331: 456–469, 2009. doi: 10.1124/jpet.109.156513. [DOI] [PMC free article] [PubMed] [Google Scholar]
- 10.Conklin DJ, Haberzettl P, Prough RA, Bhatnagar A. Glutathione-S-transferase P protects against endothelial dysfunction induced by exposure to tobacco smoke. Am J Physiol Heart Circ Physiol 296: H1586–H1597, 2009. doi: 10.1152/ajpheart.00867.2008. [DOI] [PMC free article] [PubMed] [Google Scholar]
- 11.Curtis JM, Grimsrud PA, Wright WS, Xu X, Foncea RE, Graham DW, Brestoff JR, Wiczer BM, Ilkayeva O, Cianflone K, Muoio DE, Arriaga EA, Bernlohr DA. Downregulation of adipose glutathione S-transferase A4 leads to increased protein carbonylation, oxidative stress, and mitochondrial dysfunction. Diabetes 59: 1132–1142, 2010. doi: 10.2337/db09-1105. [DOI] [PMC free article] [PubMed] [Google Scholar]
- 12.Das M, Sabio G, Jiang F, Rincón M, Flavell RA, Davis RJ. Induction of hepatitis by JNK-mediated expression of TNF-α. Cell 136: 249–260, 2009. doi: 10.1016/j.cell.2008.11.017. [DOI] [PMC free article] [PubMed] [Google Scholar]
- 13.Drosatos K, Drosatos-Tampakaki Z, Khan R, Homma S, Schulze PC, Zannis VI, Goldberg IJ. Inhibition of c-Jun-N-terminal kinase increases cardiac peroxisome proliferator-activated receptor α expression and fatty acid oxidation and prevents lipopolysaccharide-induced heart dysfunction. J Biol Chem 286: 36331–36339, 2011. doi: 10.1074/jbc.M111.272146. [DOI] [PMC free article] [PubMed] [Google Scholar]
- 14.Eckel RH, Kahn SE, Ferrannini E, Goldfine AB, Nathan DM, Schwartz MW, Smith RJ, Smith SR; Endocrine Society; American Diabetes Association; European Association for the Study of Diabetes . Obesity and type 2 diabetes: what can be unified and what needs to be individualized? Diabetes Care 34: 1424–1430, 2011. doi: 10.2337/dc11-0447. [DOI] [PMC free article] [PubMed] [Google Scholar]
- 16.Elsby R, Kitteringham NR, Goldring CE, Lovatt CA, Chamberlain M, Henderson CJ, Wolf CR, Park BK. Increased constitutive c-Jun N-terminal kinase signaling in mice lacking glutathione S-transferase Pi. J Biol Chem 278: 22243–22249, 2003. doi: 10.1074/jbc.M301211200. [DOI] [PubMed] [Google Scholar]
- 17.Finucane MM, Stevens GA, Cowan MJ, Danaei G, Lin JK, Paciorek CJ, Singh GM, Gutierrez HR, Lu Y, Bahalim AN, Farzadfar F, Riley LM, Ezzati M; Global Burden of Metabolic Risk Factors of Chronic Diseases Collaborating Group (Body Mass Index) . National, regional, and global trends in body-mass index since 1980: systematic analysis of health examination surveys and epidemiological studies with 960 country-years and 9.1 million participants. Lancet 377: 557–567, 2011. doi: 10.1016/S0140-6736(10)62037-5. [DOI] [PMC free article] [PubMed] [Google Scholar]
- 18.Firth RG, Bell PM, Marsh HM, Hansen I, Rizza RA. Postprandial hyperglycemia in patients with noninsulin-dependent diabetes mellitus. Role of hepatic and extrahepatic tissues. J Clin Invest 77: 1525–1532, 1986. doi: 10.1172/JCI112467. [DOI] [PMC free article] [PubMed] [Google Scholar]
- 19.Frohnert BI, Sinaiko AR, Serrot FJ, Foncea RE, Moran A, Ikramuddin S, Choudry U, Bernlohr DA. Increased adipose protein carbonylation in human obesity. Obesity (Silver Spring) 19: 1735–1741, 2011. doi: 10.1038/oby.2011.115. [DOI] [PMC free article] [PubMed] [Google Scholar]
- 20.Gönül N, Kadioglu E, Kocabaş NA, Ozkaya M, Karakaya AE, Karahalil B. The role of GSTM1, GSTT1, GSTP1, and OGG1 polymorphisms in type 2 diabetes mellitus risk: a case-control study in a Turkish population. Gene 505: 121–127, 2012. doi: 10.1016/j.gene.2012.05.025. [DOI] [PubMed] [Google Scholar]
- 21.Habig WH, Pabst MJ, Jakoby WB. Glutathione S-transferases. The first enzymatic step in mercapturic acid formation. J Biol Chem 249: 7130–7139, 1974. [PubMed] [Google Scholar]
- 22.Han MS, Jung DY, Morel C, Lakhani SA, Kim JK, Flavell RA, Davis RJ. JNK expression by macrophages promotes obesity-induced insulin resistance and inflammation. Science 339: 218–222, 2013. doi: 10.1126/science.1227568. [DOI] [PMC free article] [PubMed] [Google Scholar]
- 23.Hardwick RN, Fisher CD, Canet MJ, Lake AD, Cherrington NJ. Diversity in antioxidant response enzymes in progressive stages of human nonalcoholic fatty liver disease. Drug Metab Dispos 38: 2293–2301, 2010. doi: 10.1124/dmd.110.035006. [DOI] [PMC free article] [PubMed] [Google Scholar]
- 24.Haukeland JW, Damås JK, Konopski Z, Løberg EM, Haaland T, Goverud I, Torjesen PA, Birkeland K, Bjøro K, Aukrust P. Systemic inflammation in nonalcoholic fatty liver disease is characterized by elevated levels of CCL2. J Hepatol 44: 1167–1174, 2006. doi: 10.1016/j.jhep.2006.02.011. [DOI] [PubMed] [Google Scholar]
- 25.Hayes JD, Flanagan JU, Jowsey IR. Glutathione transferases. Annu Rev Pharmacol Toxicol 45: 51–88, 2005. doi: 10.1146/annurev.pharmtox.45.120403.095857. [DOI] [PubMed] [Google Scholar]
- 26.Hayes PC, May L, Hayes JD, Harrison DJ. Glutathione S-transferases in human liver cancer. Gut 32: 1546–1549, 1991. doi: 10.1136/gut.32.12.1546. [DOI] [PMC free article] [PubMed] [Google Scholar]
- 27.Herzig S, Long F, Jhala US, Hedrick S, Quinn R, Bauer A, Rudolph D, Schutz G, Yoon C, Puigserver P, Spiegelman B, Montminy M. CREB regulates hepatic gluconeogenesis through the coactivator PGC-1. Nature 413: 179–183, 2001. doi: 10.1038/35093131. [DOI] [PubMed] [Google Scholar]
- 28.Hirosumi J, Tuncman G, Chang L, Görgün CZ, Uysal KT, Maeda K, Karin M, Hotamisligil GS. A central role for JNK in obesity and insulin resistance. Nature 420: 333–336, 2002. doi: 10.1038/nature01137. [DOI] [PubMed] [Google Scholar]
- 29.Kirpich IA, Gobejishvili LN, Bon Homme M, Waigel S, Cave M, Arteel G, Barve SS, McClain CJ, Deaciuc IV. Integrated hepatic transcriptome and proteome analysis of mice with high-fat diet-induced nonalcoholic fatty liver disease. J Nutr Biochem 22: 38–45, 2011. doi: 10.1016/j.jnutbio.2009.11.009. [DOI] [PMC free article] [PubMed] [Google Scholar]
- 30.Lee YH, Giraud J, Davis RJ, White MF. c-Jun N-terminal kinase (JNK) mediates feedback inhibition of the insulin signaling cascade. J Biol Chem 278: 2896–2902, 2003. doi: 10.1074/jbc.M208359200. [DOI] [PubMed] [Google Scholar]
- 31.Merrell MD, Cherrington NJ. Drug metabolism alterations in nonalcoholic fatty liver disease. Drug Metab Rev 43: 317–334, 2011. doi: 10.3109/03602532.2011.577781. [DOI] [PMC free article] [PubMed] [Google Scholar]
- 32.Nakatani Y, Kaneto H, Kawamori D, Hatazaki M, Miyatsuka T, Matsuoka TA, Kajimoto Y, Matsuhisa M, Yamasaki Y, Hori M. Modulation of the JNK pathway in liver affects insulin resistance status. J Biol Chem 279: 45803–45809, 2004. doi: 10.1074/jbc.M406963200. [DOI] [PubMed] [Google Scholar]
- 33.Ogden CL, Carroll MD, Fryar CD, Flegal KM. Prevalence of obesity among adults and youth: United States, 2011–2014. NCHS Data Brief 219: 1–8, 2015. [PubMed] [Google Scholar]
- 34.Ozcan U, Cao Q, Yilmaz E, Lee AH, Iwakoshi NN, Ozdelen E, Tuncman G, Görgün C, Glimcher LH, Hotamisligil GS. Endoplasmic reticulum stress links obesity, insulin action, and type 2 diabetes. Science 306: 457–461, 2004. doi: 10.1126/science.1103160. [DOI] [PubMed] [Google Scholar]
- 35.Pal A, Hu X, Zimniak P, Singh SV. Catalytic efficiencies of allelic variants of human glutathione S-transferase Pi in the glutathione conjugation of α,β-unsaturated aldehydes. Cancer Lett 154: 39–43, 2000. doi: 10.1016/S0304-3835(00)00390-6. [DOI] [PubMed] [Google Scholar]
- 36.Rathmann W, Giani G. Global prevalence of diabetes: estimates for the year 2000 and projections for 2030. Diabetes Care 27: 2568–2569, 2004. doi: 10.2337/diacare.27.10.2568. [DOI] [PubMed] [Google Scholar]
- 37.Ratziu V, Bellentani S, Cortez-Pinto H, Day C, Marchesini G. A position statement on NAFLD/NASH based on the EASL 2009 special conference. J Hepatol 53: 372–384, 2010. doi: 10.1016/j.jhep.2010.04.008. [DOI] [PubMed] [Google Scholar]
- 37a.R Core Team. R: A Language and Environment for Statistical Computing. Vienna, Austria: R Foundation for Statistical Computing, 2014. https://www.R-project.org. [Google Scholar]
- 38.Sabio G, Das M, Mora A, Zhang Z, Jun JY, Ko HJ, Barrett T, Kim JK, Davis RJ. A stress signaling pathway in adipose tissue regulates hepatic insulin resistance. Science 322: 1539–1543, 2008. doi: 10.1126/science.1160794. [DOI] [PMC free article] [PubMed] [Google Scholar]
- 39.Samuel VT, Liu ZX, Qu X, Elder BD, Bilz S, Befroy D, Romanelli AJ, Shulman GI. Mechanism of hepatic insulin resistance in non-alcoholic fatty liver disease. J Biol Chem 279: 32345–32353, 2004. doi: 10.1074/jbc.M313478200. [DOI] [PubMed] [Google Scholar]
- 40.Samuel VT, Shulman GI. Mechanisms for insulin resistance: common threads and missing links. Cell 148: 852–871, 2012. doi: 10.1016/j.cell.2012.02.017. [DOI] [PMC free article] [PubMed] [Google Scholar]
- 41.Smits MM, Ioannou GN, Boyko EJ, Utzschneider KM. Non-alcoholic fatty liver disease as an independent manifestation of the metabolic syndrome: results of a US national survey in three ethnic groups. J Gastroenterol Hepatol 28: 664–670, 2013. doi: 10.1111/jgh.12106. [DOI] [PubMed] [Google Scholar]
- 42.Solinas G, Vilcu C, Neels JG, Bandyopadhyay GK, Luo JL, Naugler W, Grivennikov S, Wynshaw-Boris A, Scadeng M, Olefsky JM, Karin M. JNK1 in hematopoietically derived cells contributes to diet-induced inflammation and insulin resistance without affecting obesity. Cell Metab 6: 386–397, 2007. doi: 10.1016/j.cmet.2007.09.011. [DOI] [PubMed] [Google Scholar]
- 43.Stoian A, Bănescu C, Bălaşa RI, Moţăţăianu A, Stoian M, Moldovan VG, Voidăzan S, Dobreanu M. Influence of GSTM1, GSTT1, and GSTP1 polymorphisms on type 2 diabetes mellitus and diabetic sensorimotor peripheral neuropathy risk. Dis Markers 2015: 638693, 2015. doi: 10.1155/2015/638693. [DOI] [PMC free article] [PubMed] [Google Scholar]
- 44.Tajiri S, Oyadomari S, Yano S, Morioka M, Gotoh T, Hamada JI, Ushio Y, Mori M. Ischemia-induced neuronal cell death is mediated by the endoplasmic reticulum stress pathway involving CHOP. Cell Death Differ 11: 403–415, 2004. doi: 10.1038/sj.cdd.4401365. [DOI] [PubMed] [Google Scholar]
- 45.Tang ST, Wang CJ, Tang HQ, Zhang Q, Wang Y. Evaluation of glutathione S-transferase genetic variants affecting type 2 diabetes susceptibility: a meta-analysis. Gene 530: 301–308, 2013. doi: 10.1016/j.gene.2013.08.043. [DOI] [PubMed] [Google Scholar]
- 47.Thévenin AF, Zony CL, Bahnson BJ, Colman RF. GSTpi modulates JNK activity through a direct interaction with JNK substrate, ATF2. Protein Sci 20: 834–848, 2011. doi: 10.1002/pro.609. [DOI] [PMC free article] [PubMed] [Google Scholar]
- 48.Tolman KG, Fonseca V, Dalpiaz A, Tan MH. Spectrum of liver disease in type 2 diabetes and management of patients with diabetes and liver disease. Diabetes Care 30: 734–743, 2007. doi: 10.2337/dc06-1539. [DOI] [PubMed] [Google Scholar]
- 49.Triplitt CL. Examining the mechanisms of glucose regulation. Am J Manag Care 18, Suppl 1: S4–S10, 2012. [PubMed] [Google Scholar]
- 50.Westerbacka J, Kolak M, Kiviluoto T, Arkkila P, Sirén J, Hamsten A, Fisher RM, Yki-Järvinen H. Genes involved in fatty acid partitioning and binding, lipolysis, monocyte/macrophage recruitment, and inflammation are overexpressed in the human fatty liver of insulin-resistant subjects. Diabetes 56: 2759–2765, 2007. doi: 10.2337/db07-0156. [DOI] [PubMed] [Google Scholar]
- 51.Wheat LA, Haberzettl P, Hellmann J, Baba SP, Bertke M, Lee J, McCracken J, O’Toole TE, Bhatnagar A, Conklin DJ. Acrolein inhalation prevents vascular endothelial growth factor-induced mobilization of Flk-1+/Sca-1+ cells in mice. Arterioscler Thromb Vasc Biol 31: 1598–1606, 2011. doi: 10.1161/ATVBAHA.111.227124. [DOI] [PMC free article] [PubMed] [Google Scholar]
- 52.Wiese TJ, Lambeth DO, Ray PD. The intracellular distribution and activities of phosphoenolpyruvate carboxykinase isozymes in various tissues of several mammals and birds. Comp Biochem Physiol B 100: 297–302, 1991. doi: 10.1016/0305-0491(91)90378-Q. [DOI] [PubMed] [Google Scholar]
- 53.Wildman RP, Muntner P, Reynolds K, McGinn AP, Rajpathak S, Wylie-Rosett J, Sowers MR. The obese without cardiometabolic risk factor clustering and the normal weight with cardiometabolic risk factor clustering: prevalence and correlates of 2 phenotypes among the US population (NHANES 1999–2004). Arch Intern Med 168: 1617–1624, 2008. doi: 10.1001/archinte.168.15.1617. [DOI] [PubMed] [Google Scholar]
- 54.Xiao GH, Pinaire JA, Rodrigues AD, Prough RA. Regulation of the Ah gene battery via Ah receptor-dependent and independent processes in cultured adult rat hepatocytes. Drug Metab Dispos 23: 642–650, 1995. [PubMed] [Google Scholar]
- 55.Yerkovich ST, Rigby PJ, Fournier PA, Olynyk JK, Yeoh GC. Kupffer cell cytokines interleukin-1β and interleukin-10 combine to inhibit phosphoenolpyruvate carboxykinase and gluconeogenesis in cultured hepatocytes. Int J Biochem Cell Biol 36: 1462–1472, 2004. doi: 10.1016/j.biocel.2003.10.022. [DOI] [PubMed] [Google Scholar]
- 56.Zhu H, Jia Z, Strobl JS, Ehrich M, Misra HP, Li Y. Potent induction of total cellular and mitochondrial antioxidants and phase 2 enzymes by cruciferous sulforaphane in rat aortic smooth muscle cells: cytoprotection against oxidative and electrophilic stress. Cardiovasc Toxicol 8: 115–125, 2008. doi: 10.1007/s12012-008-9020-4. [DOI] [PubMed] [Google Scholar]


