Abstract
Loss of retinyl ester (RE)-rich lipid droplets (LDs) from hepatic stellate cells (HSCs) is cited as a key event in their cellular transdifferentiation to activated, pro-fibrotic myofibroblasts; however, it remains unclear if changes in LD morphology or RE content are causal for transdifferentiation. To better understand LD dynamics in vitro within a common model of HSC activation, we used novel approaches preserving LD morphology and allowing for quantitation of RE. The size and quantity of LDs within in vitro and in vivo bile duct ligation (BDL)-activated HSCs were quantitated using adipocyte differentiation-related protein (ADRP) labeling and oil red o (ORO) staining (gold standard), and RE content was determined using fluorescence microscopy. We found during HSC activation in vitro that LD number differed significantly when measured by ADRP and ORO, respectively (day 1: 56 vs. 5, P = 0.03; day 4: 101 vs. 39, P = 0.03; day 14: 241 vs. 12, P = 0.02). Ex vivo HSCs activated in vivo contained the same number of LDs as day 4 in vitro activated HSCs (118 vs. 101, P = 0.54). Decline in LD RE occurred beyond day 4 in vitro and day 1 ex vivo, after HSC transdifferentiation was underway. Lastly, in situ HSCs examined using electron microscopy show LDs tend to be smaller but are ultimately retained in BDL injured livers. Therefore, we conclude that during HSC transdifferentiation, LDs are not lost but are retained, decreasing in size. Additionally, RE content declines after transdifferentiation is underway. These data suggest that these LD changes are not causal for HSC transdifferentiation.
NEW & NOTEWORTHY Loss of retinoid-laden lipid droplets from hepatic stellate cells has long been held as a hallmark of their transdifferentiation into activated myofibroblasts, the dominant cells that drive hepatic fibrosis. This study demonstrates that stellate cells activated in culture and after liver injury in vivo retain their lipid droplets and that these droplets become smaller and more numerous, with decreases in droplet retinoid concentration occurring only after cellular transdifferentiation is underway.
Keywords: hepatic stellate cell, lipid droplet, myofibroblast, retinoid, transdifferentiation
INTRODUCTION
The predominant cell responsible for fibrosis after liver injury is the hepatic stellate cell (HSC) (2, 7, 16, 23–25), which remains in a “quiescent” (normal) state in the healthy liver, acting as the storage site for the vitamin A metabolite retinyl ester (RE). REs are stored within subcellular, membrane-bound organelles known as lipid droplets (LDs) (2, 4). After liver injury in vivo and during growth in culture (which recapitulates many of the cellular changes in vivo during liver injury) (3, 6, 17), HSCs become “activated” and acquire myofibroblast features, including expression of smooth muscle α-actin and production of extracellular matrix components (3, 11, 22–25). The loss of retinoid-containing LDs from HSCs has been accepted as dogma as part of the phenotype of activated rodent (22, 28) and primary (5) and immortalized human HSCs (LX2) (31) in vitro as well as of nonhuman primate HSCs in vivo (19). Additionally, there is an inverse relationship between hepatic retinoid stores and disease severity as retinoid levels decrease along the continuum from persistent hepatitis to cirrhosis (27). Although often discussed, it remains unclear whether the loss of LDs and the REs within them triggers HSC activation or rather is simply a secondary event occurring after HSC activation has begun (2).
The dynamics of LD loss from HSCs in previous studies suggest that LDs grow smaller in size and more numerous before becoming undetectable over several days in culture. Previous work in a validated and commonly employed cell culture model reported that nearly all LDs were lost from HSCs by the time they had become fully activated (day 7 and beyond in culture) (22, 28). These reports used boron-dipyrromethene and oil red o (ORO), respectively, both neutral lipid stains, to identify HSC LDs. Boron-dipyrromethene requires fluorescence for visualization, and although ORO can also be visualized using fluorescence, it is easily visualized with light microscopy, making it an attractive and inexpensive marker for LDs. Although ORO staining has become a well-accepted method for visualizing HSC LDs (17, 20, 22), our own work and that of others raise methodological concerns with its use in detecting LDs (8). This current study sheds light on the controversy surrounding the significance of LD loss from HSCs. We show herein that HSC LDs are not lost in a commonly employed in vitro model of culture–induced activation but are instead retained. Analysis of in situ HSCs using electron microscopy shows that LDs are retained in bile duct ligation (BDL) liver injury, underscoring the physiological relevance of our in vitro findings. Importantly, we also demonstrate that cellular RE levels do not decrease until after HSC activation has begun, suggesting that autologous retinoid signaling does not mediate HSC transdifferentiation into an injurious, fibrotic phenotype.
MATERIALS AND METHODS
HSC isolation and culture.
For in vivo HSC activation studies, BDL was performed on retired male Sprague-Dawley rats (Charles River) weighing ~500 g. With rats under general anesthesia, a midline abdominal incision was made, and two adjacent ligations were placed on the common bile duct ~1 cm from the porta hepatis. The duct was severed between the ligation sites, and the abdomen was closed in two layers. Successful BDL was verified in all experimental animals by the development of cholestasis noted on physical exam of the paws and cirrhotic morphology of the gross liver at the time of vivisection. Animals were euthanized 14 days after BDL or sham surgery, and tissue was processed for electron microscopy (below), or HSCs were isolated from livers as previously described (13). In brief, livers were perfused with 0.20 mg/100 ml of pronase (Roche Molecular Biochemicals, Indianapolis, IN) followed by 0.013 mg/100 ml of collagenase (Crescent Chemical, Hauppauge, NY) while in situ. Density centrifugation was used to isolate HSCs, which were then suspended in modified medium 199 supplemented with 10% horse serum and 10% calf serum (Life Technologies, Gaithersburg, MD) at a density of ~1 × 10⁶ cells/ml. Cells were plated on glass coverslips (Thermo Fisher, Waltham, MA) or chamber sides (MatTek, Ashland, MA) and grown in a humidified incubator containing 95% O2-2.5% CO2 for a time course of 21 days. Only cell preparation cultures yielding greater than 95% viability and purity were used. Experiments were approved by the Medical University of South Carolina Institutional Animal Care and Use Committee, and animal care was in accordance with institutional policies which adhere to the Guide for the Care and Use of Laboratory Animals prepared by the National Institutes of Health (NIH publication 86-23, Revised 2011). LX2 cells, immortalized human HSCs with a myofibroblast-like phenotype, were cultured in DMEM supplemented with 10% fetal bovine serum, 1 mmol/l l-glutamine, and 100 IU/ml streptomycin-penicillin.
ORO staining and immunocytochemistry.
Cultured HSCs were washed 3 times in phosphate-buffered saline (PBS), fixed for 12 min at room temperature with 4% paraformaldehyde in PBS on the indicated culture day [methanol fixation was avoided because it is known to alter protein antigens and disrupt LDs (8, 9)] and were subjected to ORO staining as described (20). In brief, cells were incubated with 1X working stock ORO (Sigma, St. Louis, MO) for 20 min at room temperature, followed by a 15-s rinse in 60% isopropanol. Cells were then counterstained with Richard-Allan Scientific Signature Series Hematoxylin (Thermo Fisher) for 5 min at room temperature and rinsed in PBS. For adipocyte differentiation-related protein (ADRP) labeling, cells were fixed as described above, washed in PBS 3 times, and exposed to anti-mouse ADRP antibody (10-R-A-117-Ax, Fitzgerald, Acton, MA) diluted 1:300 in PBS for 12 h at 4°C followed by exposure to goat anti-mouse IgG secondary antibody, fluorescein isothiocyanate conjugate (Thermo Fisher) diluted 1:300 in PBS for 1 h at room temperature. For smooth muscle α-actin labeling, a Cy3 conjugated antibody (Sigma) diluted 1:500 was applied for 1 h at room temperature. For nuclear labeling, 4',6-diamidino-2-phenylindole, dihydrochloride (Molecular Probes, Eugene, OR) nuclear counterstain was applied at a 1:1,000 dilution for 5 min at room temperature. Coverslips were mounted on slides using FluorSave Reagent water-based mounting media (EMD Millipore, Ontario, CA), and cells were visualized with appropriate filters and photographed (Zeiss Axioimager M2, Carl Zeiss, Thornwood, NY).
Creation of synthetic LDs with specified levels of retinyl palmitate.
Hydrophobic droplets containing variable concentrations of RE (retinyl palmitate) were prepared by mixing retinyl palmitate (Sigma no. 46959-U) and C2-C10 triglycerides (Sigma no. 17810-1-AMP-S). Short-chain triglycerides were chosen because they are liquid at room temperature. Desired amounts of RE and triglycerides were sonicated in an amber vial using a bath sonicator for 5 min. Subsequently, 50 μl of the mixture was added to 1 ml of lactated ringers and dispersed into small droplets by sonicating for 5 min.
Live cell fluorescence microscopy.
Live cells grown in chamber slides were analyzed at indicated time points by removing culture media and replacing it with lactated ringers. Cellular fluorescence was imaged (inverted Zeiss Axiovert 100, Carl Zeiss) with a ×40 Fluor oil immersion lens (numerical aperture = 1.3). The light for excitation was provided by a Xenon continuous arc light source from Sutter Instrument Company (Novato, CA), and fluorescence images were acquired with a Hamamatsu CCD camera (Hamamatsu Photonics, Hamamatsu City, Japan). RE fluorescence was measured in 2 ways: 1) in experiments for co-localization with ADRP, with a broadband (40-nm bandwidth) 360-nm filter with emission measured through a 457-nm filter (50-nm bandwidth) and 2) in experiments for estimating the levels of RE in droplets with narrow bandpass (10-nm bandwidth) filters centered at 340 and 380 nm with emission collected through a longpass 420-nm filter (emission >420 nm). Fluorescence imaging of hydrophobic droplets containing different concentrations of RE was carried out as in method 2 above. Fluorescein isothiocyanate (ADRP secondary antibody) fluorescence was excited with 490 nm and emission was measured through a 528-nm filter. ORO fluorescence was excited with 490 nm and emission was measured through a 617-nm filter. Hardware control and image acquisition were carried out using Slidebook (Intelligent Imaging Innovations, Denver, CO). The ratios of fluorescence intensities excited with 340 and 380 nm (Fex-340:Fex-380; emission >420 nm) was measured using the Ratio Plus module of ImageJ. The values for the background intensities were measured in defined regions of interest adjacent to the cell. The distribution of the ratio values was measured for the region of the cell with RE containing LDs as indicated by the fluorescence.
Electron microscopy of sham and BDL injured rodent livers.
Multiple 2-mm3 liver samples were placed in Trump’s fixative (1% glutaraldehyde and 4% formaldehyde in 0.1 M phosphate buffer, pH 7.2) for 24 h. The liver was rinsed for 30 min in 3 changes of 0.1 M phosphate buffer, pH 7.2, followed by a 1-h postfix in phosphate-buffered 1% OsO4 and three 30-min rinses in distilled water. The tissue was en bloc stained with 2% uranyl acetate for 30 min at 60°C, rinsed in 3 changes of distilled water, dehydrated in progressive concentrations of ethanol and 100% propylene oxide, and embedded in Spurr's resin. Thin (90 nm) sections were cut on a Reichert Ultracut E ultramicrotome, mounted on mesh copper grids, and stained with lead citrate. Photomicrographs were taken on a JEOL JEM-1400 transmission electron microscope.
Data analysis and statistics.
All experiments were performed in triplicate or quadruplicate from a minimum of three independent animals with controls matched as described above. For in vitro and in vivo studies, LDs were counted manually, and droplet diameters were measured using ImageJ software. A minimum of 10 cells per animal per condition (and per culture day for in vitro experiments) were analyzed. Average LD number and diameter are reported with error bars representing 1 standard deviation of the mean. Average total HSC RE content was calculated by counting total LDs for a minimum of 10 cells per day in culture and adding their total volume under the assumption that LDs are spherical using the equation 4πr2 multiplied by the estimated RE percentage as derived from their size versus 340:380 ratio. The unpaired Student’s t-test was performed for all comparisons. Statistical significance was assumed at a level of P < 0.05.
RESULTS
ORO labeling of HSC LDs.
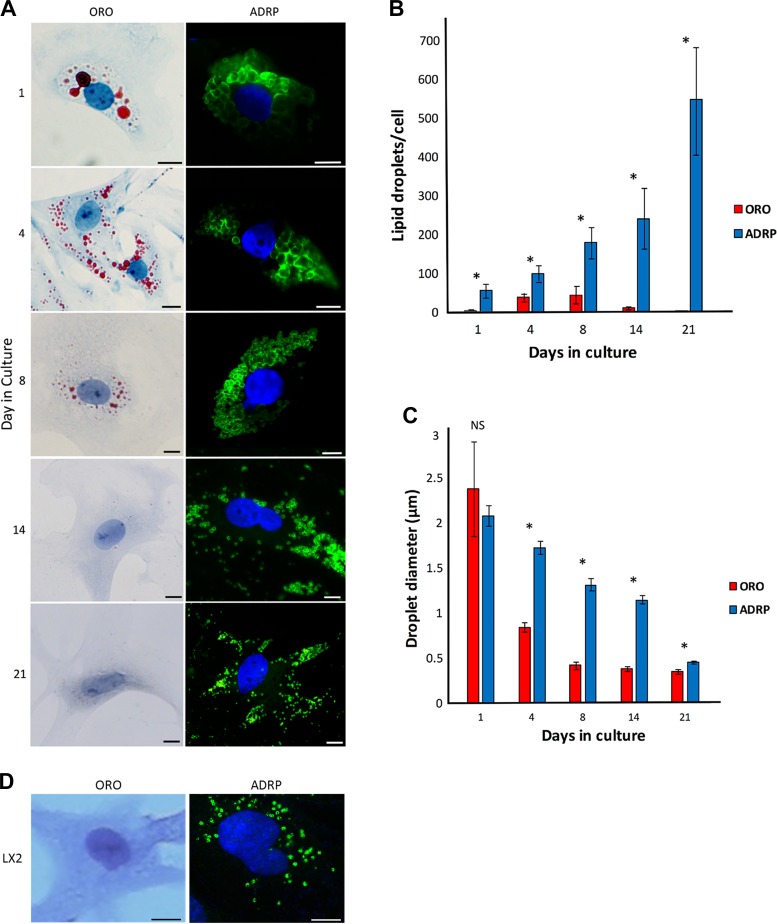
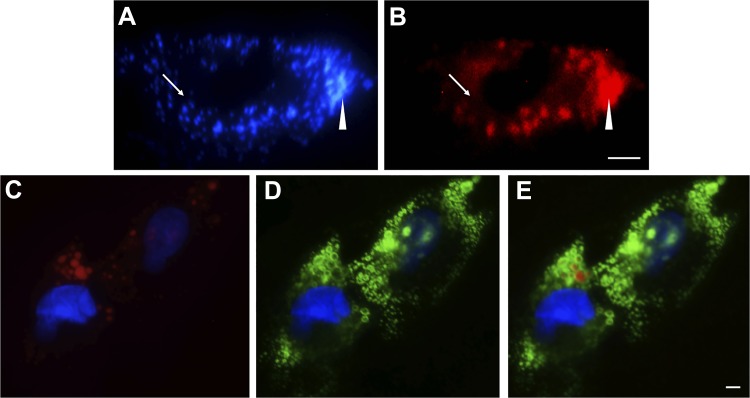
Seeking a more sensitive method for visualizing LDs within HSCs over the time course of culture-induced activation, we isolated and grew HSCs from normal rats as previously described (13) and verified their conversion to a myofibroblast phenotype by day 4 in culture as evidenced by characteristic changes in morphology as well as expression of smooth muscle α-actin and extracellular matrix proteins as described previously (3, 6, 11, 23–25). We first examined LDs with ORO labeling, considered to be the gold standard technique. We found that with this methodology, freshly isolated HSC (day 1 in culture) LDs were large and localized in a perinuclear pattern (Fig. 1A), with 5 ± 3 LDs per cell of an average diameter of 2.4 μm with high intradroplet size variability (Fig. 1, B and C). By day 4 in culture, HSCs exhibited a fully activated phenotype as evidenced by characteristic morphologic changes (Fig. 1A) and on average contained 39 ± 20 LDs per cell that had decreased in diameter to 0.84 ± 0.17 μm (Fig. 1, B and C ). By day 8 of in vitro culture, LDs peaked in number (44 ± 44 per cell) and further decreased in diameter (0.42 ± 0.14 μm) (Fig. 1, B and C), appearing diminutive in size (Fig. 1A). By day 14 in culture, LD number decreased drastically (12 ± 5 per cell) (Fig. 1B), and by day 21 in culture, most cells lacked detectable LDs (2 ± 1 per cell) (Fig. 1, A and B). We also noted that ORO caused apparent fusion of LDs (Fig. 2, A and B) as previously described (8) and did not label smaller LDs (Fig. 2, A–E). Lastly, we verified the findings of others (31) that LX2 immortalized HSCs demonstrate no detectable LDs with ORO staining (Fig. 1D).
Fig. 1.
Oil red o (ORO) compared with adipocyte differentiation-related protein (ADRP) underestimates hepatic stellate cell (HSC) lipid droplet (LD) number and size during in vitro HSC activation as well as in LX2 cells. A: panels on left show HSCs isolated from rat livers, grown in standard medium, fixed at the indicated days in culture, then stained with ORO (red) and imaged with light microscopy. Nuclei were counterstained with hematoxylin (blue). Panels on right show the same cell isolations labeled with anti-ADRP antibody followed by a fluorescein isothiocyanate-tagged secondary antibody (green) and nuclear labeled with 4',6-diamidino-2-phenylindole (blue). Images are representative of >10 others. B: LDs were labeled with ORO or ADRP as per A, and LDs per cell were counted manually using Image J software in a blinded manner. C: diameters of all LDs in each cell were measured using Image J software for each time point examined in a blinded manner. Error bars show the standard deviation for 3 independent rat cell isolations and quantitation of >10 cells per time point. Unpaired Student’s t-test was performed for comparisons between ORO and ADRP for each culture day; *P < 0.05. NS, not significant. D: human immortalized HSCs, LX2, were cultured in standard conditions, and LDs were labeled with ORO or ADRP as per A. Scale bars = 10 μm.
Fig. 2.
Oil red o (ORO) staining lacks sensitivity for and causes disruption of lipid droplets (LDs) in hepatic stellate cells (HSCs). An image of a fixed day 7 HSC (merge of 340 and 380 nm), demonstrating small retinoid-containing LDs (A, arrow), which are lost immediately after ORO application (B, arrow). Densely organized LDs (A, wedge) are disrupted and fuse upon application of ORO (B, wedge). Day 7 HSCs were fixed and co-labeled with ORO (red, C) and adipocyte differentiation-related protein (ADRP) primary antibody followed by fluorescein isothiocyanate-labeled secondary antibody (green, D). Nuclei were stained with 4′,6-diamidino-2-phenylindole (blue, C and D). Merged image of C and D is shown in E. Representative images (A and B, C–E, n > 10) are shown. Scale bar = 5 μm.
ADRP labeling of HSC LDs.
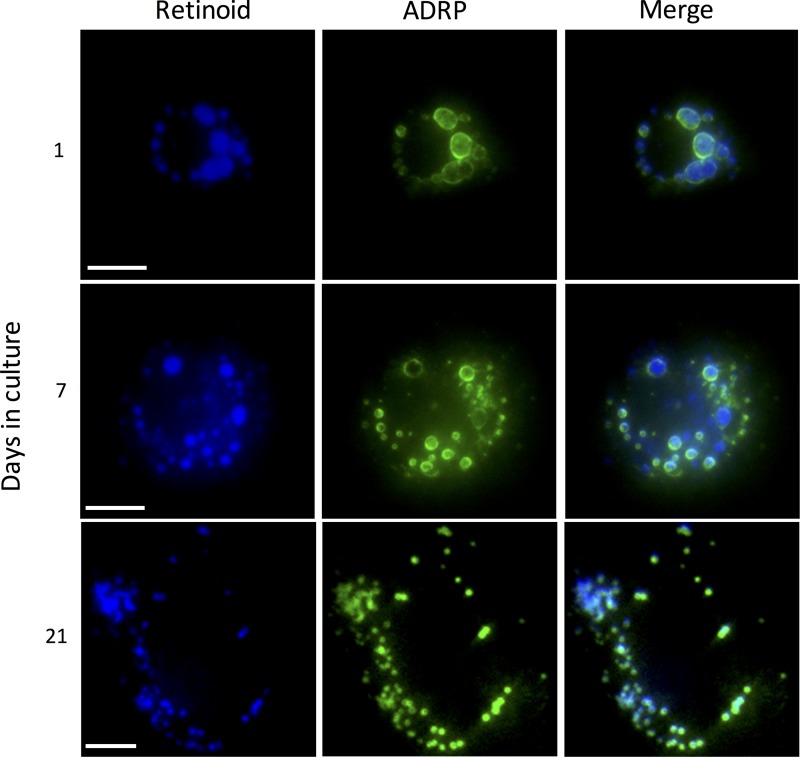
To assess the native morphology of HSC LDs more accurately, we labeled LDs with ADRP (also known as perilipin 2), a protein which associates with the HSC LD membrane (15). We first confirmed that ADRP-labeled LDs indeed contained RE within them by using fluorescence photomicroscopy (Fig. 3). RE was present in both quiescent and activated stellate cells and co-localized with ADRP (Fig. 3). Strikingly different from our parallel studies using the gold standard ORO labeling of LDs, ADRP labeling of LDs demonstrated that there is a time-dependent increase in the number of LDs within HSCs during spontaneous culture-induced activation through at least 21 days in culture (Fig. 1, A and B). At day 1 in culture, ADRP labeled more LDs (56 ± 35 per cell) with less intradroplet diameter variability (2.1 ± 0.3 μm) than with ORO (Fig. 1, B and C). By day 21 in culture, ADRP demarcated hundreds (549 ± 267) of diminutive (0.46 ± 0.07 μm) LDs (Fig. 1, B and C), dispersed widely throughout the cell (Fig. 1A). ADRP labeling of LDs revealed a gradual, time-dependent decrease in LD size during culture-induced activation, similar to that with ORO; however, ADRP labeling demonstrated that LDs were larger than appreciated with ORO labeling at all time points examined after day 1 in culture (Fig. 1C). Lastly, LX2 cells, when labeled with ADRP, demonstrate dozens of diminutive LDs (Fig. 1D).
Fig. 3.
Adipocyte differentiation-related protein (ADRP) localizes to the perimeter of retinoid-containing lipid droplets in hepatic stellate cells (HSCs). Rat HSCs were isolated, grown on glass coverslips, fixed at days 1, 7, and 21, and labeled with ADRP primary antibody followed by fluorescein isothiocyanate (FITC)-labeled secondary antibody. Cells were visualized at 360 nm, which detects retinoids (blue), followed by visualization in the FITC channel (green). In the right column, merge of both channels is shown. Scale bars = 10 μm. Images are representative of >10 others.
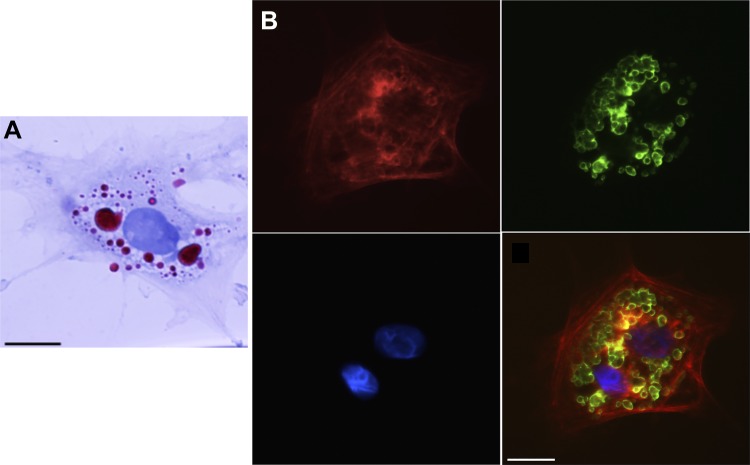
To examine LD biology in vivo and to determine whether LD dynamics are similar in in vitro and in vivo activated HSCs, we examined freshly isolated HSCs from rats after BDL-induced liver injury. HSCs isolated after BDL were fully activated within 12 h of plating as evidenced by their typical phenotypic appearance and expression of smooth muscle α-actin as described (6) (Fig. 4). These in vivo activated cells exhibited similar retention and size of LDs to those from uninjured, in vitro activated HSCs (cells from normal rat liver cultured for 4 days to induce activation). For in vivo versus in vitro activated HSCs, LD quantity (118 ± 34 LDs per cell vs. 101 ± 39 LDs per cell, P = 0.54) and size (1.65 ± 0.6 vs. 1.72 ± 0.4 μm, P = 0.85) showed no differences, respectively (Figs. 1A and 4).
Fig. 4.
Oil red o (ORO) underestimates lipid droplet (LD) number and size within in vivo activated hepatic stellate cells (HSCs). A: HSCs isolated from day 14 postoperative rats that had undergone bile duct ligation were cultured for 12 h, and LDs were stained with ORO. B: cells from the same isolation were labeled with adipocyte differentiation-related protein (ADRP) primary antibody followed by fluorescein isothiocyanate-labeled secondary antibody (green) with nuclear stain 4',6-diamidino-2-phenylindole shown in blue. Smooth muscle α-actin labeling (red) was performed to verify cellular activation. Single channels and a merge image are shown. Representative images from >10 cells and >3 different cell preparations are shown. Scale bar = 10 μm. A minimum of 10 cells per time point were analyzed.
Retinoid content of HSC LDs does not decrease until after HSCs have initiated transdifferentiation to a myofibroblast phenotype.
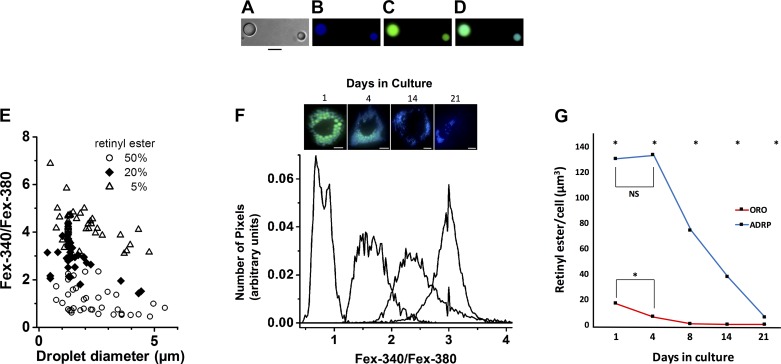
To precisely quantitate REs in HSCs during activation, we performed fluorescent imaging of live HSCs with excitation wavelengths of 340 and 380 nm, which correspond to the fluorescence of RE (32). To obtain an estimate of the concentration of RE found within HSC LDs, we generated triglyceride droplets containing varying concentrations (0–50%) of RE (Fig. 5A). Subsequently, droplets ranging from 0.2 to 5 μm (encompassing the size range of individual native HSC LDs detectable by the limits of optical microscopy) were excited with light at 340 and 380 nm (Fig. 5, B–D). We examined retinyl palmitate ester because it is the most abundant RE species within HSCs (21), whereas short-chain triglycerides are liquid at room temperature, allowing the formation of synthetic LDs. Fluorescence intensities for individual droplets created within a range of physiologically relevant RE concentrations (5, 20, and 50%) (21) at each wavelength were quantified, and ratios of intensities (340:380) were plotted versus droplet size (Fig. 5E). We next examined the fluorescent intensities of LDs within culture-activated HSCs throughout a time course, and using data generated from synthetic LDs, we estimated the RE concentration of native HSC LDs. RE fluorescence in day 1 HSCs had a 340:380 ratio <1 (Fig. 5F), consistent with an RE concentration of ~50% (Fig. 5E). By day 4 in culture, the 340:380 ratio shifted to ~1.5 (Fig. 5F), again corresponding to RE concentrations of ~50% (Fig. 5E). At day 14 in culture, the 340:380 ratio shifted to 2.5 (Fig. 5F), consistent with a decrease in RE concentration from 50 to ~20% (Fig. 5E). At day 21 in culture, the LD 340:380 ratio increased to ~3.0 (Fig. 5F), suggesting a further decrease in RE concentration to ~20% (Fig. 5E). Under the assumption that LDs are spherical, we determined the total cellular RE content for HSCs during the time course of spontaneous culture-induced activation using our aforementioned quantification of RE concentration (Fig. 5, E and F) and cellular LD volume using our determinations of LD number and size for ORO versus ADRP labeling (Fig. 1, B and C). With ORO labeling, extrapolated total cellular RE content (i.e., volume) declined ~70% between day 1 (17.6 μm3) and day 4 (6.1 μm3) in culture (Fig. 5G). However, using ADRP labeling, total cellular RE content remained stable between quiescent day 1 HSCs (130.3 μm3) and activated day 4 HSCs (133.1 μm3). Total cellular RE did not significantly decrease until day 8 of culture (71 μm3), when cells are fully activated, and showed a further decline to ~70% (37.4 μm3) of the quiescent level at day 14 in culture (Fig. 5G).
Fig. 5.
Hepatic stellate cell (HSC) lipid droplet (LD) retinyl ester (RE) concentration does not decrease until after cells have undergone culture-induced activation. A–D: synthetic LDs containing 50% triglyceride and 50% retinyl palmitate were created (A), and photomicrographs were taken with phase light at 340 nm (B) and light at 380 nm (C). A 340 and 380 nm merged image is also shown (D). Scale bars = 5 μm. E: ratios of excitation as measured at 340:380 nm vs. droplet size for synthetic droplets containing different RE concentrations were graphed. F: photomicrographs of in vitro HSC LDs were taken at days 1, 4, 14, and 21 in culture with light at 340 nm and 380 nm, and representative histograms were plotted showing peak 340:380 nm ratios for LDs at each time point. Panel at the top of the image depicts representative live HSCs at the designated days (merged 340 and 380 nm images are shown). Scale bars = 10 μm. G: total cellular RE content was determined by multiplying cellular LD volume [LD number per cell * (4/3 π r3)] where r = LD radius using oil red o (ORO) vs. adipocyte differentiation-related protein (ADRP) labeling (Fig. 1, B and C) by the RE percentage extrapolated from Fig. 5, E and F. A minimum of 10 cells per time point was analyzed. n = 3 independent rat HSC isolations. *P < 0.05. NS, not significant.
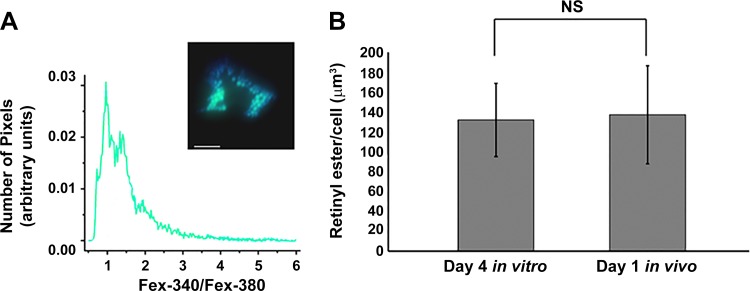
We further examined RE content within in vivo activated HSCs (Fig. 6). Based on their size (Fig. 5E) and 340:380 ratios (Fig. 6A), the LDs of freshly isolated in vivo activated HSCs contain an RE concentration of ~50% with total cellular RE content similar to that detected in day 4 in vitro activated HSCs (138.3 vs. 133.1 μm3, P = 0.8), respectively (Fig. 6B).
Fig. 6.
In vivo and in vitro activated hepatic stellate cells (HSCs) exhibit similar retinyl ester (RE) content. A: photomicrographs of in vivo activated HSC lipid droplets (LDs) were taken 12 h after HSC isolation with light at 340 nm and 380 nm, and the histogram shows peak 340:380 nm ratios for the LDs. Inset: a representative live HSC (merged 340 and 380 nm image). Scale bar = 10 μm. B: total cellular RE content for day 4 in vitro and day 1 in vivo activated HSC LDs was determined by multiplying cellular LD volume [LD number per cell * (4/3 π r3)] where r = LD radius using adipocyte differentiation-related protein labeling (as in Fig. 1, B and C and Fig. 4, respectively) by the RE percentage extrapolated from peak 340:380 ratios (histograms Figs. 5F and 6A, respectively) and data from synthetic LDs (Fig. 5E). A minimum of 10 cells per time point were analyzed. n = 3 independent rat HSC isolations. NS, not significant.
In vivo activated, in situ HSCs retain LDs.
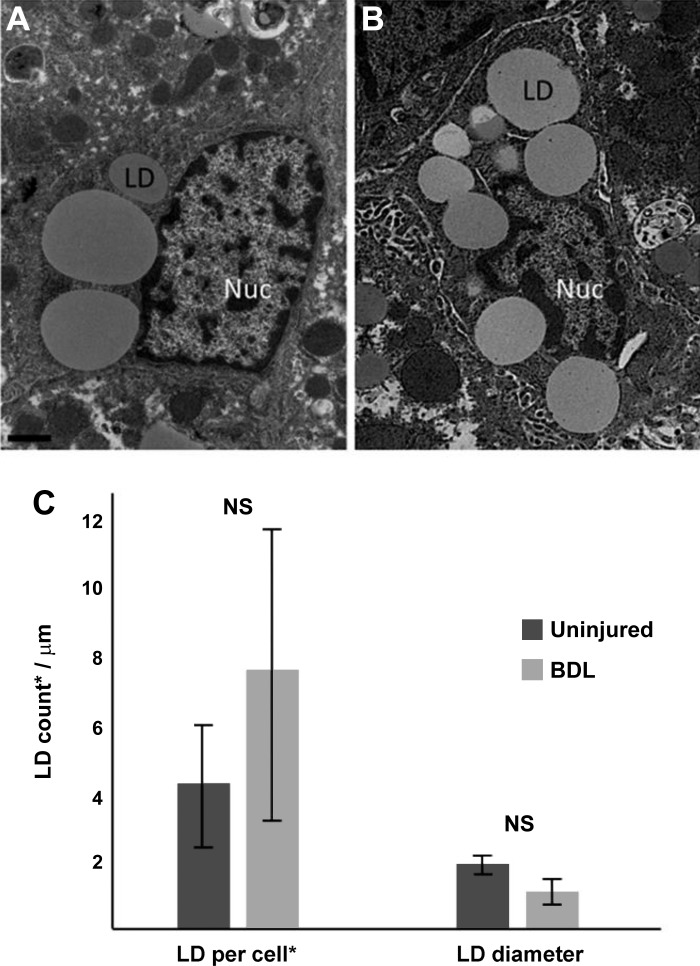
Lastly, we examined sham-operated and BDL-injured livers (verified by cirrhotic morphology and cholestasis of the animal) using electron microscopy. HSCs were identified (and differentiated from portal fibroblasts by their morphology) within the liver parenchyma (Fig. 7, A and B). We next quantitated the number and size of LDs in HSCs from sham-operated and BDL-injured livers (Fig. 7C). Although BDL-activated HSCs tended to have smaller-diameter individual LDs when compared with sham (1.1 μm vs. 1.9 μm, P = 0.07), the quantity of LDs per HSC did not differ significantly between injured and uninjured animals (4.1 vs. 7.8, P = 0.12) (Fig. 7C), demonstrating that in vivo activated HSCs retain LDs.
Fig. 7.
Hepatic stellate cells (HSCs) from bile duct ligation (BDL)-induced liver injury retain lipid droplets (LDs). BDL was performed as in materials and methods. After 10 days, livers were harvested and fixed as in materials and methods. Photomicrographs of HSC LDs from sham (A) and BDL-injured liver (B) were taken using standard transmission electron microscopy. Images shown are representative of >20 others. LDs from a single 100 nm plane (*) were counted, and diameters were measured using ImageJ software (C). A minimum of 10 cells per experimental condition were analyzed. n = 3 independent rats. Scale bar = 1 μm. NS, not significant.
DISCUSSION
Current dogma holds that HSC LD quantity is dramatically and rapidly reduced during the in vitro and in vivo activation process. Furthermore, LD loss has been suggested to lead to and/or propagate HSC activation (2, 6, 19, 23). These conclusions have been largely based on early studies of stellate cells using neutral lipid stains to detect LDs, such as ORO, or by electron microscopy studies which did not allow for rigorous time-course studies of LD dynamics. With the use of a combination of sensitive techniques, including electron microscopy, ADRP labeling, and live-cell fluorescence microscopy that together allow for more precise quantitation of LD number and size as well as the quantification of RE levels within LDs, our data challenge the accepted paradigm that LDs are lost from HSCs early during cellular activation in vivo and in vitro (2, 19, 22) and that a marked decrease in LD RE content occurs before cellular activation begins (28). On the contrary, we have demonstrated that LDs are retained by HSCs for prolonged periods of time after in vitro (Fig. 1, A and B) and after in vivo (Fig. 7) activation and that RE content in LDs does not decrease until after HSC activation has begun (Fig. 5G). Others have studied the shift in lipid species within HSC LDs during the activation process, suggesting that whereas RE levels decrease over time, triglyceride levels increase (28), representing a viable energy source for transdifferentiated, activated HSCs as described below.
Our work began by investigating a major pitfall associated with ORO labeling that has been previously poorly appreciated. Presently, ORO staining and autofluorescence of LD retinoids with optical microscopy are routinely used to detect LDs within HSCs and are used to estimate the purity of primary HSC preparations [since freshly isolated cells have abundant LDs (3)]. Although imaging of LDs with ORO is the gold standard for detecting the presence or absence of HSC LDs, the utility of this technique has been previously questioned (8), and now we definitively demonstrate the limitations of this technique by showing high intradroplet size variability in freshly isolated HSCs (day 1, Fig. 1, A and C) likely due to LD fusion artifact (Fig. 2, A and B) (9) and underestimation of LD number using ORO methodology when compared with using ADRP labeling (all time points, Fig. 1, A, B, D and Fig. 4). ORO is not sensitive for the detection of smaller LDs (those <0.5 μm in diameter) that are more often present in HSCs at later time points in culture (beyond day 4 within the in vitro model), likely accounting for the many previous reports of LD loss in activated HSCs in vitro (3, 5, 17, 22, 28, 31). We have clearly shown that by labeling LDs with ADRP, primary rat HSCs retain LDs until at least day 21 in culture (Fig. 1, A and B), nearly 3 times longer than previously reported (22). Most importantly, we show that in situ HSCs within in vivo BDL-injured livers retain their LDs similar to sham animals (Fig. 7).
Our work adds to the growing understanding of HSC LD retinoid biology. Retinoid cycling from hepatocytes to stellate cells (26, 29) and from stellate cells to plasma (1) has been shown to occur in a regulated manner and is dependent on the presence of retinol binding protein (29). A well-accepted previous investigation demonstrated that freshly isolated HSC LDs contain ~40% RE, 30% triglycerides, 20% cholesterol/cholesterol ester, and 10% phospholipids/free fatty acids (21). A more recent study using Raman imaging estimated that only 10% of the LD content in quiescent HSCs was RE and that RE decreased over the time course of culture-induced activation (28). This study, however, did not link LD size and number or RE content changes to the HSC activation process, which begins early in the culture-induced model of activation (11, 28) and after liver injury in vivo (13). Using more precise and novel methodology to assess RE content in LDs, we found that uninjured HSC LD RE content ranges from 50% at the time of isolation to 20% in fully activated, day 21 cultured HSCs, and the LDs of activated HSC examined ex vivo show RE concentrations of ~50% with no difference in total RE cellular content from cells activated in vitro (day 4) (Fig. 6). This discovery suggests that RE loss does not cause HSC activation but rather raises the possibility that RE loss is a result of activation. This finding is also consistent with data from lecithin retinol acyltransferase knockout mice, in which HSCs were reported to lack LDs altogether but undergo activation in vivo after liver injury as well as in culture-based models of activation (14).
Although our work demonstrates that LDs are not lost from activated HSCs as previously thought, it raises the question as to why LDs decrease in size over time during HSC activation. Others have proposed that lipids within HSC LDs are used as an energy source for sustained growth, migration, and extracellular matrix production via autophagy (10). It is possible that LDs (cargo) are not viable autophagocytic targets until they reach a critically small size, as it has been shown that size determines cargo susceptibility to autophagy (12). The mechanism by which LDs become smaller within HSCs is not fully understood; however, LDs in other cell types have been shown to decrease in size and increase in number via droplet fission (18). The regulation of autophagy of LDs and LD fission, if the latter does occur in HSCs, are active areas of research for our group and others (10, 30).
In summary, we have demonstrated that LDs are retained by HSCs indefinitely in culture-induced activation as well as in vivo during BDL liver injury. Moreover, our in vitro work shows that RE content in LDs does not change until after HSC activation has begun. These data lead us to conclude that LD and RE loss does not cause HSC activation and is unlikely to be critical for initiating the fibrogenic potential of HSCs.
GRANTS
This work was supported by National Institutes of Health Grants F32-DK-105842 (L. Jophlin), R01-DK-057830, R01-DK-098819 (D. Rockey), and R01-EY-014850 (Y. Koutalos).
DISCLOSURES
No conflicts of interest, financial or otherwise, are declared by the authors.
AUTHOR CONTRIBUTIONS
L.L.J. and Y.K. conceived and designed research; L.L.J., Y.K., and C.C. performed experiments; L.L.J., Y.K., C.C., and D.C.R. analyzed data; L.L.J., Y.K., V.S., and D.C.R. interpreted results of experiments; L.L.J. and Y.K. prepared figures; L.L.J. drafted manuscript; L.L.J., Y.K., V.S., and D.C.R. edited and revised manuscript; L.L.J., V.S., and D.C.R. approved final version of manuscript.
ACKNOWLEDGMENTS
This study used the services of the Morphology, Imaging and Instrumentation Core, supported by National Institute of General Medical Science Grant P30-GM-03342 to the South Carolina COBRE for Developmentally Based Cardiovascular Diseases, and the Microscopy and Cell Imaging Core at the Mayo Clinic. The authors thank Patrice Goletz for technical assistance with creation of synthetic lipid droplets, Yingyu Ren for rat stellate cell isolations, and Dr. Songling Liu for help with animal surgeries.
REFERENCES
- 1.Andersen KB, Nilsson A, Blomhoff HK, Oyen TB, Gabrielsen OS, Norum KR, Blomhoff R. Direct mobilization of retinol from hepatic perisinusoidal stellate cells to plasma. J Biol Chem 267: 1340–1344, 1992. [PubMed] [Google Scholar]
- 2.Blaner WS, O’Byrne SM, Wongsiriroj N, Kluwe J, D’Ambrosio DM, Jiang H, Schwabe RF, Hillman EM, Piantedosi R, Libien J. Hepatic stellate cell lipid droplets: a specialized lipid droplet for retinoid storage. Biochim Biophys Acta 1791: 467–473, 2009. doi: 10.1016/j.bbalip.2008.11.001. [DOI] [PMC free article] [PubMed] [Google Scholar]
- 3.Chang W, Yang M, Song L, Shen K, Wang H, Gao X, Li M, Niu W, Qin X. Isolation and culture of hepatic stellate cells from mouse liver. Acta Biochim Biophys Sin (Shanghai) 46: 291–298, 2014. doi: 10.1093/abbs/gmt143. [DOI] [PubMed] [Google Scholar]
- 4.D’Ambrosio DN, Walewski JL, Clugston RD, Berk PD, Rippe RA, Blaner WS. Distinct populations of hepatic stellate cells in the mouse liver have different capacities for retinoid and lipid storage. PLoS One 6: e24993, 2011. doi: 10.1371/journal.pone.0024993. [DOI] [PMC free article] [PubMed] [Google Scholar]
- 5.El Taghdouini A, Najimi M, Sancho-Bru P, Sokal E, van Grunsven LA. In vitro reversion of activated primary human hepatic stellate cells. Fibrogenesis Tissue Repair 8: 14, 2015. doi: 10.1186/s13069-015-0031-z. [DOI] [PMC free article] [PubMed] [Google Scholar]
- 6.Friedman SL, Rockey DC, McGuire RF, Maher JJ, Boyles JK, Yamasaki G. Isolated hepatic lipocytes and Kupffer cells from normal human liver: morphological and functional characteristics in primary culture. Hepatology 15: 234–243, 1992. doi: 10.1002/hep.1840150211. [DOI] [PubMed] [Google Scholar]
- 7.Friedman SL. Hepatic stellate cells: protean, multifunctional, and enigmatic cells of the liver. Physiol Rev 88: 125–172, 2008. doi: 10.1152/physrev.00013.2007. [DOI] [PMC free article] [PubMed] [Google Scholar]
- 8.Fukumoto S, Fujimoto T. Deformation of lipid droplets in fixed samples. Histochem Cell Biol 118: 423–428, 2002. doi: 10.1007/s00418-002-0462-7. [DOI] [PubMed] [Google Scholar]
- 9.Greenspan P, Mayer EP, Fowler SD. Nile red: a selective fluorescent stain for intracellular lipid droplets. J Cell Biol 100: 965–973, 1985. doi: 10.1083/jcb.100.3.965. [DOI] [PMC free article] [PubMed] [Google Scholar]
- 10.Hernández-Gea V, Ghiassi-Nejad Z, Rozenfeld R, Gordon R, Fiel MI, Yue Z, Czaja MJ, Friedman SL. Autophagy releases lipid that promotes fibrogenesis by activated hepatic stellate cells in mice and in human tissues. Gastroenterology 142: 938–946, 2012. doi: 10.1053/j.gastro.2011.12.044. [DOI] [PMC free article] [PubMed] [Google Scholar]
- 11.Ikeda H, Inao M, Fujiwara K. Inhibitory effect of tranilast on activation and transforming growth factor beta 1 expression in cultured rat stellate cells. Biochem Biophys Res Commun 227: 322–327, 1996. doi: 10.1006/bbrc.1996.1508. [DOI] [PubMed] [Google Scholar]
- 12.Jin M, Klionsky DJ. Regulation of autophagy: modulation of the size and number of autophagosomes. FEBS Lett 588: 2457–2463, 2014. doi: 10.1016/j.febslet.2014.06.015. [DOI] [PMC free article] [PubMed] [Google Scholar]
- 13.Khimji AK, Shao R, Rockey DC. Divergent transforming growth factor-beta signaling in hepatic stellate cells after liver injury: functional effects on ECE-1 regulation. Am J Pathol 173: 716–727, 2008. doi: 10.2353/ajpath.2008.071121. [DOI] [PMC free article] [PubMed] [Google Scholar]
- 14.Kluwe J, Wongsiriroj N, Troeger JS, Gwak GY, Dapito DH, Pradere JP, Jiang H, Siddiqi M, Piantedosi R, O’Byrne SM, Blaner WS, Schwabe RF. Absence of hepatic stellate cell retinoid lipid droplets does not enhance hepatic fibrosis but decreases hepatic carcinogenesis. Gut 60: 1260–1268, 2011. doi: 10.1136/gut.2010.209551. [DOI] [PubMed] [Google Scholar]
- 15.Lee TF, Mak KM, Rackovsky O, Lin YL, Kwong AJ, Loke JC, Friedman SL. Downregulation of hepatic stellate cell activation by retinol and palmitate mediated by adipose differentiation-related protein (ADRP). J Cell Physiol 223: 648–657, 2010. [DOI] [PMC free article] [PubMed] [Google Scholar]
- 16.Li JT, Liao ZX, Ping J, Xu D, Wang H. Molecular mechanism of hepatic stellate cell activation and antifibrotic therapeutic strategies. J Gastroenterol 43: 419–428, 2008. doi: 10.1007/s00535-008-2180-y. [DOI] [PubMed] [Google Scholar]
- 17.Lin J, Zheng S, Chen A. Curcumin attenuates the effects of insulin on stimulating hepatic stellate cell activation by interrupting insulin signaling and attenuating oxidative stress. Lab Invest 89: 1397–1409, 2009. doi: 10.1038/labinvest.2009.115. [DOI] [PMC free article] [PubMed] [Google Scholar]
- 18.Long AP, Manneschmidt AK, VerBrugge B, Dortch MR, Minkin SC, Prater KE, Biggerstaff JP, Dunlap JR, Dalhaimer P. Lipid droplet de novo formation and fission are linked to the cell cycle in fission yeast. Traffic 13: 705–714, 2012. doi: 10.1111/j.1600-0854.2012.01339.x. [DOI] [PubMed] [Google Scholar]
- 19.Mak KM, Leo MA, Lieber CS. Alcoholic liver injury in baboons: transformation of lipocytes to transitional cells. Gastroenterology 87: 188–200, 1984. [PubMed] [Google Scholar]
- 20.Mehlem A, Hagberg CE, Muhl L, Eriksson U, Falkevall A. Imaging of neutral lipids by oil red O for analyzing the metabolic status in health and disease. Nat Protoc 8: 1149–1154, 2013. doi: 10.1038/nprot.2013.055. [DOI] [PubMed] [Google Scholar]
- 21.Moriwaki H, Blaner WS, Piantedosi R, Goodman DS. Effects of dietary retinoid and triglyceride on the lipid composition of rat liver stellate cells and stellate cell lipid droplets. J Lipid Res 29: 1523–1534, 1988. [PubMed] [Google Scholar]
- 22.Radaeva S, Wang L, Radaev S, Jeong WI, Park O, Gao B. Retinoic acid signaling sensitizes hepatic stellate cells to NK cell killing via upregulation of NK cell activating ligand RAE1. Am J Physiol Gastrointest Liver Physiol 293: G809–G816, 2007. doi: 10.1152/ajpgi.00212.2007. [DOI] [PubMed] [Google Scholar]
- 23.Reeves HL, Friedman SL. Activation of hepatic stellate cells–a key issue in liver fibrosis. Front Biosci 7: d808–d826, 2002. doi: 10.2741/reeves. [DOI] [PubMed] [Google Scholar]
- 24.Rockey DC. Translating an understanding of the pathogenesis of hepatic fibrosis to novel therapies. Clin Gastroenterol Hepatol 11: 224–231.e1, 2013. doi: 10.1016/j.cgh.2013.01.005. [DOI] [PMC free article] [PubMed] [Google Scholar]
- 25.Rockey DC, Chung JJ. Interferon gamma inhibits lipocyte activation and extracellular matrix mRNA expression during experimental liver injury: implications for treatment of hepatic fibrosis. J Investig Med 42: 660–670, 1994. [PubMed] [Google Scholar]
- 26.Senoo H, Smeland S, Malaba L, Bjerknes T, Stang E, Roos N, Berg T, Norum KR, Blomhoff R. Transfer of retinol-binding protein from HepG2 human hepatoma cells to cocultured rat stellate cells. Proc Natl Acad Sci USA 90: 3616–3620, 1993. doi: 10.1073/pnas.90.8.3616. [DOI] [PMC free article] [PubMed] [Google Scholar]
- 27.Shirakami Y, Lee SA, Clugston RD, Blaner WS. Hepatic metabolism of retinoids and disease associations. Biochim Biophys Acta 1821: 124–136, 2012. doi: 10.1016/j.bbalip.2011.06.023. [DOI] [PMC free article] [PubMed] [Google Scholar]
- 28.Testerink N, Ajat M, Houweling M, Brouwers JF, Pully VV, van Manen HJ, Otto C, Helms JB, Vaandrager AB. Replacement of retinyl esters by polyunsaturated triacylglycerol species in lipid droplets of hepatic stellate cells during activation. PLoS One 7: e34945, 2012. doi: 10.1371/journal.pone.0034945. [DOI] [PMC free article] [PubMed] [Google Scholar]
- 29.Trøen G, Nilsson A, Norum KR, Blomhoff R. Characterization of liver stellate cell retinyl ester storage. Biochem J 300: 793–798, 1994. doi: 10.1042/bj3000793. [DOI] [PMC free article] [PubMed] [Google Scholar]
- 30.Tuohetahuntila M, Molenaar MR, Spee B, Brouwers JF, Wubbolts R, Houweling M, Yan C, Du H, VanderVen BC, Vaandrager AB, Helms JB. Lysosome-mediated degradation of a distinct pool of lipid droplets during hepatic stellate cell activation. J Biol Chem 292: 12436–12448, 2017. doi: 10.1074/jbc.M117.778472. [DOI] [PMC free article] [PubMed] [Google Scholar]
- 31.Wang S, Lee JS, Hyun J, Kim J, Kim SU, Cha HJ, Jung Y. Tumor necrosis factor-inducible gene 6 promotes liver regeneration in mice with acute liver injury. Stem Cell Res Ther 6: 20, 2015. doi: 10.1186/s13287-015-0019-z. [DOI] [PMC free article] [PubMed] [Google Scholar]
- 32.Xia Q, Yin JJ, Wamer WG, Cherng SH, Boudreau MD, Howard PC, Yu H, Fu PP. Photoirradiation of retinyl palmitate in ethanol with ultraviolet light–formation of photodecomposition products, reactive oxygen species, and lipid peroxides. Int J Environ Res Public Health 3: 185–190, 2006. doi: 10.3390/ijerph2006030021. [DOI] [PMC free article] [PubMed] [Google Scholar]


