Abstract
We tested a hypothesis that superoxide, by inducing Sp3, increases renal renin activity, renal angiotensin II type 1 receptor (AT1R) function, and blood pressure (BP) in rats. Group 1 rats were treated with vehicle, saline. Group 2 rats were treated with superoxide dismutase (SOD) inhibitor diethylthiocarbamate (DETC). Group 3 rats were treated with DETC and an SOD mimetic, tempol. Group 4 rats were treated with tempol only. All four groups of rats were treated for 2 wk then anesthetized, and BP was recorded. Thereafter, diuresis and natriuresis in response to AT1R blocker candesartan were determined. When compared with vehicle rats, BP increased in DETC rats. The increased BP in DETC rats decreased with tempol. Diuresis and natriuresis in response to candesartan increased in controls, and this further increased in DETC rats and decreased with tempol. A second set of four groups of rats underwent the same treatment as above and were anesthetized, and their kidneys were obtained for biochemical studies. The levels of superoxide but not hydrogen peroxide increased, whereas SOD activities decreased further in the renal cortical tissues of DETC rats than vehicle rats. These effects were attenuated with tempol in DETC rats. Moreover, tissue renin activity and abundance of membranous AT1R proteins increased more in DETC rats than vehicle rats, and decreased with tempol in DETC rats. Furthermore, the levels of lysine-acetylated, but not serine-phosphorylated, Sp3 increased more in the nuclei of DETC rats than vehicle rats. The increased levels of Sp3 lysine acetylation decreased in DETC rats with tempol. Taken together, our results suggest that superoxide activates renal Sp3 via lysine acetylation increasing renin activity, AT1R function, and BP in rats.
Keywords: hypertension, kidney, lysine acetylation, renal AT1 receptor, superoxide
INTRODUCTION
The kidney renin angiotensin system plays a pivotal role in the maintenance of sodium homeostasis and subsequently blood pressure (BP) (9). The evidence of kidney angiotensin II type 1 receptor (AT1R), one component of the renin angiotensin system, in BP regulation comes from many studies, especially from the kidney cross-transplantation studies (8, 22). Cross transplantation of the kidneys from AT1R knockouts to wild-type mice reduces BP in wild types (8, 22). In contrast, hyperactivation of renal AT1R function is linked to BP increase in animal models and hypertensive patients (9, 15).
Oxidative stress burden has been shown to increase AT1R function and BP (6, 7, 29). Oxidative stress burden is defined as the increase in cellular/organ levels of reactive oxygen species, such as superoxide and hydrogen peroxide (H2O2) (17, 25), contributing to hypertension (16, 30, 31). However, H2O2 is linked to vasodilatory response attenuating BP increase (5, 26). Recently, we reported that superoxide, but not H2O2, increases transcription and function of AT1R in renal cells (27).
Sp3 is a redox-sensitive transcription factor (TF) (18, 20, 27, 28) and binds to the promoter region of AT1R gene (33). The mechanism of superoxide-induced activation of Sp3 TF is not known. Both lysine acetylation and serine phosphorylation mechanisms have been linked to activation of Sp3 TF (1, 12, 23). Based on this information, we designed the present study for greater insight into the mechanism of superoxide-induced regulation of Sp3 TF, renal AT1R function, and BP in rats.
MATERIALS AND METHODS
Animal procurement.
Male Sprague-Dawley rats weighing 200–250 g were purchased from Harlan Laboratories (Indianapolis, IN) and acclimatized for a week before any treatment. Rats were housed in plastic cages in the University of Houston animal care and housing facility and used according to the National Institutes of Health guidelines and approved protocols by the Institutional Animal Care and Use Committee.
Animal treatments.
Rats were divided into four groups: 1) vehicle (control) rats, 2) diethylthiocarbamate (DETC) rats, 3) DETC + tempol rats, and 4) tempol-only rats. DETC rats were treated with sterilized DETC (10 mg/kg ip daily for 2 wk). DETC was freshly prepared in normal saline and sterilized by filtering through 0.2-µm filters. Control rats and tempol rats were treated with sterilized saline as above. DETC + tempol rats and tempol-only rats were given tempol in drinking water (2 mM, Santa Cruz Biotechnology, Dallas, TX). Tempol water was freshly prepared every day. Control rats and DETC rats were given drinking water without tempol. Standard rat chow was provided ad libitum.
Animal surgery.
Rats were anesthetized with Inactin (150 µg/kg ip, 200 µl in normal saline). With the rat under deep anesthesia, tracheotomy was performed to facilitate breathing. Right carotid artery was cannulated with pressure catheter transducer (Mikro Tip model PVR-1045, Millar, Houston, TX), and BP was recorded for 30 min using PowerLab software (ADI Instruments, Colorado Springs, CO) as reported by us (32). After the BP recording, the left jugular vein was catheterized with PE-50 tubing for normal saline and candesartan infusion. A midline abdominal incision was made, and the urinary bladder was catheterized with PE-10 tubing, and timed urine was collected. Rats were continuously infused with normal saline (1% body weight, ml/h) throughout the experimental period to prevent dehydration and maintain stable urine output (32).
Urine collection.
Two urine samples, each for 30 min, during normal saline infusion were collected and termed C1 and C2 urine. Candesartan in normal saline (10 µg/kg iv, 100-µl bolus dose) was infused, and 4 urine samples, each for 30 min, were collected as above and termed D1, D2, D3, and D4 urine. The volumes of urine (30-min urine) were recorded for urine output and sodium excretion as reported (32). The values for C1 and C2 and D1, D2, D3, and D4 were averaged and reported.
Measurement of sodium in urine samples.
Sodium concentration was measured in urine samples using atomic absorption spectrometer (AAnalyst 400, Perkin Elmer, Waltham, MA) as reported (32).
Biochemical studies.
For biochemical studies, another set of four groups of rats were treated and anesthetized with Inactin, as above. Midline abdominal incision was made, and kidneys were localized, harvested with sharp scissors, and kept in cold saline solution. Kidneys were washed three times with cold saline, and kidney capsule was removed. Kidneys were cut longitudinally with a sharp blade, and cortical tissues were removed and kept in cold saline.
Measurement of superoxide and H2O2.
Cortical tissues (100 mg) were homogenized in a buffer (20 mM Tris HCl; pH 8.00, 137 mM NaCl, 10% glycerol, 1% Triton X-100, 2 mM EDTA, and 1× protease inhibitor cocktail; Roche Applied Science, Indianapolis, IN) using a tissue shredder, SG3 (Pressure Biosciences, South Easton, MA). The homogenates were centrifuged at low speed (2,000 revolutions/min, 10 min) at 4°C, cell debris was removed, and supernatant was saved and analyzed as reported by us (27). Briefly, samples (50 µl) were loaded in triplicate in a 96-well plate. Superoxide probe dihydroethidium (DHE; 20 μM, Life Technologies, Eugene, OR) was mixed well with Krebs-Henseleit (pH 7.4) buffer, added in each well (final volume 200 μl), and incubated for 30 min at room temperature (RT) in the dark. DHE fluorescence signal was measured using excitation (490 nm) and emission (610 nm) wavelengths in a fluorimeter (Varioskan, Thermo Scientific, Rockford, IL).
For H2O2, samples (50 µl) were added in triplicate in a 96-well plate. Thereafter, H2O2 probe dichlorofluorescein diacetate (10 μM, Life Technologies) was mixed well in Krebs-Henseleit buffer and added to the wells (final volume 200 μl) and incubated for 30 min at RT in the dark. Thereafter, dichlorofluorescin (DCFH) fluorescence signal was measured using excitation (490 nm) and emission (520 nm) wavelengths in a fluorimeter (Varioskan).
Superoxide dismutase assay.
Equal amounts of tissue homogenates (10 µg proteins) were used to measure superoxide dismutase (SOD) activity using a kit-based assay (catalog no. 706002, Cayman Chemical, Ann Arbor, MI) following manufacturer’s instructions (32). The assay relies on the ability of SOD to lower the conversion of tetrazolium salt to formazan dye as it dismutates superoxide to H2O2 and molecular O2. One unit of SOD activity is defined as the amount of enzyme needed for 50% dismutation of superoxide. Conversion of tetrazolium salt is measured by absorbance at 460 nm.
Measurement of renin activity.
Equal amounts of tissue homogenates (10 µg proteins) were used to measure renin activity using a fluorescence assay kit (no. AS 721420, AnaSpec, Fremont, CA) as published by us (32). The kit contains 5-FAM/QXL520 fluorescence resonance energy transfer peptide in which the fluorescence of 5-FAM is quenched by QXL520. The assay relies on the ability of renin (in the sample) to cleave the fluorescence resonance energy transfer peptide into 2 separate fragments, releasing 5-FAM and producing fluorescence, which is measured using excitation/emission wavelengths 490 and 520 nm, respectively.
Membrane preparations.
Cortical tissues were homogenized with dounce homogenizer in ice-cold sucrose buffer (10 Tris base pH 7.4, 250 mM sucrose, 1 mM sodium orthovanadate, 2.5 mM sodium pyrophosphate, 1 mM β-glycerophosphate, 1 mM PMSF, 1× protease inhibitor cocktail; Roche Applied Science) and centrifuged at low speed (2,000 revolutions/min for 10 min at 4°C). The low-speed supernatants were centrifuged at high speed (18,000 revolutions/min for 30 min at 4°C). The pellets obtained were washed by centrifugation in the same buffer (18,000 revolutions/min for 10 min at 4°C) and resuspended in 50 µl of sucrose buffer and passed through a 23/27 gauge needle for a homogeneous suspension and considered membrane fraction (2, 13). An aliquot (5 µl) of the sample was used for protein measurement, and the rest utilized for Western blotting for AT1 receptor.
Isolation of nuclear proteins.
Cortical tissues (100 mg) were washed twice with cold PBS, and nuclear proteins were extracted using a kit following the manufacturer’s instructions (NE-PER kit, Thermo Fisher Scientific, Rockford, IL) as reported (27).
Immunoprecipitation of nuclear Sp3.
Immunoprecipitation (IP) was carried out as reported (3, 27). Briefly, nuclear samples (250 μg proteins) and Sp3 antibody (10 μg, Santa Cruz Biotechnology) were mixed in a total volume (500 µl) of IP buffer (50 mM Tris·HCl, pH 7.4, 150 mM NaCl, 1 mM EDTA, 1 mM EGTA, 1 mM DTT, 1 mM PMSF, 1% Triton X-100, 1× protease inhibitor cocktail). The samples were incubated overnight with end-over-end (360°) shaking at 4°C. Protein A/G agarose beads (100 µl, Santa Cruz Biotechnology) were washed with IP buffer by centrifugation (14,000 revolutions/min, 30 s) to remove impurity and acclimatize with IP buffer. Antigen-antibody (Sp3 protein-antibody) complex samples were mixed with agarose beads and incubated for 2 h with end-over-end shaking at 4°C. Protein A/G-antibody-antigen complex was washed 2 times with cold IP buffer by centrifugation (14,000 revolutions/min, 30 s). Finally, the complex was washed with cold buffer (50 mM Tris HCl pH 8.0) by centrifugation (14,000 revolutions/min, 30 s). The complex was dissociated with 50 µl Laemmeli buffer at 37°C for 30 min, vortexed, and centrifuged at RT. The supernatant was collected carefully and used for SDS/PAGE and Western blotting for Sp3.
Western blotting.
Western blotting for AT1 receptors in the membrane samples (10 µg proteins) were carried out by our methods (27). Briefly, proteins were resolved on 8%–16% Tris-glycine gels (Thermo Fisher Scientific) by SDS-PAGE, followed by electrophoretic transfer onto PVDF membranes for 2.5 h at 4°C. Thereafter, PVDF membranes were blocked with 5% BSA in Tris-buffered saline-Tween 20 (TBST; Sigma cat no. T-9039) for 1 h at RT. PVDF membranes were incubated with AT1 receptor antibody in TBST (1:500, Abcam, Cambridge, MA) overnight at 4°C. Thereafter, PVDF membranes were washed with TBST 3 times each for 10 min at RT and incubated with goat anti-rabbit-horseradish peroxidase (HRP) antibody (1:1,000, Santa Cruz Biotechnology) for 1 h at RT. The PVDF membranes were washed with TBST as above. Protein bands were visualized with chemiluminescent reagents (Thermo Fisher Scientific) using G:BOX image station (Syngene, Frederick, MD). The protein bands were quantified using a software integrated with the image station. The same blot was stripped off and probed for tubulin as loading control using tubulin antibody (1:1,000, Abcam) and goat anti-rabbit-HRP antibody (1:1,000, Santa Cruz Biotechnology). Protein bands were visualized and quantified as above.
Sp3 immunoprecipitates (5 µl) were resolved, transblotted, and immunoblotted as above. The blots were probed for acetyl-lysine using mouse monoclonal acetyl-lysine (1:500, Santa Cruz Biotechnology) and goat anti-mouse-HRP (1:1,000, Santa Cruz Biotechnology) antibodies. Acetyl-lysine protein bands were visualized and quantified as above.
The blots were stripped off and probed for phospho-serine using rabbit polyclonal phospho-serine (1:500, Abcam) and goat anti-rabbit-HRP (1:1,000, Santa Cruz Biotechnology) antibodies. Phopho-serine protein bands were visualized and quantified as above.
Finally, the blots were stripped off again and probed for Sp3 proteins using rabbit (1:500, Santa Cruz Biotechnology) and anti-rabbit-HRP (1:1,000, Santa Cruz Biotechnology) antibodies. Sp3 protein bands were visualized and quantified as above. Three isoforms of Sp3 proteins, 115 kDa, 100 kDa, and 78 kDa, were used to quantify protein bands (27).
Statistical analysis.
Results are presented as means ± SE. One-way ANOVA followed by Newman-Keul’s post hoc test was applied to compare the differences among the groups. Student’s t-test was used to compare between two groups. A value of P < 0.05 was considered statistically significant. The data were analyzed using GraphPad Prism software version 5 (GraphPad Software, La Jolla, CA).
RESULTS
Effects of SOD inhibitor DETC on BP.
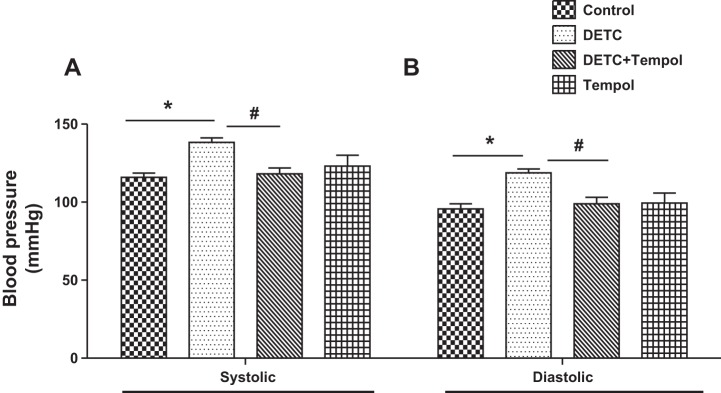
Systolic and diastolic BP increased in DETC rats, and they decreased with tempol in DETC rats to the levels of control rats and tempol rats (Fig. 1, A and B).
Fig. 1.
Diethylthiocarbamate (DETC) increases systolic (A) and diastolic (B) blood pressures in Sprague-Dawley (SD) rats. Blood pressure was measured in anesthetized rats treated with and without DETC and tempol, as described in materials and methods. Bar graphs represent results as means ± SE; n = 7–8 rats. *Different from control rats. #Different from DETC rats. P < 0.05.
Effects of SOD inhibitor DETC on AT1 receptor function.
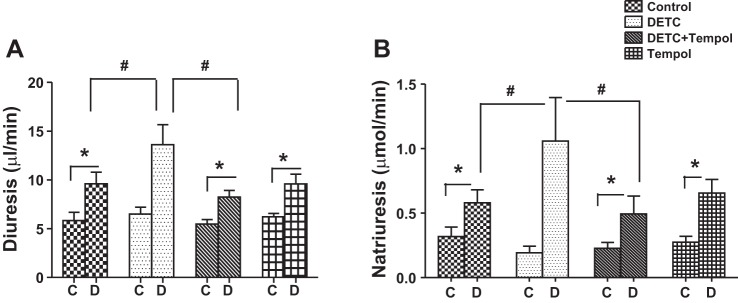
Diuretic response to AT1 receptor blocker candesartan increased in control rats, and it further increased in DETC rats. Diuretic response decreased with tempol in DETC rats to the level of tempol rats (Fig. 2A). The levels of urine flow were similar in response to saline infusion in control rats, DETC rats, DETC rats with tempol, and tempol rats (Fig. 2A).
Fig. 2.
Diethylthiocarbamate (DETC) increases diuretic and natriuretic response to candesartan in Sprague-Dawley (SD) rats. Diuresis (A) and natriuresis (B) in response to angiotensin II type 1 (AT1) receptor antagonist candesartan (details in materials and methods). C, saline infusion; D, candesartan infusion. Bar graphs represent results as means ± SE; n = 7–8 rats. *Different from control rats. #Different from DETC rats. P < 0.05.
Similarly, natriuretic response to AT1 receptor blocker candesartan increased in control rats, and it further increased in DETC rats. Natriuretic response decreased in DETC rats with tempol to the level of tempol rats (Fig. 2B). The levels of sodium excretion were similar in response to saline in control rats, DETC rats, DETC rats with tempol, and tempol rats (Fig. 2B).
Effects of SOD inhibitor DETC on DHE and DCFH fluorescence.
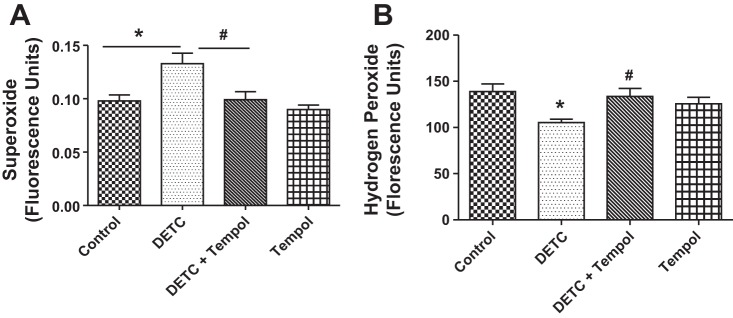
The levels of DHE fluorescence (superoxide) increased in DETC rats compared with control rats, and they decreased with tempol in DETC rats. DHE fluorescence levels in tempol rats were similar to the levels of control rats and DETC rats with tempol (Fig. 3A). The levels of DCFH fluorescence (H2O2) decreased in DETC rats compared with control rats and increased with tempol in DETC rats to the levels of control rats and tempol rats (Fig. 3B).
Fig. 3.
Diethylthiocarbamate (DETC) increases superoxide but not H2O2 in the renal tissues of Sprague-Dawley (SD) rats. Fluorescence levels of superoxide [dihydroethidium (DHE), A] and H2O2 (DCFHDA, B) were measured in the renal tissues of rats treated with and without DETC and tempol, as described in materials and methods. Bar graphs represent results as means ± SE; n = 7–8 rats. *Different from control rats. #Different from DETC rats. P < 0.05.
Effects of SOD inhibitor DETC on SOD activity and renin levels.
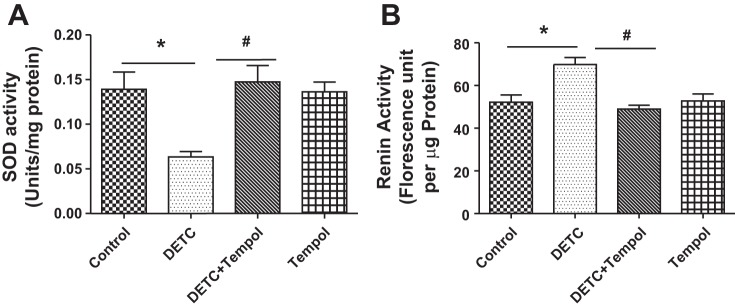
SOD activity decreased in the tissues of DETC rats compared with control rats, and it increased in DETC rats with tempol. The SOD activity in tempol rats was similar to control rats and DETC rats with tempol (Fig. 4A). Renin activity increased in the tissues of DETC rats, and it decreased in DETC rats with tempol to the levels of control rats and tempol rats (Fig. 4B).
Fig. 4.
Diethylthiocarbamate (DETC) decreases superoxide dismutase (SOD) and increases renin activity in Sprague-Dawley (SD) rats. SOD (A) and renin (B) activities in the renal tissues of rats treated with and without DETC and tempol were measured by commercially available kits as described in materials and methods. Bar graphs represent results as mean ± SE; n = 7–8 rats. *Different from control rats. #Different from DETC rats. P < 0.05, n = 7–8 rats.
Effects of SOD inhibitor DETC on membranous AT1 receptor protein.
The abundance of membranous AT1 receptor proteins increased in DETC rats, and it decreased in DETC rats with tempol to the levels of control rats and tempol rats (Fig. 5).
Fig. 5.
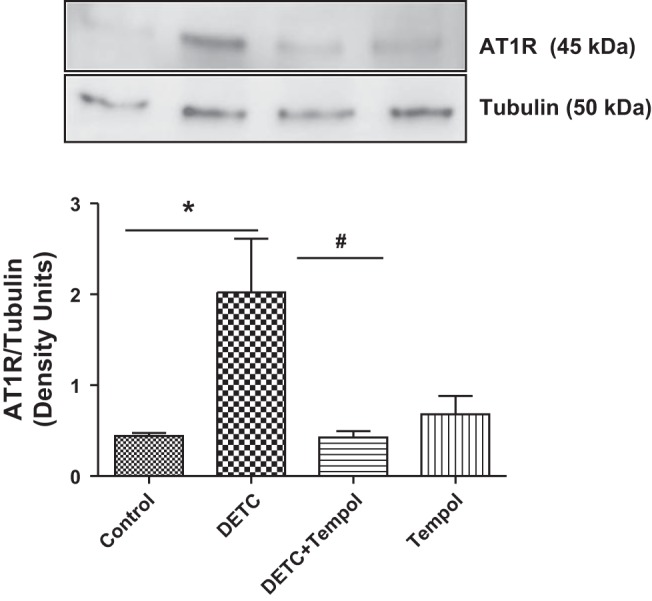
Diethylthiocarbamate (DETC) increases the abundance of membranous angiotensin II type 1 (AT1) receptor (AT1R) in Sprague-Dawley (SD) rats. AT1 receptors were measured by Western blotting in the renal tissues of rats treated with and without DETC and tempol (details in materials and methods). Top: representative blots for AT1 receptor and tubulin (loading control). Bottom: bar graphs represent ratios of the densities between AT1R and tubulin. Results are means ± SE; n = 7–8 rats. *Different from control rats. #Different from DETC rats. P < 0.05, n = 7–8 rats.
Effects of SOD inhibitor DETC on lysine acetylation and serine phosphorylation of nuclear Sp3 proteins.
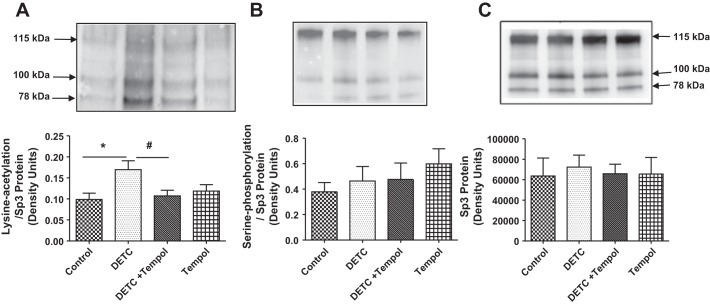
The levels of lysine-acetylated Sp3 increased in DETC rats, and they decreased in DETC rats with tempol to the levels of control rats and tempol rats (Fig. 6A). The levels of serine-phosphorylated Sp3 (Fig. 6B) and Sp3 proteins (Fig. 6C) were similar in all four groups of rats.
Fig. 6.
Diethylthiocarbamate (DETC) increases lysine acetylation but not serine phosphorylation of Sp3. Nuclear extracts from the renal cortical tissues of rats treated with and without DETC and tempol were used to determine Sp3 lysine acetylation (A), Sp3 serine phosphorylation (B), and Sp3 proteins (C) (details in materials and methods). Top: representative blots for Sp3 lysine acetylation (A), Sp3 serine phosphorylation (B), and Sp3 proteins (C). Bottom: bar graphs represent ratios of the densities of Sp3 lysine acetylation/Sp3 protein (A) and Sp3 serine phosphorylation/Sp3 protein (B). Sp3 protein loading controls (C). Results are means ± SE; n = 7–8 rats. *Different from control rats. #Different from DETC rats. P < 0.05.
DISCUSSION
It is well known that superoxide contributes to the development of hypertension (10, 11, 19, 21). However, the mechanism is still not clear and is being investigated currently. Studies have linked reduction of bioavailability of nitric oxide (NO; a vascular relaxing factor) by superoxide as a mechanism in the pathogenesis of hypertension (10, 11, 19, 21).
Superoxide, by interacting with NO, forms peroxynitrite, causing endothelial cell dysfunction in hypertension (10). Mito-TEMPO, an antioxidant, by reducing vascular superoxide, improves vascular NO levels and endothelial-dependent relaxation attenuating angiotensin II (ANG II)-induced hypertension (11). ANG II-induced production of superoxide via the NAD(P)H-oxidase pathway has also been shown to interact with NO (19), suggesting the role of superoxide in hypertension. Furthermore, superoxide, by reducing endothelium-derived relaxing factor, has been linked in the pathogenesis of hypertension (21).
Our recent report demonstrates that superoxide, by inducing Sp3, increases AT1 receptor function in renal cells (27). Since renal AT1 receptor regulates BP (8, 9, 15, 22), it is likely that superoxide via Sp3 mechanism regulates AT1 receptor function and BP. In the present study, we examined this aspect of Sp3 in a rat model.
DETC induces superoxide generation by inhibiting SOD in mice (14). DETC-treated rats showed higher superoxide levels in renal tissues and higher BP in these rats. SOD mimetic tempol attenuated these effects, suggesting a role of superoxide in this phenomenon. Diuretic and natriuretic responses of AT1 receptor blocker candesartan were several magnitudes higher in DETC-treated rats and were attenuated with tempol to the levels of control rats. These results suggest that superoxide causes hyperactivation of AT1 receptor, contributing to increase in BP in these rats. This is not surprising as AT1 receptor is known to regulate BP (8, 9, 15, 22).
Furthermore, higher levels of superoxide (Fig. 3A) in the renal tissues had a reciprocal relationship with SOD activities (Fig. 4A) in DETC-treated rats. These were corroborated with high superoxide and low H2O2 levels in these rats. DETC-inhibited SOD is unable to convert superoxide to H2O2, suggesting SOD is the source of superoxide (11), supporting our previous findings (27). As such, there are controversies over H2O2 regulating BP (5, 31).
Finally, superoxide induces Sp3, causing its nuclear translocation for transcriptional activity (27). Two mechanisms are reported for Sp3 activation: lysine acetylation (1, 12) and serine phosphorylation (23). Erk-induced serine phosphorylation on Sp3 increases VGEF production, contributing to tumor angiogenesis (23), whereas our data showed that DETC-induced superoxide leaves Sp3 in lysine-acetylated and not serine-phosphorylated state. Interestingly, Sp3 regulates renin gene enhancer (24) and binds to AT1 receptor gene promoter (33), causing increase in renin activity (Fig. 4B) and AT1R expression (27). Renin converts angiotensinogen to angiotensin I, which is converted to ANG II by angiotensin converting enzyme. ANG II is a ligand for AT1R, likely recruiting the receptor (Fig. 5) to the membrane, increasing its activity. Ligand-induced recruitment of receptors on the membrane is reported to increase receptor activity (4). Ligand-bound receptors on the membrane are functionally active.
Perspective.
Our findings suggest that superoxide causes Sp3 activation, resulting in increase in renin activity and AT1 receptor function, contributing to a rise in BP. To our knowledge, this is the first report demonstrating the role of renal Sp3 in BP regulation, and this can be a target for future therapeutics to manage BP.
GRANTS
Financial assistance from National Institute on Aging (AG-039836) to M. Asghar was helpful to carry out this study.
DISCLOSURES
No conflicts of interest, financial or otherwise, are declared by the authors.
AUTHOR CONTRIBUTIONS
M.S., X.W., and I.P. performed experiments; M.S. and M.A. analyzed data; M.S., X.W., I.P., and M.A. interpreted results of experiments; M.S. and I.P. prepared figures; M.S., I.P., and M.A. drafted manuscript; I.P. and M.A. edited and revised manuscript; M.A. approved final version of manuscript.
REFERENCES
- 1.Ammanamanchi S, Freeman JW, Brattain MG. Acetylated sp3 is a transcriptional activator. J Biol Chem 278: 35775–35780, 2003. doi: 10.1074/jbc.M305961200. [DOI] [PubMed] [Google Scholar]
- 2.Asghar M, Chillar A, Lokhandwala MF. Renal proximal tubules from old Fischer 344 rats grow into epithelial cells in cultures and exhibit increased oxidative stress and reduced D1 receptor function. Am J Physiol Cell Physiol 295: C1326–C1331, 2008. doi: 10.1152/ajpcell.00367.2008. [DOI] [PMC free article] [PubMed] [Google Scholar]
- 3.Asghar M, Hussain T, Lokhandwala MF. Higher basal serine phosphorylation of D1A receptors in proximal tubules of old Fischer 344 rats. Am J Physiol Renal Physiol 283: F350–F355, 2002. doi: 10.1152/ajprenal.00361.2001. [DOI] [PubMed] [Google Scholar]
- 4.Brismar H, Asghar M, Carey RM, Greengard P, Aperia A. Dopamine-induced recruitment of dopamine D1 receptors to the plasma membrane. Proc Natl Acad Sci USA 95: 5573–5578, 1998. doi: 10.1073/pnas.95.10.5573. [DOI] [PMC free article] [PubMed] [Google Scholar]
- 5.Chen Y, Pearlman A, Luo Z, Wilcox CS. Hydrogen peroxide mediates a transient vasorelaxation with tempol during oxidative stress. Am J Physiol Heart Circ Physiol 293: H2085–H2092, 2007. doi: 10.1152/ajpheart.00968.2006. [DOI] [PubMed] [Google Scholar]
- 6.Chugh G, Lokhandwala MF, Asghar M. Altered functioning of both renal dopamine D1 and angiotensin II type 1 receptors causes hypertension in old rats. Hypertension 59: 1029–1036, 2012. doi: 10.1161/HYPERTENSIONAHA.112.192302. [DOI] [PMC free article] [PubMed] [Google Scholar]
- 7.Chugh G, Lokhandwala MF, Asghar M. Oxidative stress alters renal D1 and AT1 receptor functions and increases blood pressure in old rats. Am J Physiol Renal Physiol 300: F133–F138, 2011. doi: 10.1152/ajprenal.00465.2010. [DOI] [PMC free article] [PubMed] [Google Scholar]
- 8.Coffman TM, Crowley SD. Kidney in hypertension: guyton redux. Hypertension 51: 811–816, 2008. doi: 10.1161/HYPERTENSIONAHA.105.063636. [DOI] [PubMed] [Google Scholar]
- 9.Crowley SD, Gurley SB, Herrera MJ, Ruiz P, Griffiths R, Kumar AP, Kim HS, Smithies O, Le TH, Coffman TM. Angiotensin II causes hypertension and cardiac hypertrophy through its receptors in the kidney. Proc Natl Acad Sci USA 103: 17985–17990, 2006. doi: 10.1073/pnas.0605545103. [DOI] [PMC free article] [PubMed] [Google Scholar]
- 10.Cuzzocrea S, Mazzon E, Dugo L, Di Paola R, Caputi AP, Salvemini D. Superoxide: a key player in hypertension. FASEB J 18: 94–101, 2004. doi: 10.1096/fj.03-0428com. [DOI] [PubMed] [Google Scholar]
- 11.Dikalova AE, Bikineyeva AT, Budzyn K, Nazarewicz RR, McCann L, Lewis W, Harrison DG, Dikalov SI. Therapeutic targeting of mitochondrial superoxide in hypertension. Circ Res 107: 106–116, 2010. doi: 10.1161/CIRCRESAHA.109.214601. [DOI] [PMC free article] [PubMed] [Google Scholar]
- 12.Ehlting C, Häussinger D, Bode JG. Sp3 is involved in the regulation of SOCS3 gene expression. Biochem J 387: 737–745, 2005. doi: 10.1042/BJ20041101. [DOI] [PMC free article] [PubMed] [Google Scholar]
- 13.Fardoun RZ, Asghar M, Lokhandwala M. Role of oxidative stress in defective renal dopamine D1 receptor-G protein coupling and function in old Fischer 344 rats. Am J Physiol Renal Physiol 291: F945–F951, 2006. doi: 10.1152/ajprenal.00111.2006. [DOI] [PubMed] [Google Scholar]
- 14.Heikkila RE, Cabbat FS, Cohen G. In vivo inhibition of superoxide dismutase in mice by diethyldithiocarbamate. J Biol Chem 251: 2182–2185, 1976. [PubMed] [Google Scholar]
- 15.Kobori H, Nangaku M, Navar LG, Nishiyama A. The intrarenal renin-angiotensin system: from physiology to the pathobiology of hypertension and kidney disease. Pharmacol Rev 59: 251–287, 2007. doi: 10.1124/pr.59.3.3. [DOI] [PubMed] [Google Scholar]
- 16.Landmesser U, Cai H, Dikalov S, McCann L, Hwang J, Jo H, Holland SM, Harrison DG. Role of p47(phox) in vascular oxidative stress and hypertension caused by angiotensin II. Hypertension 40: 511–515, 2002. doi: 10.1161/01.HYP.0000032100.23772.98. [DOI] [PMC free article] [PubMed] [Google Scholar]
- 17.Lassègue B, Griendling KK. Reactive oxygen species in hypertension; An update. Am J Hypertens 17: 852–860, 2004. doi: 10.1016/j.amjhyper.2004.02.004. [DOI] [PubMed] [Google Scholar]
- 18.Lee J, Kosaras B, Aleyasin H, Han JA, Park DS, Ratan RR, Kowall NW, Ferrante RJ, Lee SW, Ryu H. Role of cyclooxygenase-2 induction by transcription factor Sp1 and Sp3 in neuronal oxidative and DNA damage response. FASEB J 20: 2375–2377, 2006. doi: 10.1096/fj.06-5957fje. [DOI] [PubMed] [Google Scholar]
- 19.Mori T, Cowley AW Jr. Angiotensin II-NAD(P)H oxidase-stimulated superoxide modifies tubulovascular nitric oxide cross-talk in renal outer medulla. Hypertension 42: 588–593, 2003. doi: 10.1161/01.HYP.0000091821.39824.09. [DOI] [PubMed] [Google Scholar]
- 20.Nair V, Sreevalsan S, Basha R, Abdelrahim M, Abudayyeh A, Rodrigues Hoffman A, Safe S. Mechanism of metformin-dependent inhibition of mammalian target of rapamycin (mTOR) and Ras activity in pancreatic cancer: role of specificity protein (Sp) transcription factors. J Biol Chem 289: 27692–27701, 2014. doi: 10.1074/jbc.M114.592576. [DOI] [PMC free article] [PubMed] [Google Scholar]
- 21.Nakazono K, Watanabe N, Matsuno K, Sasaki J, Sato T, Inoue M. Does superoxide underlie the pathogenesis of hypertension? Proc Natl Acad Sci USA 88: 10045–10048, 1991. doi: 10.1073/pnas.88.22.10045. [DOI] [PMC free article] [PubMed] [Google Scholar]
- 22.Navar LG. The role of the kidneys in hypertension. J Clin Hypertens (Greenwich) 7: 542–549, 2005. doi: 10.1111/j.1524-6175.2005.04130.x. [DOI] [PMC free article] [PubMed] [Google Scholar]
- 23.Pagès G. Sp3-mediated VEGF regulation is dependent on phosphorylation by extra-cellular signals regulated kinases (Erk). J Cell Physiol 213: 454–463, 2007. doi: 10.1002/jcp.21104. [DOI] [PubMed] [Google Scholar]
- 24.Pan L, Glenn ST, Jones CA, Gronostajski RM, Gross KW. Regulation of renin enhancer activity by nuclear factor I and Sp1/Sp3. Biochim Biophys Acta 1625: 280–290, 2003. doi: 10.1016/S0167-4781(03)00016-2. [DOI] [PubMed] [Google Scholar]
- 25.Paravicini TM, Touyz RM. Redox signaling in hypertension. Cardiovasc Res 71: 247–258, 2006. doi: 10.1016/j.cardiores.2006.05.001. [DOI] [PubMed] [Google Scholar]
- 26.Park SW, Noh HJ, Sung DJ, Kim JG, Kim JM, Ryu SY, Kang K, Kim B, Bae YM, Cho H. Hydrogen peroxide induces vasorelaxation by enhancing 4-aminopyridine-sensitive Kv currents through S-glutathionylation. Pflugers Arch 467: 285–297, 2015. doi: 10.1007/s00424-014-1513-3. [DOI] [PMC free article] [PubMed] [Google Scholar]
- 27.Saleem M, Pokkunuri I, Asghar M. Superoxide increases angiotensin II AT1 receptor function in human kidney-2 cells. FEBS Open Bio 6: 1273–1284, 2016. doi: 10.1002/2211-5463.12148. [DOI] [PMC free article] [PubMed] [Google Scholar]
- 28.Schäfer G, Cramer T, Suske G, Kemmner W, Wiedenmann B, Höcker M. Oxidative stress regulates vascular endothelial growth factor-A gene transcription through Sp1- and Sp3-dependent activation of two proximal GC-rich promoter elements. J Biol Chem 278: 8190–8198, 2003. doi: 10.1074/jbc.M211999200. [DOI] [PubMed] [Google Scholar]
- 29.Su Q, Liu JJ, Cui W, Shi XL, Guo J, Li HB, Huo CJ, Miao YW, Zhang M, Yang Q, Kang YM. Alpha lipoic acid supplementation attenuates reactive oxygen species in hypothalamic paraventricular nucleus and sympathoexcitation in high salt-induced hypertension. Toxicol Lett 241: 152–158, 2016. doi: 10.1016/j.toxlet.2015.10.019. [DOI] [PubMed] [Google Scholar]
- 30.Vaziri ND, Dicus M, Ho ND, Boroujerdi-Rad L, Sindhu RK. Oxidative stress and dysregulation of superoxide dismutase and NADPH oxidase in renal insufficiency. Kidney Int 63: 179–185, 2003. doi: 10.1046/j.1523-1755.2003.00702.x. [DOI] [PubMed] [Google Scholar]
- 31.Vaziri ND, Lin CY, Farmand F, Sindhu RK. Superoxide dismutase, catalase, glutathione peroxidase and NADPH oxidase in lead-induced hypertension. Kidney Int 63: 186–194, 2003. doi: 10.1046/j.1523-1755.2003.00711.x. [DOI] [PubMed] [Google Scholar]
- 32.Wang X, Asghar M. Protein disulfide isomerase regulates renal AT1 receptor function and blood pressure in rats. Am J Physiol Renal Physiol 313: F461–F466, 2017. doi: 10.1152/ajprenal.00580.2016. [DOI] [PMC free article] [PubMed] [Google Scholar]
- 33.Zhao X, Martin MM, Elton TS. The transcription factors Sp1 and Sp3 are required for human angiotensin II type 1 receptor gene expression in H295-R cells. Biochim Biophys Acta 1522: 195–206, 2001. doi: 10.1016/S0167-4781(01)00341-4. [DOI] [PubMed] [Google Scholar]


