

Abstract
Anorexia nervosa (AN) is a severe psychiatric disorder with high mortality. The underlying neurobiological mechanisms are not well understood, and high-resolution structural magnetic resonance brain imaging studies have given inconsistent results. Here we aimed to psychoradiologically define the most prominent and replicable abnormalities of gray matter volume (GMV) in AN patients, and to examine their relationship to demographics and clinical characteristics, by means of a new coordinate-based meta-analytic technique called seed-based d mapping (SDM). In a pooled analysis of all AN patients we identified decreased GMV in the bilateral median cingulate cortices and posterior cingulate cortices extending to the bilateral precuneus, and the supplementary motor area. In subgroup analysis we found an additional decreased GMV in the right fusiform in adult AN, and a decreased GMV in the left amygdala and left anterior cingulate cortex in AN patients without comorbidity (pure AN). Thus, the most consistent GMV alterations in AN patients are in the default mode network and the sensorimotor network. These psychoradiological findings of the brain abnormalities might underpin the neuropathophysiology in AN.
Introduction
Anorexia nervosa (AN) is a serious and distinctive psychiatric disorder, particularly affecting adolescent girls and young adult women1. Although relatively rare (prevalence ~0.3%), AN has serious medical consequences (mortality ~10%) and thus poses a major clinical, psychological, and societal burden2. As defined in the fifth revision of the Diagnostic and Statistical Manual of Mental Disorders (DSM-5; American Psychiatric Association, 2013), AN is characterized by an intense fear of weight gain and a distorted view of body shape, which motivates severe dietary restriction or other weight loss behaviors, such as purging or excessive physical activity3. Cognitive and emotional functioning are markedly disturbed, and serious medical morbidity and psychiatric comorbidity are common4. AN has a complex etiology, involving genetic/neurobiological, social–environmental and psychological factors5.
Radiological techniques such as magnetic resonance imaging (MRI) is an important psychoradiologic technique (https://radiopaedia.org/articles/psychoradiology)64–67. In AN, a number of MRI studies have employed the analytical technique of voxel-based morphometry (VBM); this avoids some limitations of region-of-interest (ROI) approaches, which focus on selected regions and preclude the exploration of other brain regions that may be involved.
A significant global loss of brain volume in AN, regarding both gray matter (GM) and white matter (WM), has been identified in several studies6–9. However, studies investigating regional changes in AN have yielded less consistent results, reporting reduced volumes in a wide variety of areas including cingulate cortex (anterior cingulate cortices (ACC), median cingulate cortices (MCC), posterior cingulate cortices (PCC)), frontal lobe (supplementary motor area (SMA), inferior frontal gyrus (IFG), and frontal operculum), temporal lobe (the superior/middle temporal gyrus (STG/MTG), fusiform, and temporoparietal junction), parietal lobe (precuneus and inferior parietal cortex), occipital cortex, cerebellum, and striatum6,7,10–23. While one recent study found increased gray matter volume (GMV) in the left orbitofrontal gyrus rectus, bilateral fusiform gyrus, bilateral hippocampus, right insula, and bilateral parahippocampal gyrus24, another found no significantly reduced GMV in the hypothalamus25. Taken together, these studies have not identified any common theme with respect to functionally important regions that throw light on the neurobiological factors underlying AN.
Meta-analysis is a powerful tool which integrates multiple studies of a particular problem to derive insights often unavailable from the studies individually. To our knowledge only one meta-analysis has compared GMV differences between AN patients and healthy control (HC) subjects using the method of activation likelihood estimation (ALE)8. This implicated reward and somatosensory abnormalities in AN, reporting decreased GMV in hypothalamus, striatum (caudate nucleus, lentiform nucleus) and the inferior parietal lobe, with no significant GMV increases. However, the number of published primary VBM studies in AN at that time was small, only seven being included; furthermore, the meta-analysis did not consider confounding factors, such as differences in age, psychiatric, and medical comorbidity, and duration of illness8. Now a further 14 primary AN VBM studies have been published, it is timely to conduct an updated meta-analysis to help define GMV alterations in AN.
The aims of this paper were threefold. First, we performed pooled meta-analyses of all included studies to identify consistent GMV changes in AN. Second, we conducted subgroup meta-analyses to assess the robustness and heterogeneity of the main findings. Finally, we used meta-regression methods to examine the effects of demographics and clinical characteristics. We hypothesized that AN patients would show reduced GMV in some functionally important regions, such as cingulate cortex and striatum which may help to account for the symptomatology. We also hypothesized that the two subgroups of adult AN and AN without comorbidity would show distinctive GMV abnormalities.
Methods
Study selection
A systematic strategy was used to search for relevant studies published in PubMed, Embase, Web of Science, and Google Scholar up to May 2018 using combinations of the terms “anorexia nervosa” or “AN” or “eating disorder” plus “VBM” or “voxel-based morphometry” or “whole brain” or “morphometric”. The reference lists of these studies were manually checked to identify additional studies.
The following were criteria for inclusion: (i) an original article in a peer-reviewed journal; (ii) including patients with a primary diagnosis of AN based on DSM criteria; (iii) reporting a VBM case-control study on AN patients and HC subjects; (iv) reporting whole-brain GMV alterations in a stereotactic space in three-dimensional standard coordinates; (v) using significance thresholds for data that were either corrected for multiple comparisons or uncorrected with spatial extent thresholds. If necessary, corresponding authors were contacted by e-mail to provide details not in the original manuscripts. Studies were excluded if: (i) it was impossible to obtain the three-dimensional coordinates in stereotactic space; (ii) the data overlapped with those of other publications (if so, the study with the larger sample size was selected); (iii) there was no HC group; (iv) only region of interest (ROI) findings were reported; (v) the findings were based on small-volume correction; (iv) studies reported recovered AN patients. We followed the preferred reporting items for systematic reviews and meta-analysis (PRISMA) guidelines26.
Three authors (Z.S.M., W.W.N., and S.X.R.) independently searched the literature, examined the retrieved articles, extracted and cross-checked data. The results were compared, and any inconsistencies were resolved by consensus. The coordinates in each study were extracted for meta-analysis according to the SDM method.
Voxel-wise meta-analysis by SDM
The analytical processes are described in the SDM tutorial (http://sdmproject.com/sofware/Tutorial.pdf) and related publications. SDM has been widely applied to e.g. childhood maltreatment27, obsessive-compulsive disorder (OCD)28, and major depressive disorder (MDD)29. The approach creates effect size and variance maps based on reported peak coordinates, which are then analyzed with traditional random-effects meta-analytic methods. In addition, this technique allows heterogeneity maps to be generated and meta-regressions to be conducted across the whole brain. Importantly, SDM also allows meta-analytic group comparisons, which provide an indication of whether computed effect sizes differ significantly between groups30,31. In the current version of SDM31, a standard Montreal Neurological Institute (MNI) map of the differences in GMV was separately recreated for each included study using an anisotropic Gaussian kernel, which assigns higher effect sizes to the voxels that are more correlated with peaks. These anisotropic kernels optimize the recreation of the effect size maps and provide greater robustness, because they do not depend on a full width at half maximum (FWHM).
We planned to conduct pooled meta-analysis of all the included studies, and then four subgroup analyses: adult AN patients; adolescent AN patients; AN patients with comorbidity; and AN patients without comorbidity (‘pure AN’). However, there were too few studies to allow subgroup analyses of adolescents and AN with comorbidity (a minimum of 10 studies is recommended for SDM meta-analyses32). To ensure that only the most replicable and robust of the results were retained, a jackknife sensitivity analysis was conducted. The meta-regression analyses were conducted with relevant clinical variables, including BMI, age, illness duration, percentage of females, and percentage of medicated patients as regressors.
A threshold of p < 0.005 with peak Z > 1 and a cluster extent of >10 voxels was used for the meta-analyses and heterogeneity analyses30.
Results
Included studies and sample characteristics
The search strategy initially identified 145 studies, of which 21 studies met the inclusion criteria (summarized in Fig. 1). Our final sample comprised 389 AN patients and 410 HC. Table 1 summarizes clinical and demographic data from all included studies. Table 2 summarizes technique details from all included studies. In no study was there any significant difference in age and sex between AN and HC groups.
Fig. 1. Search strategy used for the inclusion of the studies considered in the current meta-analysis.
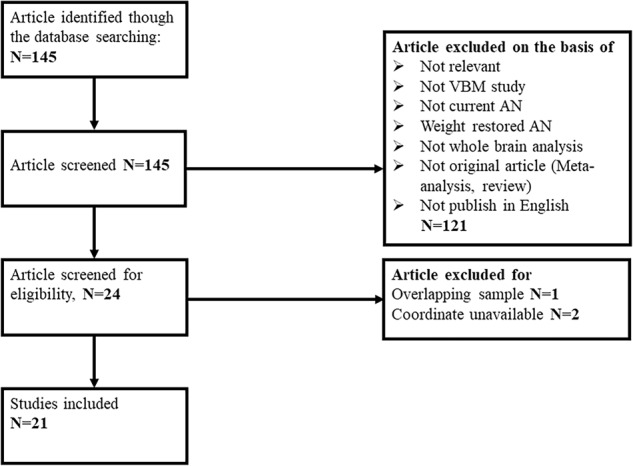
AN anorexia nervosa, VBM voxel-based morphometry
Table 1.
Demographic and clinical characteristics of subjects in the 21 voxel-based morphometry data sets included in the meta-analysis
| Study | Number (female) | Age (years) | Duration (years) | BMI | BDI score | Onset age (years) | Medication (%) | Comorbidity | |||
|---|---|---|---|---|---|---|---|---|---|---|---|
| AN | HC | AN | HC | AN | HC | ||||||
| Samples from adults | |||||||||||
| Amianto et al. (2013) | 17(17) | 14(14) | 20 | 24 | 1.08 | 16.0 | 21.0 | 13 | NA | Drug naive | No |
| Bar et al. (2015) | 26(23) | 26(23) | 22.9 | 24 | 1.86 | 16.9 | 21.7 | 20 | NA | Drug naive | No |
| Bjornsdotter et al. (2018) | 25(25) | 25(25) | 20.3 | 21.2 | 4.14 | 16.2 | 21.1 | 26.88 | NA | 52 | Yes |
| Boghi et al. (2010) | 21(21) | 27(27) | 29 | 30.8 | 11.3 | 15.5 | 21.9 | NA | NA | 100 (SSRI) | NA |
| Brooks et al. (2011) | 14(14) | 21(21) | 26 | 26 | 9.2 | 15.6 | 21.4 | NA | NA | NA | Yes |
| Cicerale et al. (2013) | 10(10) | 8(8) | 22 | 24 | 1.33 | 15.9 | 21.1 | NA | 20 | Drug naive | No |
| D’Agata et al. (2015) | 21(21) | 17(17) | 21 | 23 | <2 | 16.1 | 21.5 | NA | NA | Drug naive | No |
| Fonville et al. (2014) | 31(NA) | 31(NA) | 23 | 25 | 7 | 15.8 | 21.8 | NA | 16 | 39 | Yes |
| Friederich et al. (2011) | 12(12) | 14(14) | 24.3 | 25.6 | 6.3 | 15.9 | 21.1 | NA | NA | Drug naive | No |
| Joos et al. (2010) | 12(12) | 18(18) | 25 | 26.9 | 4.7 | 16.0 | 21.2 | 26.5 | NA | 8.3 | Yes |
| Kohmura et al. (2017) | 23(23) | 29(29) | 28.5 | 28.2 | 10.5 | 13.2 | 21.5 | 25.3 | 18 | NA | No |
| Phillipou et al. (2018) | 26(26) | 27(27) | 22.8 | 22.5 | 6.42 | 16.6 | 22.6 | NA | 16.04 | 100 | Yes |
| Suchan et al. (2010) | 15(15) | 15(15) | 26.8 | 29.5 | 5.5 | 16.0 | 22.0 | NA | NA | NA | NA |
| Van Opstal et al. (2015) | 10(10) | 11(11) | 22.1 | 20.8 | 3.54 | 15.6 | 20.3 | NA | NA | 25 | No |
| Samples from adolescents | |||||||||||
| Bomba et al. (2015) | 11(11) | 8(8) | 13.6 | 13.2 | 1.20 | 12.7 | 19.8 | NA | NA | Drug naive | No |
| Castro Fornieles et al. (2009) | 12(11) | 9(8) | 14.5 | 14.6 | 0.69 | 14.8 | NA | NA | NA | 25 | Yes |
| Frank et al. (2013) | 19(19) | 22(22) | 15.4 | 14.8 | NA | 16.2 | 21.3 | NA | NA | 58 | Yes |
| Fujisawa et al. (2015) | 20(20) | 14(14) | 14.1 | 14.9 | 1.96 | 14.3 | NA | NA | NA | Drug naive | No |
| Gaudio et al. (2011) | 16(16) | 16(16) | 15.2 | 15.1 | 0.44 | 14.2 | 20.2 | NA | 14.7 | 100 | No |
| Martin Monzon et al. (2017) | 26(26) | 20(20) | 16.5 | 17.2 | <3 | 16.6 | 22.6 | NA | NA | NA | No |
| Olivo et al. (2018) | 22(22) | 38(38) | 14.7 | 14.8 | 0.66 | 19.3 | 20.7 | NA | NA | Drug naive | No |
BMI body mass index, AN anorexia nervosa, HC health control, BDI Beck Depression Inventory, R restrictive subtype of anorexia nervosa, NA not available
Table 2.
Technique details of the VBM studies on AN included in the meta-analysis
| Study | MRI scanner (T) | Software | Smoothing (FWHM) (mm) | p-Value | Voxels | Coordinates |
|---|---|---|---|---|---|---|
| Amianto et al. (2013) | 1.5 | FSLVBM | 7 | <0.005 (uncorrected) | 60 | 10 |
| Bar et al. (2015) | 1.5 | SPM8 | 8 | <0.05 (FWE) | NA | 5 |
| Boghi et al. (2010) | 1.0 | SPM2 | 12 | <0.05 (FDR) | NA | 19 |
| Bomba et al. (2015) | 1.5 | SPM5 | 8 | <0.05 (FWE) | NA | 5 |
| Brooks et al. (2011) | 1.5 | SPM5 | 12 | <0.05 (FDR) | NA | 6 |
| Bjornsdotter et al. (2018) | 3.0 | SPM8 | 8 | <0.05 (FWE) | NA | 0 |
| Cicerale et al. (2013) | 1.5 | FSLVBM | 7 | <0.005 (uncorrected) | 60 | 0 |
| D’Agata et al. (2015) | 1.5 | FSLVBM | NA | <0.05 (NA) | 50 | 3 |
| Fonville, et al. (2014) | 1.5 | FSLVBM | 7 | <0.05 (FWE) | NA | 10 |
| Friederich et al. (2011) | 3.0 | SPM5 | 8 | <0.05 (corrected) | NA | 8 |
| Joos et al. (2010) | 3.0 | SPM8 | 12 | <0.05 (corrected) | NA | 7 |
| Kohmura et al. (2017) | 3.0 | SPM8 | 8 | <0.05 (FWE) | NA | 9 |
| Phillipou et al. (2018) | 3.0 | SPM12 | 8 | <0.05 (FWE) | NA | 10 |
| Suchan et al. (2010) | 1.5 | SPM5 | 12 | < 0.05 (FDR) | NA | 2 |
| Van-opstal et al. (2015) | 3.0 | FSLVBM | NA | <0.05 (NA) | NA | 2 |
| CastroFornieles et al. (2009) | 1.5 | SPM5 | 12 | <0.05 (FWE) | NA | 6 |
| Fujisawa et al. (2015) | 3.0 | SPM8 | 12 | <0.05 (FWE) | NA | 2 |
| Gaudio et al. (2011) | 1.5 | SPM2 | 8 | <0.05 (FWE) | NA | 3 |
| MartinMonzon al. (2017) | 3.0 | SPM12 | 6 | <0.05 (FDR) | NA | 25 |
| Frank et al. (2013) | 3.0 | SPM8 | 8 | <0.05 (FWE) | NA | 12 |
| Olivo et al. (2018) | 3.0 | SPM 12 | 8 | <0.05 (FWE) | NA | 0 |
FDR false discovery rate, FWE family-wise error correction, NA not available, VBM voxel-based morphometry
Voxel-wise meta-analysis
Pooled meta-analyses of all included studies (21 studies)
AN patients showed decreased GMV in the bilateral MCC and PCC, extending to bilateral SMA and precuneus. GMV was also decreased in bilateral cerebellum. No regions were identified with increased GMV in AN (Table 3 and Fig. 2).
Table 3.
The regions of decreased gray matter volume in AN patients compared with HC identified by the main meta-analyses
| Region | Maximum | Cluster | Jackknife sensitivity analysis | |||
|---|---|---|---|---|---|---|
| MNI coordinates x, y, z | SDM z-score | p-Value uncorrected | Number of voxels | Breakdown (no. of voxels) | ||
| L median cingulate | −4, −30, 44 | −3.223 | ~0 | 2348 | L median cingulate (849) R median cingulate (363) L precuneus (347) R precuneus (269) L supplementary motor area (250) L posterior cingulate gyrus (138) R supplementary motor area (82) R posterior cingulate gyrus (50) |
21 of 21 |
| L cerebellum | −28, −54, −32 | −2.137 | 0.001114726 | 181 | L cerebellum, hemispheric lobule VI, BA 37 (96) L cerebellum, hemispheric lobule VI (59) L cerebellum, hemispheric lobule VI, BA 19 (18) L cerebellum, crus I (8) |
18 of 21 (Amianto et al.; D’Agata et al.; Fonville et al.) |
| R cerebellum, crus I | 30, −50, −22 | −2.011 | 0.001207650 | 85 | R cerebellum, crus I (42) R cerebellum, hemispheric lobule VI (43) |
19 of 21 (Fonville et al.; Phillipou et al.) |
The jackknife sensitivity analysis column gives the number of studies whose omission does not affect the finding, and abbreviated reference citations for the remainder which do
BA Brodmann area, GM gray matter, MNI Montreal Neurological Institute Space, L left, R right, SDM seed-based d mapping
Fig. 2. Regions showing reduced gray matter volume in AN patients compared with healthy controls.

L left, R right, B bilateral, Pre precuneus, PCC posterior cingulate cortex, SMA supplementary motor area, MCC median cingulate cortex
Subgroup meta-analyses of adult AN studies (14 studies)
The adult AN subgroup showed decreased GMV in bilateral MCC and left PCC, extending to bilateral SMA and precuneus. GMV was also decreased in right fusiform gyrus and bilateral cerebellum. No regions were identified with increased GMV in AN (Table 4 and Fig. 3).
Table 4.
Regional differences in gray matter volume in AN patients compare with HC subjects identified in the two subgroup meta-analyses
| Region | Maximum | Cluster breakdowns | Jackknife sensitivity analysis | |||
|---|---|---|---|---|---|---|
| MNI coordinates x, y, z | SDM z-score | p-Value uncorrected | Number of voxels | |||
| Samples from AN adults (14 datasets) | ||||||
| Decreased GMV (AN < HC) | ||||||
| R fusiform gyrus | 32, −56, −18 | −2.113 | 0.001207650 | 137 | R fusiform (137) | 12 of 14 (D’Agata et al.; Fonville et al.) |
| R cerebellum | 30, −52, −22 | −2.045 | 0.001744330 | 433 | R cerebellum (433) | 14 of 14 |
| L cerebellum, | −24, −54, −28 | −2.432 | 0.000108361 | 898 | L cerebellum (733) | 14 of 14 |
| L median cingulate | −4, −30, 46 | −2.455 | 0.000098050 | 839 | L median cingulate (415) R median cingulate (84) L supplementary motor area (155) R supplementary motor area (60) R precuneus (36) L precuneus (82) L posterior cingulate gyrus (7) |
14 of 14 |
| Samples from pure AN patients (12 datasets) | ||||||
| Decreased GMV (AN < HC) | ||||||
| L supplementary motor area | −4, −18, 52 | −2.784 | ~0 | 1841 | L median cingulate (660) R median cingulate (422) L supplementary motor area (335) R supplementary motor area (189) L posterior cingulate gyrus (94) R posterior cingulate gyrus (41) R precuneus (82) L precuneus (18) |
12 of 12 |
| L amygdala | −30, −4, −20 | −1.773 | 0.002250135 | 130 | L amygdala (130) | 9 of 12 (Amianto et al., Friederich et al, MartinMonzon et al.) |
| L anterior cingulate | 2, 38, 24 | −1.746 | 0.002699077 | 43 | L anterior cingulate (43) | 9 of 12 (Kohmura et al., MartinMonzon et al., Van-opstal et al.) |
The jackknife sensitivity analysis column gives the number of studies whose omission does not affect the finding, and abbreviated reference citations for the remainder which do
BA Brodmann area, GM gray matter, MNI Montreal Neurological Institute Space, L left, R right, SDM seed-based d mapping
Fig. 3. Regions showing reduced gray matter volume in AN-adult patients compared with healthy controls.

L left, R right, B bilateral, Pre precuneus, SMA supplementary motor area, MCC median cingulate cortex
Subgroup meta-analyses of pure AN studies (12 studies)
The pure AN patient subgroup showed decreased GMV in bilateral MCC and PCC extending to bilateral SMA and precuneus. GMV was also decreased in the left amygdala and left ACC (Table 4 and Fig. 4).
Fig. 4. Regions showing reduced gray matter volume in pure (non-comorbid) AN patients compared with healthy controls.

L left, R right, B bilateral, Pre precuneus, PCC posterior cingulate cortex, SMA supplementary motor area, MCC median cingulate cortex, ACC anterior cingulate cortex
Jackknife sensitivity analysis
The main findings remained largely unchanged in jackknife sensitivity analysis: the detailed results are provided in Tables 3 and 4.
Meta-regression analysis
We examined the potential effect of relevant clinical variables by means of simple linear regression using SDM. The mean age, percentage of female patients, BMI, illness duration, and percentage of medicated patients were not linearly associated with GMV changes. Limited data precluded meta-regression analysis of structural change for the Beck Depression Inventory (BDI) score. We were unable to assess the relationship to AN symptom severity, because this was reported using a variety of incompatible measures.
Discussion
The present study is an up-to-date meta-analysis using the powerful technique of SDM to define the differences of GMV between AN patients and HCs, based on 21 VBM studies of 389 AN and 410 HC. There are three robust findings. First, the whole group of AN patients showed decreased GMV in bilateral MCC, PCC extending to the bilateral SMA, precuneus, and cerebellum. Second, GMV was decreased in the right fusiform gyrus only in adult AN. Third, GMV was decreased in the left amygdala and left ACC only in pure AN. Overall, the cingulate cortex, the frontal, and parietal lobes seem to be especially involved in AN.
Implications of findings in AN patients as a whole
As hypothesized, the results robustly demonstrated significantly decreased GMV in the cingulate cortex. We did not find differences in areas primarily underlying reward processing, such as the striatum, often reported as most susceptible to decreased GMV10,33,34, this difference may be due to our larger number of studies and more accurate methodology. The key regions showing decreased GMV were the bilateral MCC, PCC extending to the bilateral precuneus, and SMA. These results accord with previous structural neuroimaging findings6,35. What might they mean?
The MCC is involved in identifying the emotional significance of a stimulus to produce an appropriate affective state and behavioral response; the anterior sub-region of MCC seems to be particularly involved in fear and avoidance behavior, and it has greater amygdala input than other cingulate regions36. AN features disturbance in both emotional and cognitive function, and the involvement of MCC could explain much of the specific symptomatology, such as inhibition, anxiety, depression, and alexithymia.
The precuneus and the PCC are key components of the default mode network (DMN), which is mainly involved in self-reflection37. Studies using task-based fMRI have shown reduced DMN activity in women with AN38,39. Thus, the alteration in DMN may point to an abnormality of the regulation of subjectivity and conscious self-monitoring40,41, perhaps underlying these patients’ rigid cognitive strategies to control food intake, and lack of recognition of starvation.
SMA volumetric decrease has previously been reported in AN18,19. The SMA is related to the planning and control of motor actions, and plays a pivotal role in task switching, particularly in proactive behavioral switching42,43. An impairment in this region may contribute to the patients’ cognitive-behavioral inflexibility44, which may underlie their self-induced starvation. Furthermore, a task-related fMRI study of female AN patients also identified reduced sensorimotor network (SMN) activity in the SMA39; this may imply that SMN impairments in AN reflect dysfunctional processing of somatosensory information regarding body size. A decrease of activation in this area may therefore facilitate the body dissatisfaction which is a core symptom of AN.
Our finding of decreased cerebellum GMV is consistent with previous studies18,21,22,45, and a recent resting state fMRI study demonstrated altered intrinsic connectivity of the cerebellar vermis in AN patients46. There is accumulating evidence that the cerebellum is involved in the regulation of various visceral functions including feeding control47,48. Patients with AN present both misperception of visceral feedback, such as feeling of fullness, and an inflexible cognitive pattern that prevents them from modifying their behavior. We hypothesize that GMV changes and dysfunctional neural patterns in the cerebellum might contribute to core symptoms of AN, such as self-induced starvation and food aversion.
Implications of findings in the adult AN subgroup
A noteworthy finding is decreased GMV in the right fusiform gyrus in adult AN. The fusiform gyrus is involved in body size perception and food processing49, and abnormalities in it could underlie AN patients’ impaired perception of their own body, as well as their cognitive bias in food imaging and processing21,50. There is also evidence of reduced effective connectivity between the left fusiform body area and the extrastriate body area in AN51,52. However, because it was impossible to perform meta-analysis of the adolescent AN group, it remains unclear whether the fusiform area is more vulnerable in adult AN than in adolescent AN.
Implications of findings in the pure AN subgroup
Nearly three-quarters of AN patients report a lifetime mood disorder, such as MDD, anxiety disorder or OCD1. Investigating the pure AN patient subgroup therefore offers the best opportunity to gain evidence for neural pathology directly associated with the disease. Interestingly, the pure AN subgroup demonstrated decreased GMV in the left amygdala and the left ACC, confirming previous studies53,54. The amygdala is involved in the expression of fear and anxiety, and also influences emotional processes, such as emotional learning and emotional regulation55,56. Furthermore, previous fMRI research has revealed hyperactivation of the amygdala in AN patients in response to looking at their own body image57. Thus, our findings suggest that morphometric alterations in amygdala may underlie an intense fear of weight gain in AN.
The ACC is involved in reward networks58 and affective processing59. It could also be related to the deficit in set-shifting which is a neuropsychological trait in AN58. In a functional MRI study of this, AN patients showed less activity in the ACC60.
However, we did not observe any GMV alteration in amygdala and ACC in the pooled whole-group results. The reason for this discrepancy is unclear, although it could be that changes associated with comorbidity, such as MDD, anxiety disorder, and OCD may normalize, or at least obscure, the intrinsic changes in these sensitive regions.
Implications of non-significant findings in meta-regression analysis
Although no significant correlations were found between clinical variables and GM changes, some potential factors may impact on GMV, among which illness duration and BMI were of particular interest to us.
Three studies demonstrated that illness duration was related to GM volume changes16,17,21, however, this was not confirmed in other studies10,12,18,20,22,61. These inconsistent results can be read in two ways: (1) because of heterogeneous patient groups with respect to AN subtype ratio, presence of medication, and comorbidity in the included studies, it may be that our meta-regression lacked sufficient power to detect any such effect; (2) GM changes in AN patients might emerge before the onset and continue in the same way, regardless of the duration12.
Previous VBM studies reported either significant correlations10,18,21,22,11 or no correlations6,16,17,20,62 between BMI and GMV in different brain regions. It is possible that these divergent findings may simply have canceled out in our meta-analysis. Alternatively, morphological impairments might best be considered not as a direct consequence of malnutrition, but rather as a premorbid symptom of AN that accompanies neuropsychological impairments16. However, these preliminary results need confirmation in more longitudinal studies.
Limitations
Our study has several limitations. First, like most voxel-wise meta-analyses, it was based on the published coordinates rather than raw statistical brain maps, which may result in less accurate results30. Second, we could not take AN-subtypes into account. The restricting subtype and the binge-purging subtype may have different etiologies, but this was impossible to investigate because the information was not available in the included studies. Third, some of patients in the meta-analysis were taking antidepressant medication, which may itself affect brain structure63. Finally, although we found gray matter changes which were different from the pooled results in adult AN and pure AN, it cannot be concluded that these changes are characteristic of these subgroups, because the changes in their comparative groups (adolescent AN and AN with comorbidity) are still unknown. More studies on these subgroups are needed to reach the minimum requirement for reliable meta-analysis.
Conclusion
The present results robustly suggest that patients with AN have significantly decreased GMV in brain regions which are involved in DMN and SMN. These structural abnormalities are consistent with previously reported functional changes, and may therefore underpin the pathophysiological alternations and thus offer some explanation of the core symptomology of AN. Future longitudinal studies in at-risk populations are needed to validate these findings and to clarify whether the observed changes are the cause or the consequence of this illness. This may help development of strategies that strengthen resilience, as well as treatments to normalize these alterations.
Acknowledgements
This work was supported by the National Natural Science Foundation (Grant nos. 81371528,81820108018, 81621003, 81761128023, 81220108013, 81227002 and 81030027), Sichuan Provincial Foundation of Science and Technology of China (Grant no. 2013SZ0047) and the Functional and Molecular Imaging Key Laboratory of Sichuan Province (FMIKLSP, Grant No.2012JO0011).
Conflict of interest
The authors declare that they have no conflict of interest.
Footnotes
Publisher’s note: Springer Nature remains neutral with regard to jurisdictional claims in published maps and institutional affiliations.
These authors contributed equally: Simin Zhang, Weina Wang
Contributor Information
Qiang Yue, Phone: +86(0)2885421065, Email: scu_yq@163.com.
Qiyong Gong, Email: qiyonggong@hmrrc.org.cn.
References
- 1.Zipfel S, Giel KE, Bulik CM, Hay P, Schmidt U. Anorexia nervosa: aetiology, assessment, and treatment. Lancet Psychiatry. 2015;2:1099–1111. doi: 10.1016/S2215-0366(15)00356-9. [DOI] [PubMed] [Google Scholar]
- 2.Nielsen S. Epidemiology and mortality of eating disorders. Psychiatr. Clin. North Am. 2001;24:201. doi: 10.1016/S0193-953X(05)70217-3. [DOI] [PubMed] [Google Scholar]
- 3.Zipfel S, et al. Impact of exercise on energy metabolism in anorexia nervosa. J. Eat. Disord. 2013;1:37. doi: 10.1186/2050-2974-1-37. [DOI] [PMC free article] [PubMed] [Google Scholar]
- 4.Treasure J, Claudino AM, Zucker N. Eating disorders. Lancet. 2008;32:583–593. doi: 10.1016/S0140-6736(09)61748-7. [DOI] [PubMed] [Google Scholar]
- 5.Bakalar JL, Shank LM, Vannucci A, Radin RM, Tanofsky-Kraff M. Recent advances in developmental and risk factor research on eating disorders. Curr. Psychiatry Rep. 2015;17:42. doi: 10.1007/s11920-015-0585-x. [DOI] [PubMed] [Google Scholar]
- 6.Joos A, et al. Voxel-based morphometry in eating disorders: correlation of psychopathology with grey matter volume. Psychiatry Res. 2010;182:146–151. doi: 10.1016/j.pscychresns.2010.02.004. [DOI] [PubMed] [Google Scholar]
- 7.Suchan B, et al. Reduction of gray matter density in the extrastriate body area in women with anorexia nervosa. Behav. Brain Res. 2010;206:63–67. doi: 10.1016/j.bbr.2009.08.035. [DOI] [PubMed] [Google Scholar]
- 8.Titova OE, Hjorth OC, Schioth HB, Brooks SJ. Anorexia nervosa is linked to reduced brain structure in reward and somatosensory regions: a meta-analysis of VBM studies. BMC Psychiatry. 2013;13:110. doi: 10.1186/1471-244X-13-110. [DOI] [PMC free article] [PubMed] [Google Scholar]
- 9.Seitz J, et al. Morphological changes in the brain of acutely ill and weight-recovered patients with anorexia nervosa. A meta-analysis and qualitative review. Z. Kinder Jugend. Psychother. 2014;42:7–17. doi: 10.1024/1422-4917/a000265. [DOI] [PubMed] [Google Scholar]
- 10.Phillipou A, et al. Differences in regional grey matter volumes in currently ill patients with anorexia nervosa. Eur. J. Neurosci. 2018;47:177–183. doi: 10.1111/ejn.13793. [DOI] [PubMed] [Google Scholar]
- 11.Martin Monzon B, et al. Grey matter volume in adolescents with anorexia nervosa and associated eating disorder symptoms. Eur. J. Neurosci. 2017;46:2297–2307. doi: 10.1111/ejn.13659. [DOI] [PubMed] [Google Scholar]
- 12.Kohmura K, et al. Regional decrease in gray matter volume is related to body dissatisfaction in anorexia nervosa. Psychiatry Res. 2017;267:51–58. doi: 10.1016/j.pscychresns.2017.07.004. [DOI] [PubMed] [Google Scholar]
- 13.Fujisawa TX, et al. Anorexia nervosa during adolescence is associated with decreased gray matter volume in the inferior frontal gyrus. PLoS ONE. 2015;10:e0128548. doi: 10.1371/journal.pone.0128548. [DOI] [PMC free article] [PubMed] [Google Scholar]
- 14.D'Agata F, et al. Brain correlates of alexithymia in eating disorders: a voxel-based morphometry study. Psychiatry Clin. Neurosci. 2015;69:708–716. doi: 10.1111/pcn.12318. [DOI] [PubMed] [Google Scholar]
- 15.Bomba M, et al. Global and regional brain volumes normalization in weight-recovered adolescents with anorexia nervosa: preliminary findings of a longitudinal voxel-based morphometry study. Neuropsychiatr. Dis. Treat. 2015;11:637–645. doi: 10.2147/NDT.S73239. [DOI] [PMC free article] [PubMed] [Google Scholar]
- 16.Bar KJ, de la Cruz F, Berger S, Schultz CC, Wagner G. Structural and functional differences in the cingulate cortex relate to disease severity in anorexia nervosa. J. Psychiatry Neurosci. 2015;40:269–279. doi: 10.1503/jpn.140193. [DOI] [PMC free article] [PubMed] [Google Scholar]
- 17.Fonville L, Giampietro V, Williams SC, Simmons A, Tchanturia K. Alterations in brain structure in adults with anorexia nervosa and the impact of illness duration. Psychol. Med. 2014;44:1965–1975. doi: 10.1017/S0033291713002389. [DOI] [PubMed] [Google Scholar]
- 18.Amianto F, et al. Brain volumetric abnormalities in patients with anorexia and bulimia nervosa: a voxel-based morphometry study. Psychiatry Res. 2013;213:210–216. doi: 10.1016/j.pscychresns.2013.03.010. [DOI] [PubMed] [Google Scholar]
- 19.Friederich HC, et al. Grey matter abnormalities within cortico-limbic-striatal circuits in acute and weight-restored anorexia nervosa patients. Neuroimage. 2012;59:1106–1113. doi: 10.1016/j.neuroimage.2011.09.042. [DOI] [PubMed] [Google Scholar]
- 20.c S, et al. Gray matter decrease distribution in the early stages of Anorexia Nervosa restrictive type in adolescents. Psychiatry Res.: Neuroimaging. 2011;191:24–30. doi: 10.1016/j.pscychresns.2010.06.007. [DOI] [PubMed] [Google Scholar]
- 21.Brooks SJ, et al. Restraint of appetite and reduced regional brain volumes in anorexia nervosa: a voxel-based morphometric study. BMC Psychiatry. 2011;11:179. doi: 10.1186/1471-244X-11-179. [DOI] [PMC free article] [PubMed] [Google Scholar]
- 22.Boghi A, et al. In vivo evidence of global and focal brain alterations in anorexia nervosa. Psychiatry Res. 2011;192:154–159. doi: 10.1016/j.pscychresns.2010.12.008. [DOI] [PubMed] [Google Scholar]
- 23.Castro-Fornieles J, et al. A cross-sectional and follow-up voxel-based morphometric MRI study in adolescent anorexia nervosa. J. Psychiatr. Res. 2009;43:331–340. doi: 10.1016/j.jpsychires.2008.03.013. [DOI] [PubMed] [Google Scholar]
- 24.Frank GKW, Shott ME, Hagman JO, Yang TT. Localized brain volume and white matter integrity alterations in adolescent anorexia nervosa. J. Am. Acad. Child Adolesc. Psychiatry. 2013;52:1066–1075e1065. doi: 10.1016/j.jaac.2013.07.007. [DOI] [PMC free article] [PubMed] [Google Scholar]
- 25.van Opstal AM, et al. Hypothalamic BOLD response to glucose intake and hypothalamic volume are similar in anorexia nervosa and healthy control subjects. Front. Neurosci. 2015;9:159. doi: 10.3389/fnins.2015.00159. [DOI] [PMC free article] [PubMed] [Google Scholar]
- 26.Liberati A, et al. The PRISMA statement for reporting systematic reviews and meta-analyses of studies that evaluate healthcare interventions: explanation and elaboration. Br. Med. J. (Clin. Res. Ed.) 2009;339:b2700. doi: 10.1136/bmj.b2700. [DOI] [PMC free article] [PubMed] [Google Scholar]
- 27.Lim L, Radua J, Rubia K. Gray matter abnormalities in childhood maltreatment: a voxel-wise meta-analysis. Am. J. Psychiatry. 2014;171:854–863. doi: 10.1176/appi.ajp.2014.13101427. [DOI] [PubMed] [Google Scholar]
- 28.Hu X, et al. Meta-analytic investigations of common and distinct grey matter alterations in youths and adults with obsessive-compulsive disorder. Neurosci. Biobehav. Rev. 2017;78:91–103. doi: 10.1016/j.neubiorev.2017.04.012. [DOI] [PubMed] [Google Scholar]
- 29.Wang W, et al. Conjoint and dissociated structural and functional abnormalities in first-episode drug-naive patients with major depressive disorder: a multimodal meta-analysis. Sci. Rep. 2017;7:10401. doi: 10.1038/s41598-017-08944-5. [DOI] [PMC free article] [PubMed] [Google Scholar]
- 30.Radua J, et al. A new meta-analytic method for neuroimaging studies that combines reported peak coordinates and statistical parametric maps. Eur. Psychiatry. 2012;27:605–611. doi: 10.1016/j.eurpsy.2011.04.001. [DOI] [PubMed] [Google Scholar]
- 31.Radua J, et al. Anisotropic kernels for coordinate-based meta-analyses of neuroimaging studies. Front. Psychiatry. 2014;5:13. doi: 10.3389/fpsyt.2014.00013. [DOI] [PMC free article] [PubMed] [Google Scholar]
- 32.Carlisi CO, et al. Comparative multimodal meta-analysis of structural and functional brain abnormalities in autism spectrum disorder and obsessive-compulsive disorder. Biol. Psychiatry. 2017;82:83–102. doi: 10.1016/j.biopsych.2016.10.006. [DOI] [PubMed] [Google Scholar]
- 33.Favaro A, Tenconi E, Degortes D, Manara R, Santonastaso P. Effects of obstetric complications on volume and functional connectivity of striatum in anorexia nervosa patients. Int. J. Eat. Disord. 2014;47:686–695. doi: 10.1002/eat.22320. [DOI] [PubMed] [Google Scholar]
- 34.Frank GK. Altered brain reward circuits in eating disorders: chicken or egg? Curr. Psychiatry Rep. 2013;15:396. doi: 10.1007/s11920-013-0396-x. [DOI] [PMC free article] [PubMed] [Google Scholar]
- 35.Gaudio S, et al. Gray matter decrease distribution in the early stages of anorexia nervosa restrictive type in adolescents. Psychiatry Res. 2011;191:24–30. doi: 10.1016/j.pscychresns.2010.06.007. [DOI] [PubMed] [Google Scholar]
- 36.Vogt BA, Finch DM, Olson CR. Functional heterogeneity in cingulate cortex: the anterior executive and posterior evaluative regions. Cereb. Cortex (New York, NY: 1991) 1992;2:435–443. doi: 10.1093/cercor/2.6.435-a. [DOI] [PubMed] [Google Scholar]
- 37.Buckner RL, Andrews-Hanna JR, Schacter DL. The brain's default network: anatomy, function, and relevance to disease. Ann. N. Y. Acad. Sci. 2008;1124:1–38. doi: 10.1196/annals.1440.011. [DOI] [PubMed] [Google Scholar]
- 38.Sachdev P, Mondraty N, Wen W, Gulliford K. Brains of anorexia nervosa patients process self-images differently from non-self-images: an fMRI study. Neuropsychologia. 2008;46:2161–2168. doi: 10.1016/j.neuropsychologia.2008.02.031. [DOI] [PubMed] [Google Scholar]
- 39.Mcfadden KL, Tregellas JR, Shott ME, Frank GK. Reduced salience and default mode network activity in women with anorexia nervosa. J. Psychiatr. Neurosci. Jpn. 2014;39:178. doi: 10.1503/jpn.130046. [DOI] [PMC free article] [PubMed] [Google Scholar]
- 40.Lou HC, et al. Parietal cortex and representation of the mental self. Proc. Natl Acad. Sci. USA. 2004;101:6827–6832. doi: 10.1073/pnas.0400049101. [DOI] [PMC free article] [PubMed] [Google Scholar]
- 41.Wagner G, et al. Self-referential processing influences functional activation during cognitive control: an fMRI study. Soc. Cogn. Affect. Neurosci. 2013;8:828–837. doi: 10.1093/scan/nss074. [DOI] [PMC free article] [PubMed] [Google Scholar]
- 42.Nachev P, Kennard C, Husain M. Functional role of the supplementary and pre-supplementary motor areas. Nat. Rev. Neurosci. 2008;9:856–869. doi: 10.1038/nrn2478. [DOI] [PubMed] [Google Scholar]
- 43.Hikosaka O, Isoda M. Switching from automatic to controlled behavior: cortico-basal ganglia mechanisms. Trends Cogn. Sci. 2010;14:154–161. doi: 10.1016/j.tics.2010.01.006. [DOI] [PMC free article] [PubMed] [Google Scholar]
- 44.Friederich HC, Herzog W. Cognitive-behavioral flexibility in anorexia nervosa. Curr. Top. Behav. Neurosci. 2011;6:111–123. doi: 10.1007/7854_2010_83. [DOI] [PubMed] [Google Scholar]
- 45.Husain MM, et al. Subcortical brain anatomy in anorexia and bulimia. Biol. Psychiatry. 1992;31:735–738. doi: 10.1016/0006-3223(92)90284-7. [DOI] [PubMed] [Google Scholar]
- 46.Amianto F, et al. Intrinsic connectivity networks within cerebellum and beyond in eating disorders. Cerebellum. 2013;12:623–631. doi: 10.1007/s12311-013-0471-1. [DOI] [PubMed] [Google Scholar]
- 47.Mahler P, Guastavino JM, Jacquart G, Strazielle C. An unexpected role of the cerebellum: involvement in nutritional organization. Physiol. Behav. 1993;54:1063–1067. doi: 10.1016/0031-9384(93)90325-A. [DOI] [PubMed] [Google Scholar]
- 48.Zhu JN, Wang JJ. The cerebellum in feeding control: possible function and mechanism. Cell. Mol. Neurobiol. 2008;28:469–478. doi: 10.1007/s10571-007-9236-z. [DOI] [PMC free article] [PubMed] [Google Scholar]
- 49.Downing PE, Jiang Y, Shuman M, Kanwisher N. A cortical area selective for visual processing of the human body. Science. 2001;293:2470–2473. doi: 10.1126/science.1063414. [DOI] [PubMed] [Google Scholar]
- 50.Hummel D, et al. Neural adaptation to thin and fat bodies in the fusiform body area and middle occipital gyrus: an fMRI adaptation study. Hum. Brain Mapp. 2013;34:3233–3246. doi: 10.1002/hbm.22135. [DOI] [PMC free article] [PubMed] [Google Scholar]
- 51.Ehrlich S, et al. Reduced functional connectivity in the thalamo-insular subnetwork in patients with acute anorexia nervosa. Hum. Brain Mapp. 2015;36:1772–1781. doi: 10.1002/hbm.22736. [DOI] [PMC free article] [PubMed] [Google Scholar]
- 52.Suchan B, et al. Reduced connectivity between the left fusiform body area and the extrastriate body area in anorexia nervosa is associated with body image distortion. Behav. Brain Res. 2013;241:80–85. doi: 10.1016/j.bbr.2012.12.002. [DOI] [PubMed] [Google Scholar]
- 53.Giordano GD, et al. Volume measurement with magnetic resonance imaging of hippocampus-amygdala formation in patients with anorexia nervosa. J. Endocrinol. Invest. 2001;24:510–514. doi: 10.1007/BF03343884. [DOI] [PubMed] [Google Scholar]
- 54.McCormick LM, et al. Implications of starvation-induced change in right dorsal anterior cingulate volume in anorexia nervosa. Int. J. Eat. Disord. 2008;41:602–610. doi: 10.1002/eat.20549. [DOI] [PMC free article] [PubMed] [Google Scholar]
- 55.Phelps EA, LeDoux JE. Contributions of the amygdala to emotion processing: from animal models to human behavior. Neuron. 2005;48:175–187. doi: 10.1016/j.neuron.2005.09.025. [DOI] [PubMed] [Google Scholar]
- 56.Davis M, Whalen PJ. The amygdala: vigilance and emotion. Mol. Psychiatry. 2001;6:13–34. doi: 10.1038/sj.mp.4000812. [DOI] [PubMed] [Google Scholar]
- 57.Joos AAB, et al. Amygdala hyperreactivity in restrictive anorexia nervosa. Psychiatr. Res.: Neuroimaging. 2011;191:189–195. doi: 10.1016/j.pscychresns.2010.11.008. [DOI] [PubMed] [Google Scholar]
- 58.Holliday J, Tchanturia K, Landau S, Collier D, Treasure J. Is impaired set-shifting an endophenotype of anorexia nervosa? Am. J. Psychiatry. 2005;162:2269–2275. doi: 10.1176/appi.ajp.162.12.2269. [DOI] [PubMed] [Google Scholar]
- 59.Bush G, Luu P, Posner MI. Cognitive and emotional influences in anterior cingulate cortex. Trends Cogn. Sci. 2000;4:215–222. doi: 10.1016/S1364-6613(00)01483-2. [DOI] [PubMed] [Google Scholar]
- 60.Zastrow A, et al. Neural correlates of impaired cognitive-behavioral flexibility in anorexia nervosa. Am. J. Psychiatry. 2009;166:608–616. doi: 10.1176/appi.ajp.2008.08050775. [DOI] [PubMed] [Google Scholar]
- 61.Olivo G, et al. Atypical anorexia nervosa is not related to brain structural changes in newly diagnosed adolescent patients. Int. J. Eat. Disord. 2018;51:39–45. doi: 10.1002/eat.22805. [DOI] [PubMed] [Google Scholar]
- 62.Bjornsdotter M, et al. Grey matter correlates of autistic traits in women with anorexia nervosa. J. Psychiatr. Neurosci. 2018;43:79–86. doi: 10.1503/jpn.170072. [DOI] [PMC free article] [PubMed] [Google Scholar]
- 63.Lavretsky H, Roybal DJ, Ballmaier M, Toga AW, Kumar A. Antidepressant exposure may protect against decrement in frontal gray matter volumes in geriatric depression. J. Clin. Psychiatry. 2005;66:964–967. doi: 10.4088/JCP.v66n0801. [DOI] [PubMed] [Google Scholar]
- 64.Kressel, H. Y. Setting Sail: 2017. Radiology282, 4–6 (2017). [DOI] [PubMed]
- 65.Lui, S., Zhou, X. J., Sweeney, J. A., & Gong, Q. Psychoradiology: The Frontier of Neuroimaging in Psychiatry. Radiology281, 357–372 (2016). [DOI] [PMC free article] [PubMed]
- 66.Port, J. D. Diagnosis of Attention Deficit Hyperactivity Disorder by Using MR Imaging and Radiomics: A Potential Tool for Clinicians. Radiology287,631–632(2018). [DOI] [PubMed]
- 67.Sun, H. et al. Psychoradiologic Utility of MR Imaging for Diagnosis of Attention Deficit Hyperactivity Disorder: A Radiomics Analysis. Radiology287, 620–630 (2018). [DOI] [PubMed]