Abstract
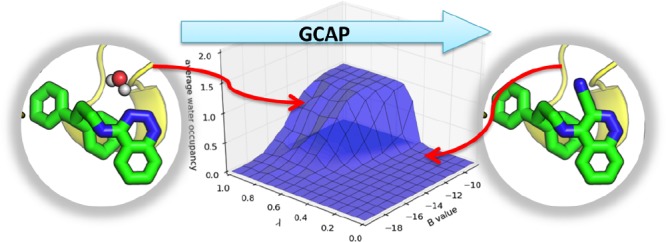
Computational methods to calculate ligand binding affinities are increasing in popularity, due to improvements in simulation algorithms, computational resources, and easy-to-use software. However, issues can arise in relative ligand binding free energy simulations if the ligands considered have different active site water networks, as simulations are typically performed with a predetermined number of water molecules (fixed N ensembles) in preassigned locations. If an alchemical perturbation is attempted where the change should result in a different active site water network, the water molecules may not be able to adapt appropriately within the time scales of the simulations—particularly if the active site is occluded. By combining the grand canonical ensemble (μVT) to sample active site water molecules, with conventional alchemical free energy methods, the water network is able to dynamically adapt to the changing ligand. We refer to this approach as grand canonical alchemical perturbation (GCAP). In this work we demonstrate GCAP for two systems; Scytalone Dehydratase (SD) and Adenosine A2A receptor. For both systems, GCAP is shown to perform well at reproducing experimental binding affinities. Calculating the relative binding affinities with a naïve, conventional attempt to solvate the active site illustrates how poor results can be if proper consideration of water molecules in occluded pockets is neglected. GCAP results are shown to be consistent with time-consuming double decoupling simulations. In addition, by obtaining the free energy surface for ligand perturbations, as a function of both the free energy coupling parameter and water chemical potential, it is possible to directly deconvolute the binding energetics in terms of protein–ligand direct interactions and protein binding site hydration.
Introduction
It is understood that active site water molecules can have a large impact on the binding free energy of a protein–ligand complex.1−3 In recent years, efforts have been made to rationalize these active site interactions, addressing such questions as where are water molecules located, what impact do they have on ligand binding, and ultimately, how can knowledge of the water molecules help to design new, high affinity molecules4 Computational methods of varying speed and accuracy exist to locate active site water molecules and predict their binding affinities.5−15 However, it is still unclear as to whether a ligand should be designed to displace an active site water molecule—for entropic gain and direct interaction between protein and ligand, or if a ligand’s interactions should be optimized to utilize water molecules through stabilizing bridging interactions.
Many methods15 exist to calculate locations of water molecules and/or binding free energies, using molecular dynamics (MD)11,12,16,17 and Monte Carlo (MC)13,14,18 techniques, as well as knowledge-based approaches.8,19 Methods predicting water locations are validated by their ability to reproduce crystallographic water locations,20 but this is limited by both the resolution of the X-ray structure and the correct assignment of the electron density. Even with high resolution structures, 50% of water molecules can be assigned to locations more than 1 Å away from the hydration sites proposed by a different crystallographer.21 Disordered or partially occupied hydration sites blur the electron density and can be particularly ambiguous to assign,21 and hydration sites unreported by crystallographic methods have been captured by NMR techniques.22 Efforts have been made to clarify these water locations by looking at an ensemble of similar, superimposed crystal structures to find conserved water molecules.23,24 PDB_REDO is a method developed to remove human-error in structure refinement, by automating the refinement, rebuilding, and revalidation of existing PDB entries.25 Despite these efforts, understanding the correct active site water network for a given protein–ligand complex can be difficult.
While there are experimental data to assess success in locating water molecules computationally, experimental data for binding free energies of water molecules are not readily available. Nevertheless, binding affinities of water molecules can be inferred either from their resistance to displacement by classes of ligands or indirectly from the experimental energy decomposition of protein–ligand binding.2,26 Lack of direct experimental data is a double edged sword—while the lack of experimental data makes computational methods difficult to validate, it also signifies an issue in which computational efforts can provide more insight than experiment. Predictions of water binding free energies are best calculated using rigorous free energy methods. The absolute binding free energy of a water molecule can be calculated by double decoupling (DD), whereby a water molecule in a system is turned off over an alchemical pathway, known as a λ coordinate. DD requires a knowledge of the water binding site and use of restraints or constraints to limit the configuration phase space sampled by the molecule as its interactions are turned off.27,28 For the study of a network of n water molecules, DD would require n separate simulations to decouple each water molecule sequentially. As it is one of the most rigorous methods, DD will be used here as a benchmark comparison for calculating binding free energies of water molecules, as a reliable experimental benchmark is lacking.
Grand Canonical Monte Carlo
Grand canonical Monte Carlo (GCMC) is a method that can predict both the locations of water molecules and the binding free energies of networks of water molecules, all within the same protocol, using the grand canonical integration (GCI) equation.29,30 The free energies calculated using GCI have previously been shown to be consistent with DD results.30 GCMC is more powerful than DD in the context of water binding free energies, as no a priori knowledge of exact water sites is required, and the binding free energies of entire networks can be determined in a single series of simulations, rather than requiring repeated simulations to decouple each water in a network. GCMC involves simulating in the μVT ensemble, where the chemical potential (μ) is a constraint, and the number of molecules (N) are allowed to fluctuate. In this case, the molecules allowed to fluctuate are water molecules and do so by Monte Carlo insertion and deletion moves29 within a user-defined GCMC volume of the simulated system. As the GCMC volume is user-defined, it can be used to study, for instance, a single water site, an occluded pocket of interest, or an entire active site, depending on the needs of the scientist. The GCMC methodology used herein follows the Adams formulation,31,32 which uses a variable B in place of the chemical potential μ, eq 1.
| 1 |
 is the inverse of the bulk number
density—the
volume of a single water molecule—for a given water model using
the same simulation parameters, and Vsys is the volume of the user-defined GCMC region. β is
  . A
. A  of 30.0 Å3 is used throughout. The B value is considered
in
the Monte Carlo insertion and deletion acceptance criteria29 and influences the water occupancy of the GCMC
region throughout the simulation. Ross et al. demonstrated the methodology
to calculate active site water locations and the binding free energy
of the water network through performing a titration simulation, whereby the system is simulated at a range of B values and the free energy of the water network is calculated
using the GCI equation.29,30 The GCI equation, eq 2, calculates standard state
binding free energy of binding of (Nf – Ni) water molecules to a system, where Bk is the Adams parameter for which there are
an average of Nk waters.
| 2 |
Convergence of the simulation is improved by performing replica exchange (RE) between the replicas simulated at different B values. Alternatively, rather than performing a titration simulation, it is possible to simulate at the equilibrium B (Beq) value, which allows for the modeling of the active site in dynamic equilibrium with bulk water. Beq, shown in eq 3, can be calculated when the excess chemical potential of water, μsol′, is known, which is the hydration free energy of a water molecule (calculated as −6.2 kcal·mol–1 for TIP4P29,33,34).
| 3 |
Simulating at Beq, rather than a range of B values as performed with the titration simulations, only affords the location of the water molecules, rather than the network binding free energies. GCI has recently been demonstrated to characterize the water stability of a four-water network in a series of 35 bromodomain systems.35 The GCMC simulations performed here use mpi on CPUs, with one process per B value. Typically, a titration simulation will be run in a parallel computational environment, with upward of 10 processes. The single-B value simulations are cheaper, requiring only a single CPU core. GCMC therefore presents a methodology to calculate simultaneously the locations of multiple water molecules and rigorously determine their binding free energies.
Water molecules in active sites can vary between being localized or diffuse, and bulk-like. Exchange between water molecules in buried cavities will be slow, and during simulations where a ligand is bound, there may not be a kinetic pathway available for active site water molecules to exchange with the bulk water of the simulation. Conversely, bulk water molecules may not be able to enter these sites through standard sampling. The GCMC region is defined by a hard-wall potential that is applied only to water molecules—keeping GCMC water molecules within the region, and bulk water molecules out.
While GCMC is a powerful method for considering the nature of active site water molecules, the metric of primary interest in drug design is the binding affinity of the ligand itself.36 Methods to calculate this are similar to DD, in that the free energy is calculated by perturbing the ligand across an alchemical pathway, using λ windows. However, while with DD, a single water molecule is being annihilated yielding an absolute binding free energy, relative binding affinities of ligands can be calculated by perturbing one ligand into another.37 This perturbation can be performed using either single-topology (one ligand is changed into the other by mapping the topologies of the two ligands and changing the ligand parameters) or dual-topology (two ligands are present, and the interactions of one are switched off while the others are turned on).38 These methods are reliable when the two end-states of the system are similar. Issues can arise if the end-states differ, e.g. if the two active site water networks for each of the ligands vary significantly. As the ligand is perturbed, it can be difficult for the water network to adapt as the active site can be densely packed and the time scales of rearrangement or diffusion are longer than those achievable.26 If a ligand perturbation “grows” in an active site, it may trap a water molecule and cause unphysical high energy conformations.39 Conversely, if a ligand is “shrinking” such as a functional group being removed creating a vacancy in an active site, hindered water diffusion can create an unnatural “vacuum”.
Grand Canonical Alchemical Perturbations
Here we propose grand canonical alchemical perturbations (GCAP) as the methodology whereby relative ligand free energies can be calculated, in combination with GCMC to correctly model the active site hydration state of the ligands, for every λ intermediate. This allows for the correct, equilibrium hydration state to be modeled for both ligands, as well as all intermediate λ states. As with GCMC simulations, GCAP can be performed at a range of B values, resulting in a two-dimensional simulation, over a range of B and λ values. This results in a two-dimensional binding free energy surface and hence will be referred to as 2D-GCAP. Alternatively, if only Beq is simulated, each λ window is dynamically hydrated to an extent appropriate for equilibrium with bulk water, and the result is a one-dimensional free energy curve along λ (1D-GCAP). As GCAP is able to alter the hydration of the grand canonical region of the simulation, this allows for the relative free energy of two ligands with differing water occupancies to be determined in a single free energy simulation. GCMC has been used previously to study changing water networks for an absolute binding free energy calculation.40 Unlike previous work, we are simulating fully in the μVT ensemble, as opposed to only periods of μVT used for equilibration. Further, we show here how simulations using multiple B values can be used to construct self-consistent thermodynamic cycles for sets of ligands, with the full benefits of replica exchange in both B and λ.
For 1D-GCAP simulations, as only λ is varied and B is constant at the equilibrium Beq value, the relative free energy of two ligands can be determined using classical free energy approaches: thermodynamic integration (TI), Bennett’s Acceptance Ratio (BAR),41 or Multistate BAR (MBAR).42 As with running GCMC at a single B value, 1D-GCAP is only able to determine the equilibrium number and location of water molecules, rather than the binding affinities of the water network. RE may be performed between simulations at different λ values to aid convergence.43,44
In 2D-GCAP simulations, a range of both λ and B values are simulated. An illustration of the 2D-GCAP simulations is shown in Figure 1. The 2D-GCAP simulations are aided by replica exchange (RE) in both dimensions: λ and B.30 The relative binding free energy of the ligands in their equilibrium hydration states, as well as the number of water molecules, their locations, and the binding free energy of the water networks can all be determined from 2D-GCAP. For the 2D-GCAP simulations, MBAR is trivially applied to two dimensions, allowing for all available states of the simulation to contribute in calculating the relative free energy of the two ligands and their associated water networks.42 This is calculated by using the reduced potential function, eq 4 with the MBAR estimator.
| 4 |
i is the index over all states, Ui is the potential energy according to the ith Hamiltonian, μi is the chemical potential of the ith state, and N is the occupancy of water molecules of state x. This 2D-MBAR allows the free energy of the ligand perturbation to be calculated from the entire 2D-GCAP simulations, using statistically optimal contributions from all simulated states. 2D-GCAP is advantageous over 1D-GCAP, as it is able to calculate the binding free energy of networks of water molecules for any perturbed state of the ligands, while also benefiting from the convergence advantage of RE in B.30 The computational resources required by 1D-GCAP are determined by the specified number of λ windows. 2D-GCAP requires the equivalent resources multiplied by the number of B values simulated.
Figure 1.
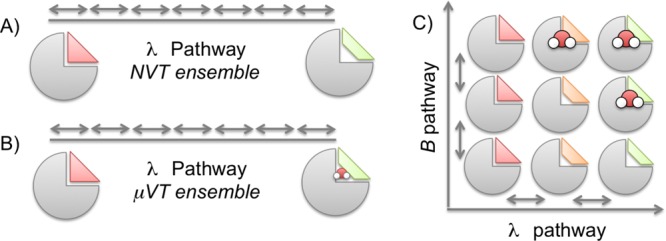
Relative ligand free energy methods, where one ligand (red) is perturbed to another (green) across a λ coordinate. (A) A typical relative ligand free energy simulation where the perturbation is performed in an NVT ensemble and the hydration state of the protein–ligand system is unable to adapt to the perturbation. (B) 1D-GCAP. The same perturbation in the grand canonical ensemble, where GCMC allows the water occupancy to vary across the λ pathway. The equilibrium chemical potential (herein Beq is used) solvates each ligand in dynamic equilibrium with bulk water. (C) 2D-GCAP. Both a λ pathway and range of B values are simulated, generating a two-dimensional network, with RE between neighboring states. The relative free energy between different B and λ values can be determined from the surface, using MBAR. Free energies of water networks can be calculated by using the GCI equation at a given λ value. Calculating relative ligand binding affinities requires a corresponding bulk water ligand perturbation. The bulk leg contributions are included in the calculation but excluded from this graphic for clarity.
Two systems will be used to present this method; Scytalone Dehydratase (SD) and a water-soluble form of adenosine A2A receptor (A2A). In both cases, the pocket is occluded from bulk, and therefore exchange between these hydration sites and bulk water would be hindered in the simulation. The water sites are fairly localized and well-defined—however GCAP would also capture diffuse, or partially occupied sites. SD has been used previously as a test system for free energy methods; there are three similar ligands with a common scaffold, with significantly different binding free energies.45 These differences have been suggested to be due to the favorable displacement of an active site water molecule.46 Michel et al. used this system to demonstrate stepwise free energy calculations, whereby the ligand perturbation is performed, followed by DD of water molecules in the system.39 Their method will be reproduced herein for comparison to the GCAP methodologies. The GCMC region for SD will be a 4 × 4 × 4 Å3 cubic box focused on the single potential water site illustrated in Figure 2.
Figure 2.
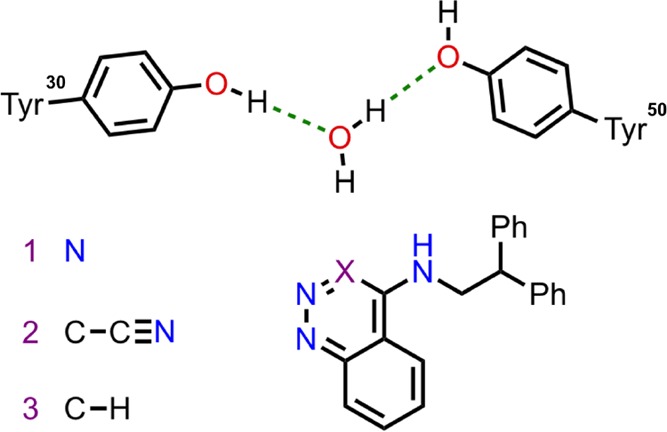
Representation of the SD ligand binding site, with the structures of ligands 1, 2, and 3 shown. The potential active site water location is shown, with hydrogen bonds (green dash) to two active site tyrosine residues. Ligand 2 is the only compound for which a crystallographic structure is available (PDB: 3STD), in which there is no water molecule present. The binding modes of ligands 1 and 3 have been assumed to be the same as ligand 2. The presence of a water molecule with the smaller ligands 1 and 3 has been studied by Michel et al.39
For Adenosine A2A receptor (henceforth
referred to as A2A),47 there are 12 antagonists in the data set of 1,2,4-triazine
derivatives published, where various aromatic substitutions have been
made to either ring A or ring B; see Figure 3. Ligand names, R group numbering, and ring
labeling are consistent with the previously published work.47 Of the 12 ligands, three have been selected
for free energy calculations here: ligands E, F, and G, Figure 3. These were chosen as both
E and G have holo-crystal structures available (E PDB: 3UZC, G PDB: 3UZA), the differences
between the ligands are all located on ring A, and the relative free
energies calculated from both the Ki and KD data are consistent to within 1 kcal·mol–1, which is the level of accuracy for which we would
aim computationally. More details of the comparison of Ki and KD are available
in the SI. Any experimental Δ s reported herein correspond to
the KD results. The only two crystallographic
structures
of the 1,2,4-triazine derivatives available are of ligands E and G,
which are of 3.341 and 3.273 Å resolution, respectively. As these
structures are low resolution, no crystallographic water molecules
have been resolved. While the lack of crystallographic water locations
makes the validation of GCMC more difficult, it illustrates a system
where water placement methodologies can be of most help.
Figure 3.

Three A2A ligands that will be considered herein. All of the substitutions are to ring A in the molecule.
As the ligand perturbations are all on ring A, a GCMC region covering a protein pocket near ring A is sampled. As there are no crystallographic waters, it is not known a priori how many hydration sites this region covers, but it is more complex than the single water site considered for SD. The cavity near ring B is naïvely solvated using ProtoMS48 during the system set up.
Methods
System Set-up
Proteins: The protein structures of Scytalone Dehydratase (SD) and A2A were generated from 3STD and 3UZA, respectively. For consistency with previous studies,29,30,39 a scoop of 15 Å around the ligand was taken for SD and only side chains in the inner 10 Å was sampled. For A2A a larger scoop of 20 Å was used, with side chain and backbone sampling in the inner 16 Å, and side chain only beyond that. The protonation and tautomer states of the proteins were determined using molprobity49 for SD and Maestro50 for A2A. A2A has an active site His278 residue; this was ϵ protonated during the set up. Owing to its proximity to the GCMC region, the 1D-GCAP simulations were repeated for the δ protonated His278. GCMC results can be dependent on the tautomer and rotamer of histidine used in a simulation,51 and these results are discussed in the Supporting Information, Figure S.6.
Ligands: For SD, the structure and binding position of ligand 2 was taken from the pdb file (PDB: 3STD). For A2A the PDB file of the complex containing ligand G is used (PDB: 3UZA). Models of the other ligands (1 and 3 for SD, and E and F for A2A) studied were generated from these scaffolds.
Solvation: Protein–ligand complexes were solvated using a half-harmonically restrained sphere of radius of 30 Å, with any crystallographic water locations retained. This includes solvating any sterically available active site regions. For the free simulation legs, each ligand is solvated in a cubic box with a padding distance of 10 Å between ligand and box edge. For grand canonical simulations, water molecules within the GCMC region are removed prior to the simulation. Removing the water molecules before simulating removes any potential bias toward sampling particular water locations. However, if crystallographic water locations were available, it is possible to begin the simulation with these water molecules “on”.
For any simulation performed with either multiple λ windows or multiple B values (or both), replica exchange between neighboring B and λ values was attempted every 100,000 moves. RE is first attempted between all neighboring λ windows, for each set of B simulations, followed by attempting RE between neighboring B values. Attempting the swap in the opposite order would be equally valid. For consistency with previous publications, a nonbonded interaction cutoff of 10.0 Å was used for SD, and a cutoff of 15.0 Å for A2A simulations was used. There is no calculation of long-range interactions, since the inclusion of long-range electrostatics by particle mesh Ewald in MC is prohibitively expensive.
Simulation
All simulations have been performed using the ProtoMS software package (Version 3.4).48 Proteins, ligands, and water (GCMC and bulk) were modeled using Amber14SB force-field,52 gaff14, and TIP4P,34 respectively.
GCMC
For SD and A2A, a region of the active site was defined using a GCMC box. For SD, this is a small box over a single active site water molecule and for A2A, a box covering the active site cavity near ring A was used, shown in Figure 4. GCMC region details are available in Table S.1. The simulation consists of an initial GCMC equilibration of 5 M MC moves, with a 1:1:1 ratio of insertion, deletion, and GC water sampling moves. Following this, 5 M equilibration and 80 M production MC steps are attempted on the entire system with the sampling ratios shown in Table S.2.
Figure 4.
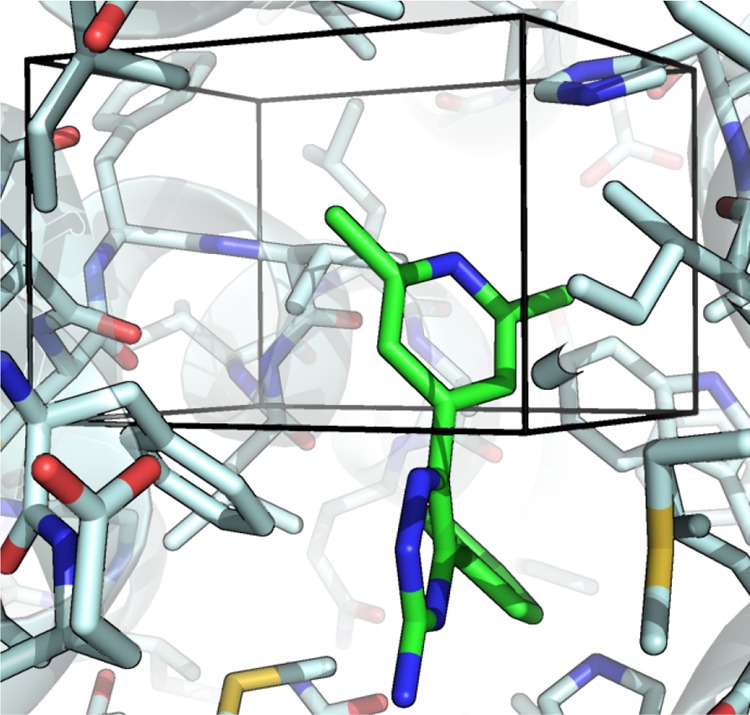
Active site of A2A ligand G (PDB: 3UZA). Protein residues (light blue) Ligand G (green) shown as sticks, with nitrogen (blue), oxygen (red), and sulfur (yellow) shown. The GCMC box region, shown as black lines, covers ring A of ligand G, and the active site cavity near ring A. No water molecules are shown, as there are no resolved water molecules in the crystal structure.
The GCMC region is defined using Cartesian coordinates. The GCMC region prevents bulk water molecules from entering the region, or GCMC water molecules from leaving. GCMC simulations were previously shown to be independent of the definition of the GCMC region, as long as the hydration sites of interest are contained within.30 The region is, however, permeable to protein and ligand atoms, which are able to sample normally. There is no restraint placed on the ligand in any simulations, and it would be free to drift toward hydration sites, when the sites are unoccupied.
For SD, GCMC was performed at 16 equally spaced B values from −22.7 to −7.7. As the binding free energy of the water molecule with ligand 3 is unfavorable, higher B values are required to couple the water into the system; therefore, for this ligand GCI was repeated for 16 B values from −12.7 to +2.3.
Alchemical Perturbations
Single-topology alchemical transformations were performed on pairs of SD ligands. Perturbations were performed in two stages; considering the perturbation as taking place from a large molecule to a small, the electrostatic parameters were first perturbed, followed by the van der Waals (vdW) interactions. Each simulation is split across 16 equally spaced λ windows. These perturbations are performed both in the bound state and for the ligand in bulk solvent. 5 M MC equilibration steps are performed, followed by 40 M production steps. The ratio of MC moves for each system is shown in the SI, Table S.2.
GCMC has been shown previously to be consistent with double decoupling methods for calculating binding free energies of water molecules.29,30 To validate the thermodynamic consistency of GCAP, the SD system was simulated in the bound state both with and without the active site water molecule. In addition, DD has been performed on the active site water location in SD with all three ligands, consistent with the method described by Ross et al.30 These simulations generate the thermodynamic cycle shown in Figure 6, that allows for a comparison to the GCAP results, in addition to the experimental data.
Figure 6.
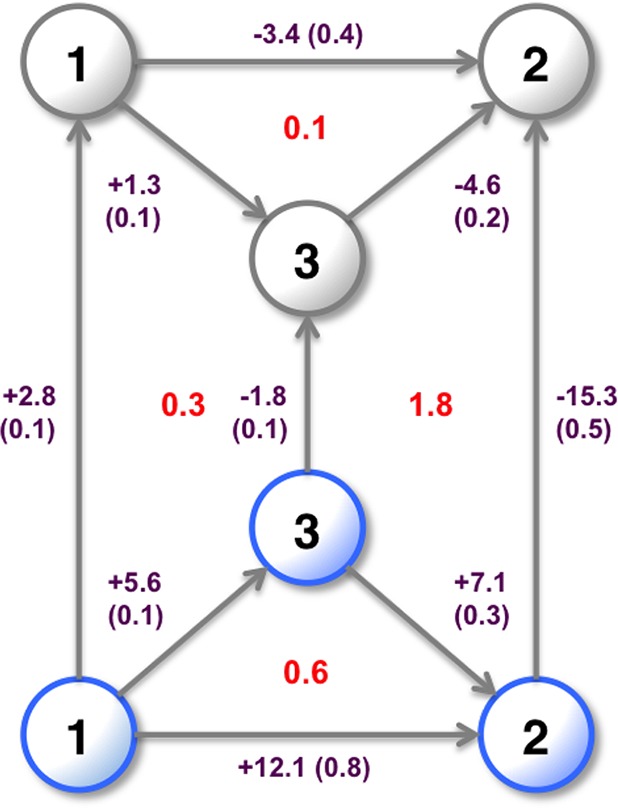
Relative binding free energies in kcal·mol–1 of ligands 1, 2, and 3, with (blue) and without (gray) the active site water molecule (shown in Figure 2) present. Free energies calculated using MBAR. No GCMC or GCAP simulations were used to generate this map. Vertical legs correspond to the free energy of decoupling the water from the system. This cycle is taken from Michel et al., recalculated with similar conditions where possible using the ProtoMS software package and alternative force fields. Standard errors from four independent repeats are shown in parentheses, and thermodynamic cycle closures in red. The calculated binding free energies include the free energies from the equivalent bulk-water simulations.
GCAP
The GCAP simulations followed the single-topology set up outlined above. These simulations were performed for the pairs of SD ligands, and pairs of A2A ligands. The MC move ratios are the same as for the alchemical perturbation simulations, but with additional grand canonical MC moves. Details of move ratios are available in Table S.2. For SD, 2D-GCAP simulations were performed with the B values shown in SI Table S.4. For A2A, 2D-GCAP was performed with 10 equally spaced B values between −21.654 to −3.654 inclusive, so as to cover the Beq value, while also titrating down to the B value where the water occupancy is zero. 1D-GCAP simulations were also performed on each system, at their respective Beq values (SD: −9.70, A2A: −7.65).
Results
GCAP simulations have been performed on two systems—SD and A2A. SD is a well-studied system,29,39 where a small change in the ligand results in large differences in affinity due to the displacement of an active site water molecule, shown in Figure 5.45 As only one water is displaced, it is possible to validate the GCAP method using sequential steps of NVT alchemical perturbations and DD. To explore GCAP for a multiwater system, a series of 1,2,4-triazine derivatives A2A antagonists have been reported.47 These A2A antagonists have a range of ligand binding free energies, and previous studies have suggested that differences in affinity may arise from different active site water networks.53,54 Using three of these ligands, E, F, and G, shown in Figure 3, a thermodynamic cycle has been created, and the relative binding free energy has been calculated using both the 1D-GCAP and 2D-GCAP methodology.
Figure 5.
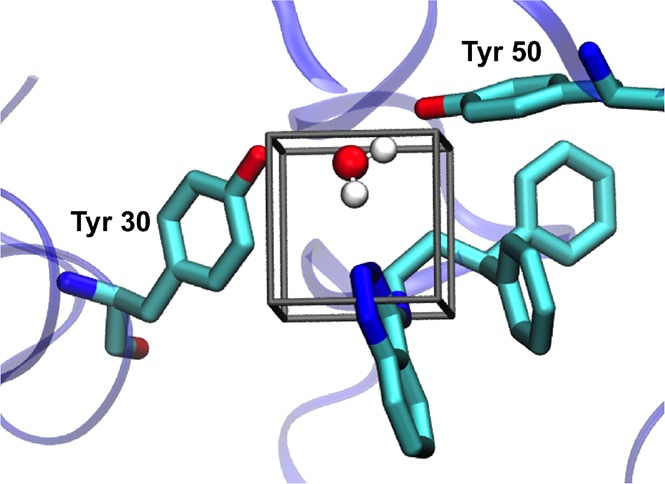
Ligand 1 binding to the active site of SD (PDB: 3STD), with the GCMC region shown by a black box. Key tyrosine residues are shown. Water position is calculated from GCMC simulations.
Scytalone Dehydratase
For simple cases such as SD, where the water occupancy of the system is changing only by one for a set of ligands, a thermodynamic cycle can be constructed, as was illustrated by Michel et al.39 Their thermodynamic cycle for SD has been reproduced using our open-source software package, ProtoMS as a comparison for the GCAP simulations, Figure 6.48
The two triangular cycles correspond to single-topology transformations between the three ligands in both the absence and presence of the water (gray and blue cycles respectively), calculated with typical alchemical perturbation simulations. The vertical legs correspond to the free energy of removing the water in each of the protein–ligand complexes, calculated by DD. A positive energy indicates a favorably bound water molecule, as it requires energy to remove the water from the system. Where the energy of the water is unfavorable, it would not be expected to be present in the bound ligand complex. These water binding free energies therefore indicate that the water is expected to be present with ligand 1, and not with ligands 2 or 3. For the hydrated cycle, a water molecule has been placed in the active site but no restraints are used to maintain its location. For simulations involving ligand 2, the clash between the water molecule and the ligand is large such that the water is displaced and pushed into a nearby hydrophobic pocket, which was also observed by Michel et al.39 Two thermodynamic cycles have poor cycle closures (0.6 and 1.8 kcal mol–1). The first is within the simulation standard error; however, both these cycles involve this very unfavorable high-energy state where a water molecule is forced into a hydrophobic pocket by ligand 2.
The relative binding free energy of two ligands with different water occupancies can be calculated by adding the free energies of steps between these two states. Multiple pathways exist between the states, which can result in a range of relative free energies for each pair of ligands. This has been simplified to a single set of relative binding free energies by choosing the pathway with fewest steps between two states. Where there are two pathways with the same number of steps, the pathway with the smaller combined statistical error has been chosen. Figure 7, cycle A shows the optimum calculated free energies of binding for the ligands at their preferred hydration states. These simulations are able to correctly rank the relative binding free energies of the three ligands. However, two of the three legs are further than one standard error from the experimental result.
Figure 7.
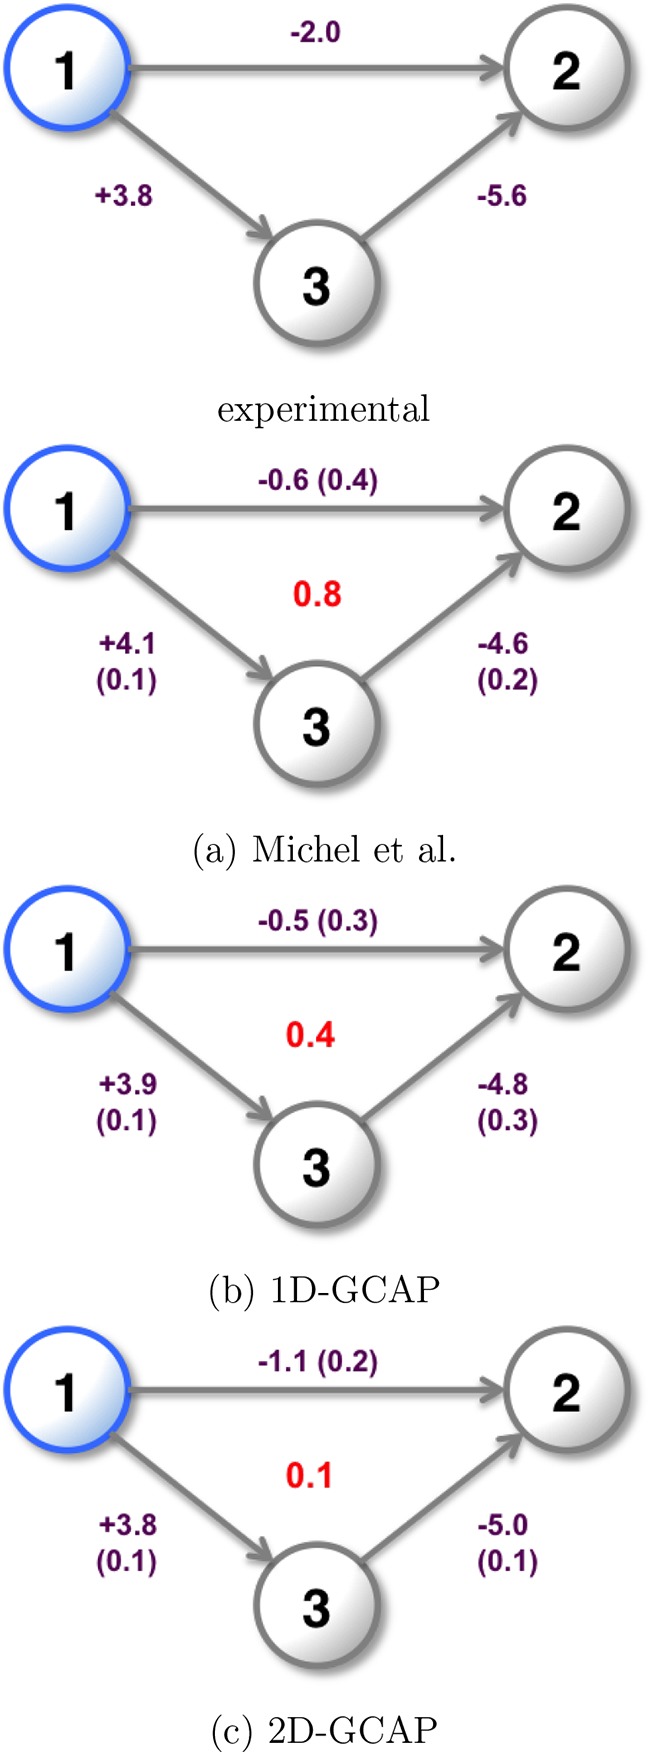
Relative binding free energies of the three SD ligands in kcal·mol–1. Blue indicates a ligand expected to maintain the water in the active site. The experimental binding free energies45 are shown along with cycle (a) generated from Figure 6, using MBAR for ligand perturbations and water perturbations. Cycle (b) calculated using 1D-GCAP, and cycle (c) calculated using 2D-GCAP. Standard errors from four repeats are shown in parentheses and overall cycle closures in red.
Multiple alchemical perturbations and DD simulations are required to generate these results, which is only feasible as the water occupancy is being varied by one. To generate a thermodynamic map for an n water network in a protein site would require n DD simulations to decouple each of the waters sequentially, or n! simulations if all the different possible orders of annihilation of water molecules were considered.
GCMC has been shown to be preferable to decoupling methods as the location of the hydration sites is not needed and the binding free energy of n waters can be determined in a single simulation series, while also capturing cooperative binding effects in water networks.29,30 GCAP is able to perform a ligand transformation (either single or dual topology, but only single is used here), with GCMC being used at each λ value of the transformation. This allows the correct water occupancy to be adopted at each λ value. This means that the thermodynamic free energy difference between two ligands—despite any differences in their respective water occupancies or locations—can be calculated within a single simulation series.
1D-GCAP
As it is possible to perform GCMC simulations at Beq to predict the equilibrium water occupancy and locations, it is also possible to perform GCAP at one B value per λ value. However, this loses the sampling benefits gained from replica exchange in B in improving the precision of the results.30 The binding affinities of water networks are also unavailable when reducing the simulation to a single B value. The results for 1D-GCAP simulations are shown in Figure 7, cycle B. The free energies calculated are consistent to within error of those calculated by separate MBAR and DD simulations (cycle A), and with smaller errors per leg.
2D-GCAP
The relative binding free energies of the ligands calculated using 2D-GCAP are shown in Figure 7, cycle C.
As described in the methods, simulations at multiple B and λ values are performed with additional RE moves. MBAR is used to estimate the free energy difference between the ligands with their optimal hydration states. These free energy results are in good agreement with both the experimental results and the simulation results in cycle A. The 2D-GCAP simulations perform the best of the three computational methods at reproducing the experimental results, although all methods are consistent to within error. The standard deviation for each simulation leg is the smallest for 2D-GCAP, and the cycle closure is very small at 0.1 kcal·mol–1.
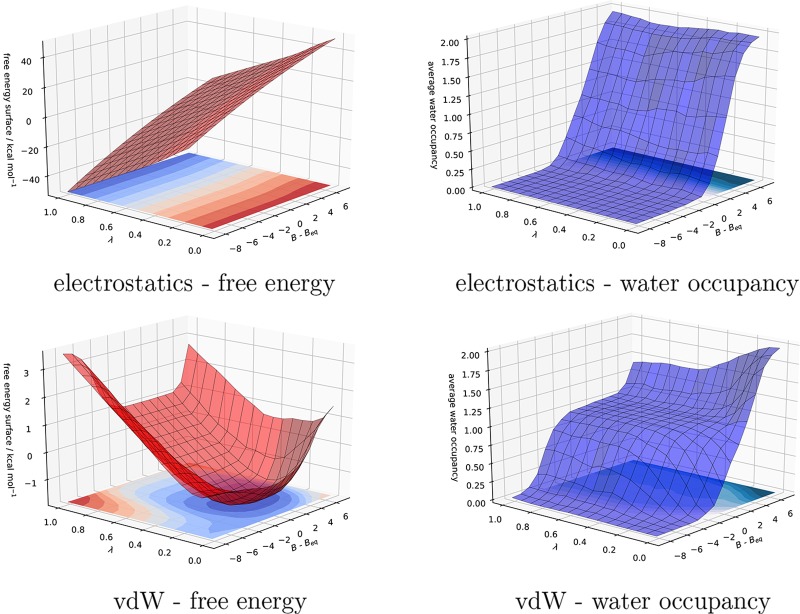
For SD, changes in water occupancy were observed during the van der Waals (vdW) legs of the free energy calculations, when the R group of the ligand is reduced or grown in size. For this reason the free-energy surface generated by the electrostatic and vdW legs of the 2D-GCAP is shown in Figure 8, for the ligand 1 (λ = 1) to 3 (λ = 0) simulation. The perturbation between ligands 1 and 3 corresponds to the change from an aromatic nitrogen (ligand 1) to an aromatic CH group (ligand 3). The surfaces show the change in free energy with both λ and B–Beq, where B–Beq is the B value of the simulation, relative to the equilibrium value (Beq). Where B–Beq = 0, the system is in dynamic equilibrium with bulk. B–Beq < 0 is a B value lower than equilibrium where the system will be under-hydrated, while B–Beq > 0 is a higher B value than equilibrium and the system will be overhydrated. Examples of both electrostatic and vdW surfaces for all three pairs of ligands are available in the Supporting Information, Figure S.4. In all cases, λ = 0 corresponds to the larger ligand, and λ = 1 to the smaller.
Figure 8.
Binding free energy surface (red) and the GCMC water occupancy (blue) for the electrostatics and vdW legs of the 2D-GCAP simulations of SD ligands, 1 (λ = 1) and 3 (λ = 0). The B values that have been simulated have been plotted, relative to the equilibrium B value (Beq), where at 0 the GCMC region is in dynamic equilibrium with bulk water. Combining the electrostatic and vdW surfaces, the difference in free energy at the minima at λ = 0 and 1, along with the equivalent free ligand perturbation in bulk water, gives the relative binding free energy of the two ligands. Details of how surfaces are calculated can be found in the SI.
The electrostatics surfaces indicate that there is little change in the water occupancy of the GCMC region when the electrostatics of ligand 1 are perturbed to those of ligand 3. Considering the vdW surfaces, the minimum in the free energy for ligand 1 (at the cross section of λ = 1) is within the B–Beq range of ≈0 to −2, which corresponds to a water occupancy of 1, while for ligand 3 (λ = 0), the free energy is at a minimum at B–Beq values equal to, and less than 0, which corresponds to a water occupancy of 0. In both cases this is consistent with the water occupancy determined by DD and MBAR in Figure 6. Conversely, the free energy of ligand 1 is high when the active site is empty (low B values) or the water occupancy exceeds 1 (high B values). For ligand 3 (λ = 0), the free energy increases when any water is present. The free energy difference between the minima at the two λ end-points for the electrostatic and vdW surface, combined with the corresponding free perturbations, affords the relative binding free-energy of ligands 1 and 3, Figure 7, cycle C. From the GCAP simulations, we are able to ascertain the equilibrium water occupancy of each ligand and the relative binding free energy of the two ligands. 2D-GCAP is also able to calculate the binding free energies of those waters.
A2A
As before with SD, a free energy cycle between three A2A ligands has been tested using the 1D- and 2D-GCAP methodologies. With SD, a particular known water site of interest was chosen as the focused GCMC region. With A2A, no water molecules are present in either of the two available crystal structures, although previous computational studies have highlighted hydration sites near rings A and B, that can vary between different ligands. A2A ligands were treated as if no prior information were available, and a GCMC region was chosen to cover the active site cavity near ring A and the sites of alchemical perturbation, shown in Figure 4. The GCMC region is ∼8 times larger than for SD, and the number of water sites encapsulated in this region is higher than for the single water case of SD.
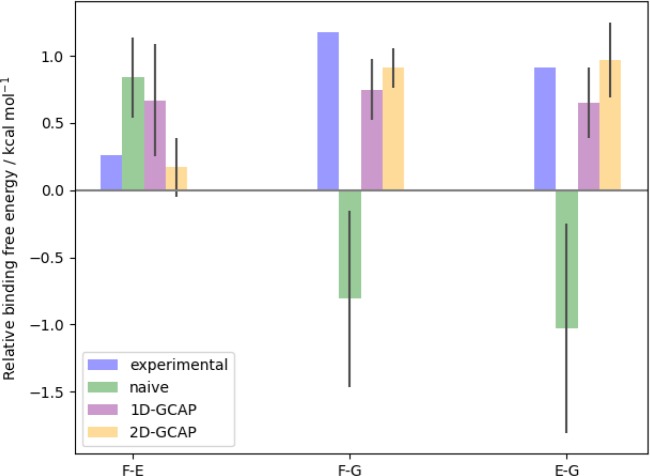
The relative binding free energies of the pairs of ligands have been calculated using both 1D- and 2D-GCAP, Figure 9. Both methods correctly rank order the ligands, with 2D-GCAP results producing better experimental agreement, and smaller standard errors for all legs. The thermodynamic cycles for these calculations are shown in Figure 10. In contrast to this, the relative free energies have also been calculated using a naïve solvation — where the water molecules have been placed in the system using default set up tools based on available pocket volume, and simulated with an NVT ensemble, Figure 9. The naïve solvation places three waters within the GCMC region, illustrated in Figure S.2. Where the GCAP methods were able to rank order the ligands, the naïve calculations do not. This shows the errors that can occur if relative binding free energies are calculated without proper consideration of the effect of the perturbation on the active site water network. The difference between the naïve cycle and the GCAP cycles is that no assumption has been made about the network of water molecules in the region of the ligand perturbation. The grand canonical ensemble allows the region to be dynamically solvated, and adaptively change as the ligand perturbs. This also allows us to predict the hydration sites for the various ligands, shown in Figure 11. As there are no available crystallographic water molecules, these cannot be experimentally validated.
Figure 9.
Relative binding free energies of A2A ligand pairs in kcal·mol–1. Results shown are experimental (blue), naïve (green) 1D-GCAP (purple) and 2D-GCAP (orange). Error bars shown are standard errors from three repeats of each leg.
Figure 10.
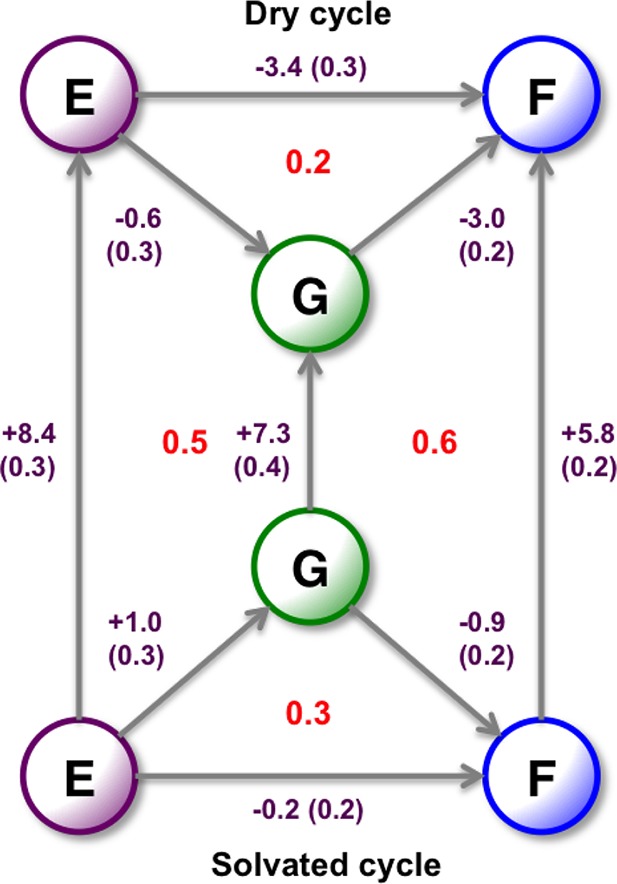
Relative binding free energies of the three A2A ligands in kcal·mol–1. All results are calculated from the 2D-GCAP simulations. The dry cycle is calculated from using MBAR at B−Beq = −8, where the GCMC region is free of water molecules. The solvated cycle is calculated using MBAR on the whole surface, where the ligands will be correctly hydrated, Figure 11. The vertical legs are the free energy of the GCMC water networks, calculated using GCI at the λ end points of the surface. Standard errors are shown, calculated from three repeats for ligand perturbations and six repeats for water network calculations. Thermodynamic cycle closure is shown in red.
Figure 11.
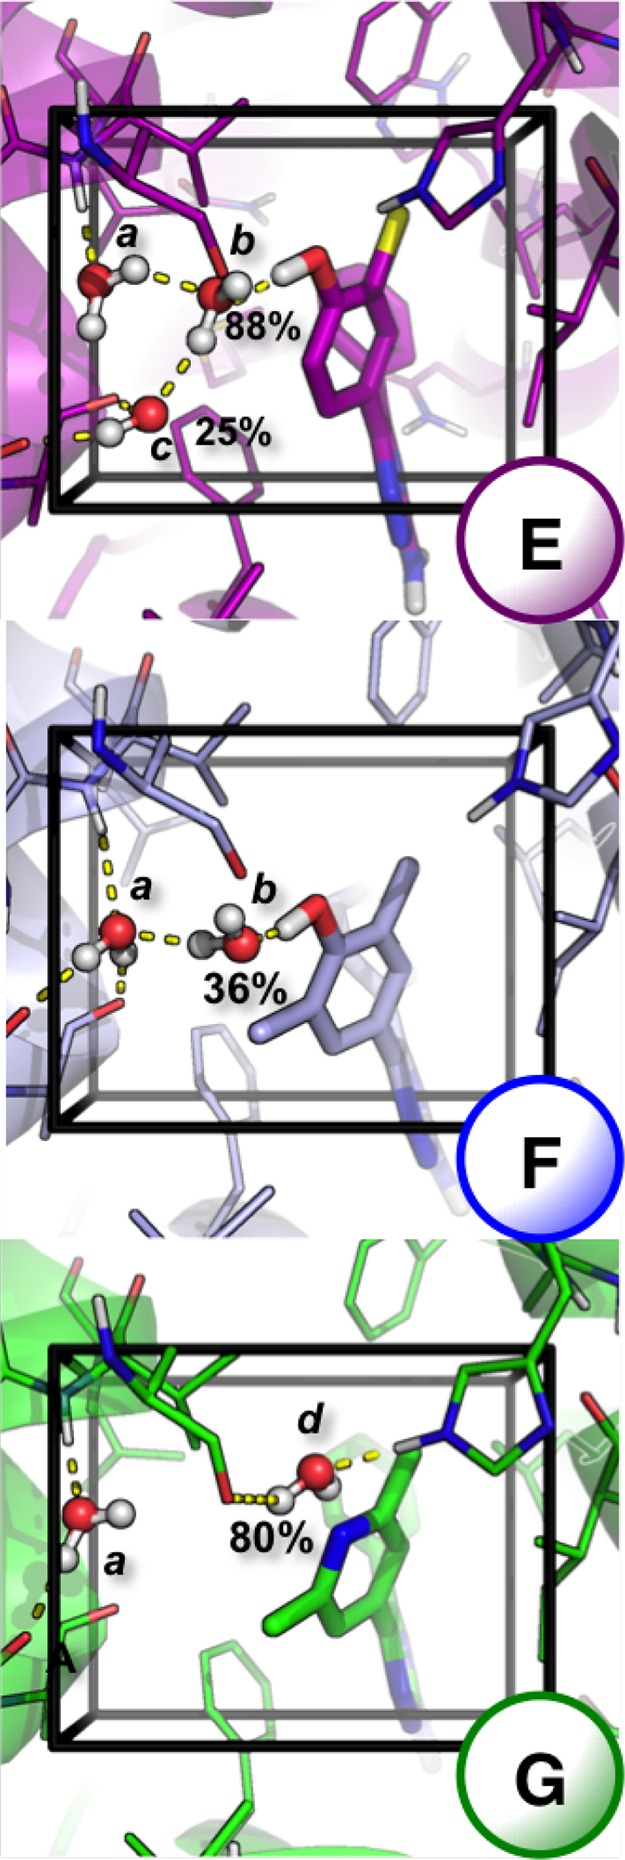
GCMC water locations top to bottom for ligands E (purple), F (light blue), and G (green) shown as sticks. Additional water sites are observed for all three ligands, in the lower, right region of the GCMC box, but as they are unperturbed by changes to the ligand they have been excluded for clarity, shown in Figure S.3. Protein is represented as a cartoon, with residues shown as lines. Carbon atoms are colored per ligand, with oxygen (red), nitrogen (dark blue), chlorine (yellow), and hydrogen (white). Any nonpolar hydrogen atoms are removed for clarity. Hydrogen bonding (yellow dash) interactions are shown, determined using pymol.55 GCMC hydration sites have been labeled a – d, with water occupancies labeled for waters that are present <95% of the simulation. Water locations have been calculated by clustering,48 and a representative snapshot of the simulation is shown that represents the cluster centers.
The clustered water locations at equilibrium (Beq), and their occupancies are shown for all three ligands in Figure 11, labeled a−d, with hydrogen bonding contacts shown with yellow dashed lines, determined using pymol55 for GCMC cluster sites with >10% occupancy. Water site a is deep in the pocket and is stable and conserved for all three ligands. For ligands E and F, a water molecule b is able to bridge between their hydroxy group and the water site a. Water site b is 88% occupied for ligand E but is only observed in 36% of the simulation with ligand F. With ligand E, as water site b is more stable, a third site, water c is observed in 25% of the simulation. This water is able to form two donating hydrogen bonds with backbone carbonyl groups. With ligand G, the substituted phenyl group of ligands E and F is replaced with a substituted pyridine group. The conserved water site a is observed, in addition to water site d, which was not observed with ligands E or F. Water site d bridges between two protein residues, rather than directly hydrogen bonding with the pyridine group. Some partially occupied hydration sites distal to the aromatic substitutions have been excluded for clarity, but these, along with the density of water molecules within the region, are illustrated in Figure S.3.
As 2D-GCAP is performed at a range of B values, it is possible to calculate additional free energy contributions, of the relative ligand binding free energy to the dry pocket, and the free energies of the water networks. From the 2D-GCAP simulations, the binding free energy of the water network with each of the ligands can be calculated using the GCI Equation where λ is 0 or 1. This has been calculated for each of the ligands and is shown as vertical legs in Figure 10. This shows that ligand E has the most tightly bound water network, followed by ligand G, while ligand F has the least tightly bound water network, despite being the highest affinity ligand. From 2D-GCAP simulations, it is also possible to calculate the relative free energy of the ligands in a dry pocket by performing one-dimensional (1D) MBAR along the lowest B value, where the GCMC region has an average water occupancy of zero (B−Beq = −8). This dry free energy cycle is shown in Figure 10, and while it is not intended to reproduce the experimental results, it can be useful—along with the water network binding free energies—for understanding from where the various energetic contributions arise.
Ligands F–G
The ligands F and G have the largest difference in affinity. As the relative hydration free energy of the two ligands is effectively zero, Table S.4, the difference in affinities arises from active site interactions. The GCAP simulations are able to show that the perturbation from ligand F to ligand G results in the loss of low-occupied water site b and the introduction of water site d as the hydroxyl group is removed. The water network with ligand G is 1.5 kcal·mol–1 more stable than with ligand F. This insight, provided by 2D-GCAP, suggests that the high affinity of ligand F is predominantly due to the protein–ligand complementarity, rather than water stabilization. This is illustrated by the dry leg affording a relative binding free energy of 3.0 kcal·mol–1.
Ligands F–E
The difference between ligands E and F is the substitutions at the meta position. The alchemical perturbation that removes the methyl group close to water site b results in the stabilization of the water site, and its occupancy increases from 36% to 88% across the alchemical pathway. This stabilizes an additional water site, water c, which is in turn 25% occupied when ligand E is bound. The changes to sites b and c correspond to a 2.6 kcal·mol–1 favorable stabilization of the water network. The relative free energy of the ligands when the pocket is dry is +3.4 (0.3) kcal·mol–1, which shows that the strong interactions of ligand F to the pocket directly are mostly compensated by the increased stability of the water network with ligand E. While the relative free energy of the perturbation can be determined from the 1D-GCAP simulation, the 2D-GCAP simulation in addition allows the binding free energies of the water network and the dry simulation to be calculated, providing deeper understanding of the energetics and stability of the different systems. Figure 9 shows that the E to F perturbation is also most improved by 2D-GCAP, relative to 1D-GCAP. This may be because the difference in stability of the two ligands’ water networks is the largest in the set.
Ligands E–G
As the perturbation from ligand E to ligand G involves both the addition and removal of functional groups, it has been performed in two steps, via the intermediate, where the C–OH group of ligand E has been perturbed to a N atom, but the meta groups are unchanged, shown in Figure S.1. This perturbation from ligand E to G results in the loss of water sites b and c, and the introduction of water site d, corresponding to a loss in water network binding affinity of 1.1 kcal·mol–1. The relative ligand binding affinity of the dry leg finds that ligand G is more tightly bound than E by 0.6 kcal·mol–1; however, as the water network is able to better stabilize ligand E, ligand E is 1.0 kcal·mol–1 more tightly bound than ligand G when solvated.
For the three ligands considered for A2A, the GCAP methodologies are able to correctly reproduce the experimental relative binding free energies to within 1 kcal·mol–1 accuracy, while also determining the locations of the water molecules proximal to ring A. Attempting to calculate these relative free energies by naïvely solvating the system results in poor experimental agreement, with the lowest affinity ligand, ligand G, calculated as having the highest affinity. The starting locations of the water locations of the naïve simulations are shown in Figure S.2 and indicate a water close to water site d, that is observed with ligand G but not with ligands E or F. This coincidental similarity in the position of water d could explain why ligand G is predicted to be the most stable ligand in the naïve set of simulations. With ligands E and F, a water is not predicted in this location with the GCAP methods and is kinetically trapped from diffusing out of the pocket. Using the GCMC methodology, whereby water molecules are located on the fly throughout the simulation, means that there is no assumption of the number or location of water molecules within the region of interest. This allows for ligands with different active site water networks to be simulated directly. Although 1D-GCAP is computationally cheaper than 2D-GCAP, the surface simulations provide smaller errors, better thermodynamic closure, and better experimental agreement. In addition, simulating the whole surface through using a range of B values not only allows the stability of the water networks to be determined, by using GCI at a set λ value, but also the relative free energy of the ligands at a given level of hydration to be calculated, by using 1D MBAR along λ for a set B value. This information allows the energetic contributions from the water network to be decomposed. However, this additional information comes at computational cost, proportional to the number of additional B values simulated.
Conclusion
Issues arise in relative protein–ligand binding free energy calculations in cases where water molecules become trapped in the protein binding site. This can occur where the ligands considered have differing active site water networks. Conventional alchemical perturbation methods do not always cope with this situation, particularly in occluded pockets, where exchange with bulk water may be prevented within a feasible time scale due to kinetic barriers. GCMC has been developed to determine both active site water locations and water network free energies, all within a single series of simple to perform simulations.29,30 In this paper, GCMC has been combined with MBAR to achieve dynamic adaptation of water networks with relative protein–ligand binding free energy calculations. Two protocols have been presented; low-cost 1D-GCAP that simulates only at Beq, thereby ensuring equilibrium with bulk water, and high-precision 2D-GCAP that simulates at a range of B values. Using 2D-GCAP it is possible to calculate relative binding affinities between ligands at a chosen level of hydration, as well as isolate the contribution that the displacement, or rearrangement, of a water network has on the relative affinity. Thus, not only are robust, reproducible protein–ligand binding free energies produced, but the associated changes in water network in the binding site are observed. Moreover we have demonstrated the decomposition of the protein ligand free energies into terms related directly to protein–ligand interactions and, separately, to water stabilization. We have shown with two protein ligand systems that this can produce experimentally consistent affinities, useful for drug design, and usefully rationalize Structure Activity Relationships. We anticipate that this methodology will prove a powerful tool in structure based drug design.
Acknowledgments
We acknowledge iSolution at the University of Southampton for computing time on the Iridis 4 and Iridis 5 clusters.
Supporting Information Available
The Supporting Information is available free of charge on the ACS Publications website at DOI: 10.1021/acs.jctc.8b00614.
Further details of the simulation protocols; relative hydration free energies of all ligands for SD and A2A. Details of the naïve solvation protocol used for A2A and the initial water locations for these simulations. All GCMC water positions observed, GCMC cluster centers, and associated density for A2A are shown. Figures of all of the relative protein–ligand binding free energies calculated by 2D-GCAP for both electrostatic and van der Waals simulations. Results for the simulation with δ protonated active site residue His278 (PDF)
The authors thank the EPSRC and NIH for funding. HBM is supported by the EPSRC funded CDT in Theory and Modelling in Chemical Sciences, under grant EP/L015722/1. CCA is supported by an EPSRC Doctoral Training Centre grant EP/G03690X/1. GAR is supported by the EPSRC grant EP/J010189/1. JWE holds a Royal Society Wolfson Research Merit Award.
G.A.R. is currently employed by Schrödinger, LLC.
Supplementary Material
References
- Huggins D. J.; Sherman W.; Tidor B. Rational approaches to improving selectivity in drug design. J. Med. Chem. 2012, 55, 1424–1444. 10.1021/jm2010332. [DOI] [PMC free article] [PubMed] [Google Scholar]
- Barillari C.; Taylor J.; Viner R.; Essex J. W. Classification of Water Molecules in Protein Binding Sites. J. Am. Chem. Soc. 2007, 129, 2577–2587. 10.1021/ja066980q. [DOI] [PubMed] [Google Scholar]
- Lam P. Y.; Jadhav P. K.; Eyermann C. J.; Hodge C. N.; Ru Y.; Bacheler L. T.; Meek J. L.; Otto M. J.; Rayner M. M.; Wong Y. N. Rational design of potent, bioavailable, nonpeptide cyclic ureas as HIV protease inhibitors. Science 1994, 263, 380–384. 10.1126/science.8278812. [DOI] [PubMed] [Google Scholar]
- Wong S. E.; Lightstone F. C. Accounting for water molecules in drug design. Expert Opin. Drug Discovery 2011, 6, 65–74. 10.1517/17460441.2011.534452. [DOI] [PubMed] [Google Scholar]
- Pitt W. R.; Murray-Rust J.; Goodfellow J. M. AQUARIUS2: Knowledge-based modeling of solvent sites around proteins. J. Comput. Chem. 1993, 14, 1007–1018. 10.1002/jcc.540140902. [DOI] [Google Scholar]
- Imai T.; Kovalenko A.; Hirata F. Solvation thermodynamics of protein studied by the 3D-RISM theory. Chem. Phys. Lett. 2004, 395, 1–6. 10.1016/j.cplett.2004.06.140. [DOI] [Google Scholar]
- Nguyen C. N.; Young T. K.; Gilson M. K. Grid inhomogeneous solvation theory: hydration structure and thermodynamics of the miniature receptor cucurbit[7]uril. J. Chem. Phys. 2012, 137, 044101 10.1063/1.4733951. [DOI] [PMC free article] [PubMed] [Google Scholar]
- García-Sosa A. T. Hydration Properties of Ligands and Drugs in Protein Binding Sites: Tightly-Bound, Bridging Water Molecules and Their Effects and Consequences on Molecular Design Strategies. J. Chem. Inf. Model. 2013, 53, 1388–1405. 10.1021/ci3005786. [DOI] [PubMed] [Google Scholar]
- Bodnarchuk M. S.; Viner R.; Michel J.; Essex J. W. Strategies to Calculate Water Binding Free Energies in Protein-Ligand Complexes. J. Chem. Inf. Model. 2014, 54, 1623–1633. 10.1021/ci400674k. [DOI] [PubMed] [Google Scholar]
- Cappel D.; Sherman W.; Beuming T. Calculating Water Thermodynamics in the Binding Site of Proteins - Applications of WaterMap to Drug Discovery. Curr. Top. Med. Chem. 2017, 17, 2586–2598. 10.2174/1568026617666170414141452. [DOI] [PubMed] [Google Scholar]
- Young T.; Abel R.; Kim B.; Berne B. J.; Friesner R. A. Motifs for molecular recognition exploiting hydrophobic enclosure in protein-ligand binding. Proc. Natl. Acad. Sci. U. S. A. 2007, 104, 808–813. 10.1073/pnas.0610202104. [DOI] [PMC free article] [PubMed] [Google Scholar]
- Abel R.; Young T.; Farid R.; Berne B. J.; Friesner R. A. Role of the Active-Site Solvent in the Thermodynamics of Factor Xa Ligand Binding. J. Am. Chem. Soc. 2008, 130, 2817–2831. 10.1021/ja0771033. [DOI] [PMC free article] [PubMed] [Google Scholar]
- Ladbury J. E. Just add water! The effect of water on the specificity of protein-ligand binding sites and its potential application to drug design. Chem. Biol. 1996, 3, 973–980. 10.1016/S1074-5521(96)90164-7. [DOI] [PubMed] [Google Scholar]
- Michel J.; Tirado-Rives J.; Jorgensen W. L. Prediction of the Water Content in Protein Binding Sites. J. Phys. Chem. B 2009, 113, 13337–13346. 10.1021/jp9047456. [DOI] [PMC free article] [PubMed] [Google Scholar]
- Bodnarchuk M. S. Water, water, everywhere...It’s time to stop and think. Drug Discovery Today 2016, 21, 1139–1146. 10.1016/j.drudis.2016.05.009. [DOI] [PubMed] [Google Scholar]
- Haider K.; Cruz A.; Ramsey S.; Gilson M. K.; Kurtzman T. Solvation Structure and Thermodynamic Mapping (SSTMap): An Open-Source, Flexible Package for the Analysis ofWater in Molecular Dynamics Trajectories. J. Chem. Theory Comput. 2018, 14, 418–425. 10.1021/acs.jctc.7b00592. [DOI] [PMC free article] [PubMed] [Google Scholar]
- Pal R. K.; Haider K.; Kaur D.; Flynn W.; Xia J.; Levy R. M.; Taran T.; Wickstrom L.; Kurtzman T.; Gallicchio E. A combined treatment of hydration and dynamical effects for the modeling of host-guest binding thermodynamics: the SAMPL5 blinded challenge. J. Comput.-Aided Mol. Des. 2017, 31, 29–44. 10.1007/s10822-016-9956-6. [DOI] [PMC free article] [PubMed] [Google Scholar]
- Woo H.-J.; Dinner A. R.; Roux B. Grand canonical Monte Carlo simulations of water in protein environments. J. Chem. Phys. 2004, 121, 6392–6400. 10.1063/1.1784436. [DOI] [PubMed] [Google Scholar]
- García-Sosa A. T.; Mancera R. L.; Dean P. M. WaterScore: a novel method for distinguishing between bound and displaceable water molecules in the crystal structure of the binding site of protein-ligand complexes. J. Mol. Model. 2003, 9, 172–182. 10.1007/s00894-003-0129-x. [DOI] [PubMed] [Google Scholar]
- Ross G. A.; Morris G. M.; Biggin P. C. Rapid and Accurate Prediction and Scoring of Water Molecules in Protein Binding Sites. PLoS One 2012, 7, e32036+ 10.1371/journal.pone.0032036. [DOI] [PMC free article] [PubMed] [Google Scholar]
- Nucci N. V.; Pometun M. S.; Wand A. J. Site-resolved measurement of water-protein interactions by solution NMR. Nat. Struct. Mol. Biol. 2011, 18, 245–249. 10.1038/nsmb.1955. [DOI] [PMC free article] [PubMed] [Google Scholar]
- Ernst J. A.; Clubb R. T.; Zhou H. X.; Gronenborn A. M.; Clore G. M. Demonstration of positionally disordered water within a protein hydrophobic cavity by NMR. Science 1995, 267, 1813–1817. 10.1126/science.7892604. [DOI] [PubMed] [Google Scholar]
- Jukič M.; Konc J.; Gobec S.; Janežič D. Identification of Conserved Water Sites in Protein Structures for Drug Design. J. Chem. Inf. Model. 2017, 57, 3094–3103. 10.1021/acs.jcim.7b00443. [DOI] [PubMed] [Google Scholar]
- Patel H.; Grüning B. A.; Günther S.; Merfort I. PyWATER: a PyMOL plug-in to find conserved water molecules in proteins by clustering. Bioinformatics 2014, 30, 2978–2980. 10.1093/bioinformatics/btu424. [DOI] [PubMed] [Google Scholar]
- Joosten R. P.; Long F.; Murshudov G. N.; Perrakis A. The PDB_REDO server for macromolecular structure model optimization. IUCrJ 2014, 1, 213–220. 10.1107/S2052252514009324. [DOI] [PMC free article] [PubMed] [Google Scholar]
- Syme N. R.; Dennis C.; Bronowska A.; Paesen G. C.; Homans S. W. Comparison of Entropic Contributions to Binding in a Hydrophilic versus Hydrophobic Ligand-Protein Interaction. J. Am. Chem. Soc. 2010, 132, 8682–8689. 10.1021/ja101362u. [DOI] [PMC free article] [PubMed] [Google Scholar]
- Gilson M. K.; Given J. A.; Bush B. L.; McCammon J. A. The statistical thermodynamic basis for computation of binding affinities: a critical review. Biophys. J. 1997, 72, 1047–1069. 10.1016/S0006-3495(97)78756-3. [DOI] [PMC free article] [PubMed] [Google Scholar]
- Mobley D. L.; Chodera J. D.; Dill K. A. On the use of orientational restraints and symmetry corrections in alchemical free energy calculations. J. Chem. Phys. 2006, 125, 084902 10.1063/1.2221683. [DOI] [PMC free article] [PubMed] [Google Scholar]
- Ross G. A.; Bodnarchuk M. S.; Essex J. W. Water Sites, Networks, And Free Energies with Grand Canonical Monte Carlo. J. Am. Chem. Soc. 2015, 137, 14930–14943. 10.1021/jacs.5b07940. [DOI] [PubMed] [Google Scholar]
- Ross G. A.; Bruce Macdonald H. E.; Cave-Ayland C.; Cabedo Martinez A. I.; Essex J. W. Replica-Exchange and Standard State Binding Free Energies with Grand Canonical Monte Carlo. J. Chem. Theory Comput. 2017, 13, 6373–6381. 10.1021/acs.jctc.7b00738. [DOI] [PMC free article] [PubMed] [Google Scholar]
- Adams D. J. Chemical potential of hard-sphere fluids by Monte Carlo methods. Mol. Phys. 1974, 28, 1241–1252. 10.1080/00268977400102551. [DOI] [Google Scholar]
- Adams D. J. Grand canonical ensemble Monte Carlo for a Lennard-Jones fluid. Mol. Phys. 1975, 29, 307–311. 10.1080/00268977500100221. [DOI] [Google Scholar]
- Ben-Naim A.; Marcus Y. Solvation thermodynamics of nonionic solutes. J. Chem. Phys. 1984, 81, 2016–2027. 10.1063/1.447824. [DOI] [Google Scholar]
- Jorgensen W. L.; Chandrasekhar J.; Madura J. D.; Impey R. W.; Klein M. L. Comparison of simple potential functions for simulating liquid water. J. Chem. Phys. 1983, 79, 926–935. 10.1063/1.445869. [DOI] [Google Scholar]
- Aldeghi M.; Ross G. A.; Bodkin M. J.; Essex J. W.; Knapp S.; Biggin P. C. Largescale analysis of water stability in bromodomain binding pockets with grand canonical Monte Carlo. ChemComm 2018, 1, 19. 10.1038/s42004-018-0019-x. [DOI] [PMC free article] [PubMed] [Google Scholar]
- Cournia Z.; Allen B.; Sherman W. Relative Binding Free Energy Calculations in Drug Discovery: Recent Advances and Practical Considerations. J. Chem. Inf. Model. 2017, 57, 2911–2937. 10.1021/acs.jcim.7b00564. [DOI] [PubMed] [Google Scholar]
- Loeffler H. H.; Bosisio S.; Matos G. D. R.; Suh D.; Roux B.; Mobley D. L.; Michel J.. Reproducibility of Free Energy Calculations across Different Molecular Simulation Software Packages. J. Chem. Theory Comput. 10.1021/acs.jctc.8b00544, Article ASAP. [DOI] [PubMed] [Google Scholar]
- Michel J.; Verdonk M. L.; Essex J. W. Protein-Ligand Complexes: Computation of the Relative Free Energy of Different Scaffolds and Binding Modes. J. Chem. Theory Comput. 2007, 3, 1645–1655. 10.1021/ct700081t. [DOI] [PubMed] [Google Scholar]
- Michel J.; Tirado-Rives J.; Jorgensen W. L. Energetics of Displacing Water Molecules from Protein Binding Sites: Consequences for Ligand Optimization. J. Am. Chem. Soc. 2009, 131, 15403–15411. 10.1021/ja906058w. [DOI] [PMC free article] [PubMed] [Google Scholar]
- Deng Y.; Roux B.. Computation of binding free energy with molecular dynamics and grand canonical Monte Carlo simulations. J. Chem. Phys. 2008, 128, 115103. 10.1063/1.2842080 [DOI] [PubMed] [Google Scholar]
- Bennett C. H. Efficient estimation of free energy differences from Monte Carlo data. J. Comput. Phys. 1976, 22, 245–268. 10.1016/0021-9991(76)90078-4. [DOI] [Google Scholar]
- Shirts M. R.; Chodera J. D. Statistically optimal analysis of samples from multiple equilibrium states. J. Chem. Phys. 2008, 129, 124105. 10.1063/1.2978177. [DOI] [PMC free article] [PubMed] [Google Scholar]
- Woods C. J.; Essex J. W.; King M. A. The Development of Replica-Exchange-Based Free-Energy Methods. J. Phys. Chem. B 2003, 107, 13703–13710. 10.1021/jp0356620. [DOI] [Google Scholar]
- Woods C. J.; Essex J. W.; King M. A. Enhanced configurational sampling in binding free-energy calculations. J. Phys. Chem. B 2003, 107, 13711–13718. 10.1021/jp036162+. [DOI] [Google Scholar]
- Chen J. M.; Xu S. L.; Wawrzak Z.; Basarab G. S.; Jordan D. B. Structure-Based Design of Potent Inhibitors of Scytalone Dehydratase: Displacement of a Water Molecule from the Active Site. Biochemistry 1998, 37, 17735–17744. 10.1021/bi981848r. [DOI] [PubMed] [Google Scholar]
- Lundqvist T.; Rice J.; Hodge; Basarab G. S.; Pierce J.; Lindqvist Y. Crystal structure of scytalone dehydratase disease determinant of the rice pathogen, Magnaporthe grisea. Structure 1994, 2, 937–944. 10.1016/S0969-2126(94)00095-6. [DOI] [PubMed] [Google Scholar]
- Congreve M.; Andrews S. P.; Doré A. S.; Hollenstein K.; Hurrell E.; Langmead C. J.; Mason J. S.; Ng I. W.; Tehan B.; Zhukov A.; Weir M.; Marshall F. H. Discovery of 1,2,4-triazine derivatives as adenosine A(2A) antagonists using structure based drug design. J. Med. Chem. 2012, 55, 1898–1903. 10.1021/jm201376w. [DOI] [PMC free article] [PubMed] [Google Scholar]
- ProtoMS 3.4.0. 2018; www.protoms.org.
- Chen V. B.; Arendall W. B.; Headd J. J.; Keedy D. A.; Immormino R. M.; Kapral G. J.; Murray L. W.; Richardson J. S.; Richardson D. C. MolProbity: all-atom structure validation for macromolecular crystallography. Acta Crystallogr., Sect. D: Biol. Crystallogr. 2010, 66, 12–21. 10.1107/S0907444909042073. [DOI] [PMC free article] [PubMed] [Google Scholar]
- Schrödinger Release 2018-1: Maestro, Schrödinger, LLC, New York, NY. 2018.
- Saunders G. M.; Bruce Macdonald H. E.; Essex J. W.; Khalid S. Prediction of the closed conformation and insights into the mechanism of the membrane enzyme LpxR. Biophys. J. 2018, 115, 1–12. 10.1016/j.bpj.2018.09.002. [DOI] [PMC free article] [PubMed] [Google Scholar]
- Maier J. A.; Martinez C.; Kasavajhala K.; Wickstrom L.; Hauser K. E.; Simmerling C. ff14SB: Improving the Accuracy of Protein Side Chain and Backbone Parameters from ff99SB. J. Chem. Theory Comput. 2015, 11, 3696–3713. 10.1021/acs.jctc.5b00255. [DOI] [PMC free article] [PubMed] [Google Scholar]
- Bortolato A.; Tehan B. G.; Bodnarchuk M. S.; Essex J. W.; Mason J. S. Water Network Perturbation in Ligand Binding: Adenosine A2A Antagonists as a Case Study. J. Chem. Inf. Model. 2013, 53, 1700–1713. 10.1021/ci4001458. [DOI] [PubMed] [Google Scholar]
- Zia S. R.; Gaspari R.; Decherchi S.; Rocchia W. Probing Hydration Patterns in Class-A GPCRs via Biased MD: The A2A Receptor. J. Chem. Theory Comput. 2016, 12, 6049–6061. 10.1021/acs.jctc.6b00475. [DOI] [PubMed] [Google Scholar]
- The PyMOL Molecular Graphics System, Version 2.0; Schrödinger, LLC, 2018.
Associated Data
This section collects any data citations, data availability statements, or supplementary materials included in this article.


