

Abstract
Background:
Media forms an important part of the lives of adolescents in as much as the shows they watch on television, playing video games, as well as visiting the various websites. There is a growing concern of the influence of media on every aspect of health of children and adolescents. About 95% of the population in India has availability of television. India has limited studies which have explored the use of screen-based media (SBM) and its effect on child health. This study was conducted to assess the pattern of SBM use.
Methods:
A community-based cross-sectional study was conducted in an Urban Resettlement Colony, New Delhi. The study included 550 adolescents of age group from 10 to 19 years of age selected through simple random sampling from a list of adolescents residing in the area. A semi-structured interview schedule was used.
Results:
About 98% of the adolescents used SBM. Television formed the maximum used media (96.5%). The mean (standard deviation) of the screen time was found to be 3.8 (2.77) h/day. Out of the total screen time, time contributed by television is 2.8 h/day followed by other SBM. About 68% of adolescents reported having screen time more than the recommended (>2 h). Significant association was observed between screen time and watching television while eating [odds ratio (95% confidence interval) = 0.35 (0.22, 0.55)].
Conclusion:
High proportion of adolescents use SBM for more than the recommended screen time. We should have a recommendation for maximum screen time separately for developing countries.
Keywords: Adolescents, India, screen-based media, screen time
Introduction
Media forms an important part of the life of adolescents as they are engaged in watching television, playing video games, as well as visiting the various websites.[21] Among the media, television is indispensable in the present world. There is a growing concern of the influence of both old media (television) and new media (smartphones, desktop, tablets, game consoles) on every aspect of health of children and adolescents.
Screen time (ST), that is, the time spent in sedentary behaviors involving screen-based media (SBM) like watching television, playing games, and using computer and smartphones, as recommended by the American Academy of Pediatrics, is not more than 2 h/day for all age group above 2 years.[1] Research work has shown that children and adolescent spent maximum amount of time in a day with media, apart from sleeping, an average of which has been found to be 7 h/day.[21]
Media offers the viewers with wide variations of entertainment which has been seen to have a negative impact on the adolescents. Advertisements on electronic media have their impact on the nutritional quality of foods consumed by adolescents. In addition, increased time spent on electronic media takes away the time that could have been spent on physical activity. These two factors increase the chances of obesity among adolescents. Intervention at an early stage is more likely to prevent development of obesity later.[7,11]
There is an increasing concern of independent association of screen time with mental health among adolescents.[10] Over the past decades, a shift has been noted toward poorer sleep among adolescents, such as late bed time,[18] long sleep onset latency, and short sleep duration of approximately 6.5 h on weekdays.[9] A prospective study in India showed an association between television viewing and increased incidence of sleep disturbances.[6]
It is beneficial to identify the population at highest risk of developing sedentary behavior which leads to adverse outcomes in later life. Thus, we need to understand the correlates of increased screen viewing time and how do these differ with participant characteristics. Apart from sociodemographic variables, modifiable environmental and sociocultural variables need to assessed to help in future interventions.[2]
The scenario in India is not very different from other countries which are undergoing electronic boom. About 95% of the population in India has availability of television which has become a major source of leisure activities among children. However, India has limited studies which have explored the use of various SBM and its effect on child health. Information from developed nations may not be applicable to countries under going economic and social transition. There is a need to look into local data to ascertain the correlates of screen time.
The purpose of this study was to assess the prevalence of SBM use and the proportion of adolescents with screen times more than recommended, and to get an insight into the factors affecting screen time use in urban adolescents.
Methods
A community-based cross-sectional study was conducted in an Urban Resettlement Colony, Dakshinpuri Extension, New Delhi, which is the field practice area of the Centre for Community Medicine, All India Institute of Medical Sciences, New Delhi.
The sample size was calculated considering 30%[14] as the prevalence of adolescents who have screen time more than the recommended screen time of less than 2 h. Using this value, with the absolute precision of 4, and 10% nonresponse, the sample size was calculated and rounded off to 600. A total of 600 adolescents were selected by simple random sampling from the population of 3526 adolescents in the area. Adolescents residing in the area for past 6 months were included in the study. Very sick adolescents and those unable to comprehend the questionnaire were excluded from the study. The study was started during the month of May when the schools were closed for summer vacation. Two-third of the adolescents were approached during the vacation, and the rest were interviewed after the school reopened. There was no refusal from the study sample. Fifty adolescents could not be interviewed as their houses were locked on three occasions. Among the 50 adolescents who could not be interviewed, 29 were females and 21 were males. The response rate for the interview was 91.7%.
House-to-house survey was conducted. If the adolescent was unavailable at the first visit, two more visits were made. If the adolescent could not be interviewed by the third visit, he or she was considered a nonrespondent. The adolescents and their parents were explained the outline of the study. The questions put forward by the parents and adolescents were duly answered and their doubts cleared.
SBM in the study included watching television, playing video games, and using smartphones, tablet devices, desktop, and laptop. Old media has been used for television and new media comprised smartphones, tablet devices, computers, laptops, and gaming console. Screen time is the time spent using the various SBM.
A self-reported interview was conducted from pretested, semi-structured interview schedule. The interview focused on information regarding age, sex, and family environment including the number of siblings, number of family members, and number of rooms in the home. Education and occupation of both the parents were also included. Consumption of fast food and soft drinks in the previous 1 week from the day of the interview was enquired and their self-perception of their weights was recorded.
SBM use and screen time: SBM ownership and use was assessed by enquiring the presence of desktop, television, mobile phones, tablet devices, and laptop at home.
The adolescents were asked the time they spent on watching television and using other SBM on a typical weekday and a typical week end day during the week prior to the day of the interview. Time spent on the activities which the adolescents engage while using the SBM was also assessed. The various activities included were playing video games, emailing, WhatsApp, Facebook, web search, and online shopping.
Statistical analysis
Data were entered using Epi Info version 7.1, and statistical analysis was done using Stata 12.0 (College Station, TX, USA).
Screen time of the weekday and the weekend day was the sum of the time spent on all the SBM. It was then weighted separately for the weekday and week end day. The average of this was taken as the screen time. Screen time = 5 × [(time spent on watching TV + time spent on mobile + time spent on tablet + time spent on computer + time spent on laptop) on weekdays] +2 × [(time spent on watching TV + time spent on mobile + time spent on tablet + time spent on computer + time spent on laptop) on week end days]/7.
The mean total screen time [95% confidence interval (CI)] was calculated. Chi-square test was done to observe association between screen time and various correlates. Selected correlates with a P-value of less than 0.2 in bivariate analysis were included in multivariate logistic regression analysis. The results were reported as odds ratio (95% CI). P-value less than 0.05 was considered statistically significant.
Ethical issues: Approval for the study was taken from the Ethics Committee of AIIMS. Informed written consent was taken from adolescents 18 years of age and above. Informed written assent was taken from adolescents less than 18 years of age and informed written consent was taken from the caretaker of the adolescents.
Results
A total of 550 adolescents participated in the study [Table 1]. The study included 57.6% of females and the remaining were males with more proportion of adolescents less than 15 years of age (62.2%). Adolescents living in a nuclear family comprised 65.8% in total, and those living with five or more family members were 73.6%. About 45% of them lived in one-bedroom houses. The maximum number of adolescents (64.3%) had three or more siblings living with them. Fathers of 72% of adolescents had completed their education up to high school, and 4% were illiterate. Illiteracy among mothers of adolescents was 23.6%. Among the parents, 2.5% of fathers were unemployed, and 81.8% of mothers were homemakers.
Table 1.
Distribution of adolescents according to demography and personal habits (n = 550%)
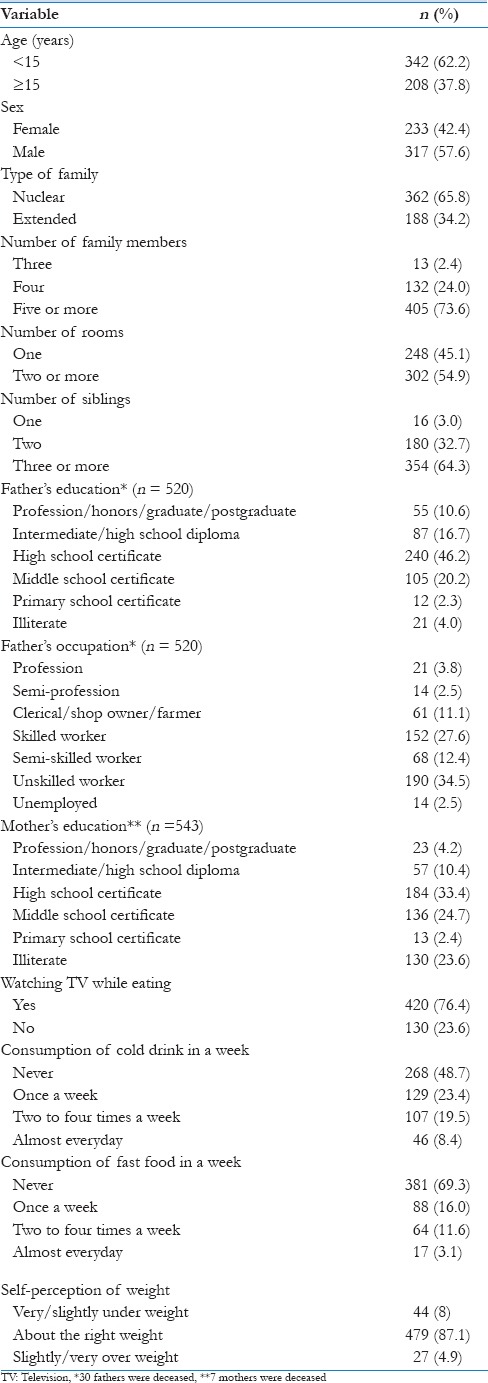
The adolescents reporting that family rules for watching television existed in their family were 22.9% compared with 77.1% of adolescents with no family rules [Table 1]. It was observed that 76.4% of adolescents were in the habit of watching television while having meals. Adolescents were enquired about the frequency of consumption of soft drinks and fast food during the previous week. About 8% and 3% of adolescents reported consumption of soft drink and fast food every day, respectively. On assessing their perception of weight, 87.1% considered it to be appropriate.
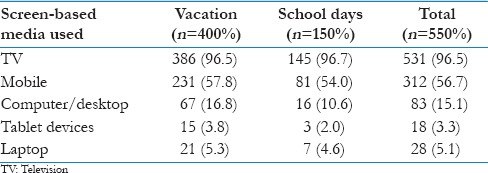
The use of SBM was assessed for vacation and school days separately. It was observed that the proportion of adolescents watching television was approximately 96% during both the periods. Use of other SBM was comparatively less during the school days than the vacation time [Table 2]. Tablet devices were the least used media among adolescents.
Table 2.
Distribution of adolescents by use of screen-based media during vacation and school days
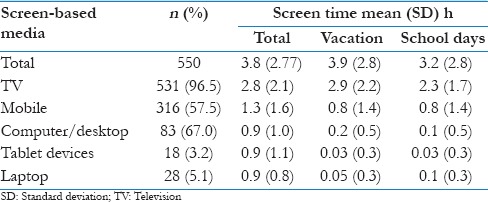
The proportion of adolescents having screen time more than 2 h was found to be 68% among the total study population. The mean (standard deviation) and median (interquartile range) of the screen time calculated for the adolescents was 3.8 (2.77) h and 3.2 (1.7, 5.2) h, respectively. Screen time for the vacation and school days was 3.9 (2.8) h and 3.2 (2.8) h, respectively [Table 3]. This shows comparatively higher screen time during the vacation days. Screen time for television showed the difference between the two periods, namely, vacation and school days [2.9 (2.2) h, 2.3 (1.7) h], respectively. However, it differed to minimum as far as other new media ST was concerned.
Table 3.
Screen time during vacation and school days
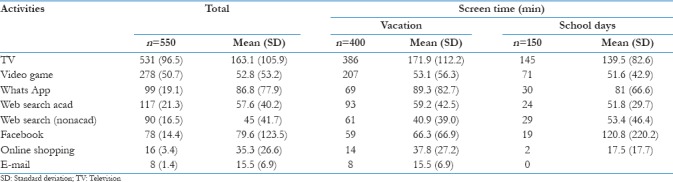
The adolescents were enquired regarding the time they spent doing various activities using the SBM. Apart from watching TV (96.5%), playing video game was the most popular activities involving the adolescents (50.7%). The least involved activity was observed to be emailing [Table 4].
Table 4.
Time spent on various activities using screen-based media during vacation and school days
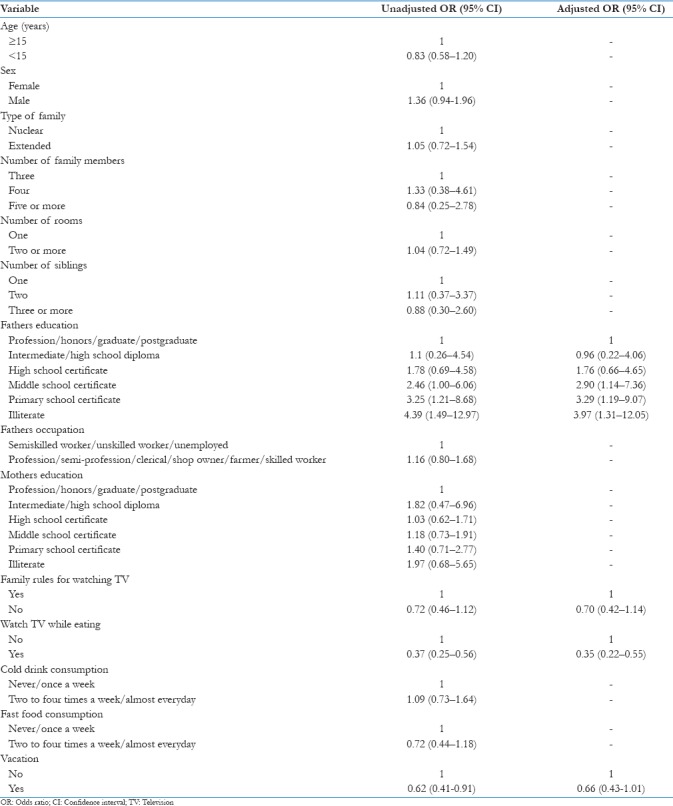
The correlates with P-value <0.2 were taken to adjust in the multivariate analysis. Table 5 shows the assessment of the correlation between screen time and various correlates. The unadjusted logistic regression showed significant association between higher screen time and watching television while eating and vacation. On adjustment with other variables, significant association was seen between screen time and watching television while eating.
Table 5.
Association between increased screen time (>2 h) and various correlates
Discussion
The study observed that 68% of adolescents engage in using SBM for more than 2 h. This is much higher than reported in previous studies in India as well as in other countries in the multicenter study done by LeBlanc et al. (31% in India, 34% in China, 45% in Canada, 59% in the United States).[14] In a recent study in China, Ye et al. showed the higher screen time to be 14.7% in boys and 8.9% in girls which is considerably lower than what has been observed in this study.[24] However, the results are comparable with those from the studies in Asia Pacific region. A study by Hysing et al. showed that 63% of adolescents in Australia use the electronic devices for over 2 h/day.[8] Lee et al. approximated the increased use of SBM to 68% by the adolescents in Malaysia.[15] A study by Khan and Burton in Bangladesh, a neighboring country of India, reported 79% of adolescents with high recreational screen time.[13] The assessment of the use of SBM and the derivation of the total screen time in the study by Khan and Burton are similar to the one adopted in this study. One of the important explanations for the high SBM usage is the increased accessibility and availability of electronic devices even in lower middle income household. The study area lacks facilities for other recreational activities for adolescents, which enforces them to stay indoors and engage in the SBM. The earlier studies in India by Reddy and Sashidha[20] and Khalil et al.[22] had observed the usage of television and no other SBM. As this study has included the new SBM also, this could be the reason for a wider coverage of the pattern of SBM use among adolescents.
The median time spent on screen-based activities by the adolescents was found to be 3.19 h/day. This was much higher than found in China in a study by Cui et al., where girls engage in 1.3 h/day and boys engage in 1.7 h/day.[4] In Malaysia, a study by Lee et al. assessed screen time to be 2.8 h/day for girls and 3.3 h/day for boys.[15] The findings of this study are similar to findings in the study by Marques et al. on Portuguese adolescents with an average screen time of 3.5 h/day for girls and 4.3 h/day for boys[16] and Australian adolescents with 3.0 h/day for girls and 4.3 h/day for boys in Straker et al.'s study.[23] This study found that boys have a longer screen time than the girls (3.0 h/day for girls and 3.4 h/day for boys), as has been seen in studies from different countries.
Age had no significant association to increased screen time in the study which is similar to a study in Chinese children and adolescents by Ye et al.[24]
Watching television was the predominant recreational screen-based activity for the adolescents participating in the study. A finding from recent Indian studies also reported watching television for 82 min per school day and 203 min per weekend day.[19] A cross-sectional study on adolescent girls in the United Kingdom had similar observations of television occupying the most of the leisure time activities, average 262.9 min per weekday and 400 min per weekend day; computer use was low.[5]
Socioeconomic status of the family of adolescents in this study did not show any significant association with screen time, analysis unlike other studies of South East Asian countries by Cao et al., Mushtaq et al., and Ravikaran et al., which showed positive association.[3,17,19] This could be due to higher use of television in the setting in which study was conducted compared to other new SBM.
In the present setting, 77% of adolescents reported that there were no family rules for watching television and equivalent percentage (76%) were in the habit of watching television while having meals. Jiang et al., in a survey in China, recorded 50% of adolescents stating the absence of family rules for watching television, and 44% reported having meals while watching television.[12] This shows higher percentage of adolescents in India who are not bound by rules for watching television, giving them opportunity to be involved with the SBM for a longer time than their counterparts who are restricted by the rules.
Previous studies by Jeffery et al. and Mushtaq et al. had shown that frequent consumption of fast food was significantly associated with high screen time.[11,17] However, this study did not show any significant association. The community setting in which the study was conducted belonged to a Resettlement Colony, and subsequently the socioeconomic status might determine the lower indulgence in fast food and cold drink.
The strength of the study was that it was a community-based study compared with most other studies conducted in India which were either school-based or hospital-based study. High response rate (91.7%) was observed in the study. An important highlight of the study was inclusion of new media along with television. Separate observations of various activities which the adolescents were involved using the SBM were also made.
However, the study had some limitations. Screen time was enquired for a typical day in the past 7 days. Instead, if the interview had included screen time for each day in a week, it would give a detailed view regarding the usage of SBM. Apart from this, it was self-reported screen time estimation by the adolescents and thereby it is vulnerable to recall bias. This may give an overestimated or underestimated picture rather than actual use. Screen time was assessed separately for the vacation and school days which adds to the differential assessment of the screen time.
Conclusion
This study showed a high proportion of adolescents using the SBM for more than the recommended screen time. However, no association was observed between the increased screen time and obesity, stress, or poor sleep quality. There is a need for further studies, preferably longitudinal, to study the impact of long-term use of SBM among adolescent. Observations in different socioeconomic strata will give a wider knowledge regarding the extent of overuse of media. Engagement of adolescents in high SBM usage calls for the need of immediate attention from the parents as well as the advocacy bodies to regulate the screen time. The ways to reduce the screen time can include starting avenues for better recreational facilities for the adolescents. Above all, we should have a recommendation for appropriate screen time for developing countries.
Financial support and sponsorship
Nil.
Conflicts of interest
There are no conflicts of interest.
References
- 1.American Academy of Pediatrics. Committee on Public Education. American Academy of Pediatrics: Children, adolescents, and television. Pediatrics. 2001;107:423–6. doi: 10.1542/peds.107.2.423. [DOI] [PubMed] [Google Scholar]
- 2.Baranowski T, Anderson C, Carmack C. Mediating variable framework in physical activity interventions. How are we doing?. How might we do better? Am J Prev Med. 1998;15:266–97. doi: 10.1016/s0749-3797(98)00080-4. [DOI] [PubMed] [Google Scholar]
- 3.Cao H, Qian Q, Weng T, Yuan C, Sun Y, Wang H, et al. Screen time, physical activity and mental health among urban adolescents in China. Prev Med. 2011;53:316–20. doi: 10.1016/j.ypmed.2011.09.002. [DOI] [PubMed] [Google Scholar]
- 4.Cui Z, Hardy LL, Dibley MJ, Bauman A. Temporal trends and recent correlates in sedentary behaviours in Chinese children. Int J Behav Nutr Phys Act. 2011;8:93. doi: 10.1186/1479-5868-8-93. [DOI] [PMC free article] [PubMed] [Google Scholar]
- 5.Gorely T, Marshall SJ, Biddle SJ, Cameron N. The prevalence of leisure time sedentary behaviour and physical activity in adolescent girls: An ecological momentary assessment approach. Int J Pediatr Obes. 2007;2:227–34. doi: 10.1080/17477160701408833. [DOI] [PubMed] [Google Scholar]
- 6.Gupta RK, Saini DP, Acharya U, Miglani N. Impact of television on children. Indian J Pediatr. 1994;61:153–9. doi: 10.1007/BF02843606. [DOI] [PubMed] [Google Scholar]
- 7.Hu FB, Li TY, Colditz GA, Willett WC, Manson JE. Television watching and other sedentary behaviors in relation to risk of obesity and type 2 diabetes mellitus in women. JAMA. 2003;289:1785–91. doi: 10.1001/jama.289.14.1785. [DOI] [PubMed] [Google Scholar]
- 8.Hysing M, Pallesen S, Stormark KM, Jakobsen R, Lundervold AJ, Sivertsen B, et al. Sleep and use of electronic devices in adolescence: Results from a large population-based study. BMJ Open. 2015;5:e006748. doi: 10.1136/bmjopen-2014-006748. [DOI] [PMC free article] [PubMed] [Google Scholar]
- 9.Hysing M, Pallesen S, Stormark KM, Lundervold AJ, Sivertsen B. Sleep patterns and insomnia among adolescents: A population-based study. J Sleep Res. 2013;22:549–56. doi: 10.1111/jsr.12055. [DOI] [PubMed] [Google Scholar]
- 10.Iannotti RJ, Kogan MD, Janssen I, Boyce WF. Patterns of adolescent physical activity, screen-based media use, and positive and negative health indicators in the U.S. and Canada. J Adolesc Health. 2009;44:493–9. doi: 10.1016/j.jadohealth.2008.10.142. [DOI] [PMC free article] [PubMed] [Google Scholar]
- 11.Jeffery RW, French SA. Epidemic obesity in the United States: Are fast foods and television viewing contributing? Am J Public Health. 1998;88:277–80. doi: 10.2105/ajph.88.2.277. [DOI] [PMC free article] [PubMed] [Google Scholar]
- 12.Jiang XX, Hardy LL, Ding D, Baur LA, Shi HJ. Recreational screen-time among Chinese adolescents: A cross-sectional study. J Epidemiol. 2014;24:397–403. doi: 10.2188/jea.JE20140006. [DOI] [PMC free article] [PubMed] [Google Scholar]
- 13.Khan A, Burton NW. Screen-based behaviors of adolescents in Bangladesh. J Phys Act Health. 2016;13:1156–63. doi: 10.1123/jpah.2015-0514. [DOI] [PubMed] [Google Scholar]
- 14.LeBlanc AG, Katzmarzyk PT, Barreira TV, Broyles ST, Chaput JP, Church TS, et al. Correlates of Total Sedentary Time and Screen Time in 9-11 Year-Old Children around the World: The International Study of Childhood Obesity, Lifestyle and the Environment. PloS One. 2015;10:e0129622. doi: 10.1371/journal.pone.0129622. [DOI] [PMC free article] [PubMed] [Google Scholar]
- 15.Lee ST, Wong JE, Shanita SN, Ismail MN, Deurenberg P, Poh BK, et al. Daily physical activity and screen time, but not other sedentary activities, are associated with measures of obesity during childhood. Int J Environ Res Public Health. 2014;12:146–61. doi: 10.3390/ijerph120100146. [DOI] [PMC free article] [PubMed] [Google Scholar]
- 16.Marques A, Sallis JF, Martins J, Diniz J, Carreiro Da Costa F. Correlates of urban children's leisure-time physical activity and sedentary behaviors during school days. Am J Hum Biol. 2014;26:407–12. doi: 10.1002/ajhb.22535. [DOI] [PubMed] [Google Scholar]
- 17.Mushtaq MU, Gull S, Mushtaq K, Shahid U, Shad MA, Akram J, et al. Dietary behaviors, physical activity and sedentary lifestyle associated with overweight and obesity, and their socio-demographic correlates, among Pakistani primary school children. Int J Behav Nutr Phys Act. 2011;8:130. doi: 10.1186/1479-5868-8-130. [DOI] [PMC free article] [PubMed] [Google Scholar]
- 18.Pallesen S, Hetland J, Sivertsen B, Samdal O, Torsheim T, Nordhus IH, et al. Time trends in sleep-onset difficulties among Norwegian adolescents: 1983–2005. Scand J Public Health. 2008;36:889–95. doi: 10.1177/1403494808095953. [DOI] [PubMed] [Google Scholar]
- 19.Ravikiran SR, Baliga BS, Jain A, Kotian MS. Factors influencing the television viewing practices of Indian children. Indian J Pediatr. 2014;81:114–9. doi: 10.1007/s12098-013-1164-y. [DOI] [PubMed] [Google Scholar]
- 20.Reddy KR, Sashidhar B. Television viewing habits and their effects among high school children in urban field practice area of Mamta Medical College. IJRHS. 2013;(1):2321–7251. [Google Scholar]
- 21.Rideout VJ, Foehr UG, Roberts DF. Generation M2. Media Lives Of. 2010:8. [Google Scholar]
- 22.Khalil S, Hiba M, Khan Z. A cross sectional study regarding pattern & effects of television viewing amongst children aged 5 to 15 years in a district of Northern India. J Adv Res Med Sci Former J Adv Res Biol Sci. 2014;6:223–8. [Google Scholar]
- 23.Straker L, Smith A, Hands B, Olds T, Abbott R. Screen-based media use clusters are related to other activity behaviours and health indicators in adolescents. BMC Public Health. 2013;13:1174. doi: 10.1186/1471-2458-13-1174. [DOI] [PMC free article] [PubMed] [Google Scholar]
- 24.Ye S, Chen L, Wang Q, Li Q. Correlates of screen time among 8-19-year-old students in china. BMC Public Health. 2018;18:467. doi: 10.1186/s12889-018-5355-3. [DOI] [PMC free article] [PubMed] [Google Scholar]