

Abstract
Purpose:
Safe, sensitive, and non-invasive imaging methods to assess the presence, extent, and turnover of myocardial fibrosis are needed for early stratification of risk in patients who might develop heart failure after myocardial infarction. We describe a non-contrast cardiac magnetic resonance (CMR) approach for sensitive detection of myocardial fibrosis using a canine model of myocardial infarction and reperfusion.
Methods:
Seven dogs had coronary thrombotic occlusion of the left anterior descending coronary arteries followed by fibrinolytic reperfusion. CMR studies were performed at 7 days after reperfusion. A CMR spin-locking T1ρ mapping sequence was used to acquire T1ρ dispersion data with spin-lock frequencies of 0 and 511 Hz. A fibrosis index map was derived on a pixel-by-pixel basis. CMR native T1 mapping, first-pass myocardial perfusion imaging, and post-contrast late gadolinium enhancement imaging were also performed for assessing myocardial ischemia and fibrosis. Hearts were dissected after CMR for histopathological staining and two myocardial tissue segments from the septal regions of adjacent left ventricular slices were qualitatively assessed to grade the extent of myocardial fibrosis.
Results:
Histopathology of 14 myocardial tissue segments from septal regions was graded as grade 1 (fibrosis area, <20% of a low power field, n = 9), grade 2 (fibrosis area, 20–50% of field, n = 4), or grade 3 (fibrosis area, >50% of field, n = 1). A dramatic difference in fibrosis index (183%, P < 0.001) was observed by CMR from grade 1 to 2, whereas differences were much smaller for T1ρ (9%, P = 0.14), native T1 (5.5%, P = 0.12), and perfusion (−21%, P = 0.05).
Conclusion:
A non-contrast CMR index based on T1ρ dispersion contrast was shown in preliminary studies to detect and correlate with the extent of myocardial fibrosis identified histopathologically. A non-contrast approach may have important implications for managing cardiac patients with heart failure, particularly in the presence of impaired renal function.
Keywords: CMR, Myocardial diffuse fibrosis, Spin-lock T1ρ, Myocardial infarction
1. Background
Cardiac fibrosis is one of the hallmarks of pathological left ventricular (LV) remodeling [1], which plays a significant role in myocardial response to injury. Excessive cardiac fibrosis leads to progression of heart failure [2]. Therefore, non-invasive imaging methods to quantitatively and reproducibly assess at an early stage the presence, extent, and turnover of myocardial fibrosis are needed for risk stratification of heart failure, and also to monitor the effects of treatment in patients after acute myocardial infarction (MI).
Historically, the most convenient and cost-effective imaging tool for fibrosis has been ultrasonic calibrated integrated backscatter [3]. Developed in the 1980s [4], it detects the decreased tissue elasticity and thus changes in acoustic impedance and reflectivity of the myocardium as collagen increases. However, this imaging method has low reproducibility and poor image quality due to certain technical limitations [5]. CMR T1 mapping is a technique that enables quantification of extracellular volume fraction (ECV), a surrogate marker for myocardial fibrosis that has been extensively validated [6,7]. However, T1 mapping requires the administration of gadolinium contrast agent to obtain pre- and post-contrast T1 maps to calculate ECV, which may be contraindicated in some patients, especially those with impaired renal function (e.g., in heart failure, diabetes, and end-stage renal dysfunction) [8].
Spin-lock T1ρ contrast in MRI has been used extensively for the detection of collagen and proteoglycan contents in knee cartilage in patients with osteoarthritis [9] and in skeletal muscle [10]. This contrast approach measures spin-lattice relaxation time in the rotating frame at a spin-lock amplitude B1 [11]. In myocardial muscle, T1ρ increased up to 2-fold in regions of chronic, non-reperfused MI (primarily replacement fibrosis or scar), in comparison with remote normal myocardial tissue [12,13]. A recent report by van Oorschot et al. demonstrated a good correlation of myocardial T1ρ and ECV values in 20 patients with dilated cardiomyopathy (Pearson r = 0.66) [14]. However, the sensitivity of T1ρ contrast to diffuse types of fibrosis, e.g. at the border zone between infarcted and non-infarcted myocardium after MI, appeared relatively low in other patients assessed previously by these investigators [15]. Several studies have adopted a T1ρ dispersion contrast, rather than a T1ρ contrast, to improve the sensitivity for assessing early cartilage degeneration [16], to investigate aging difference in skeletal muscle [17], and to explore metabolite with chemical exchange sensitive MRI [18]The fundamental mechanism is likely to be the chemical exchange contribution, between free water protons and protons bound with macromolecules, on a time scale of the spin-locking field [19]. In this study, we hypothesized that a T1ρ dispersion contrast would provide another imaging approach with improved sensitivity for the assessment of diffuse myocardial fibrosis [20]. Based on a cardiac T1ρ technique reported previously [21], we report initial evaluation for detection of myocardial fibrosis in a canine model of MI after coronary reperfusion.
2. Methods
2.1. Animal model and protocol
All animal protocols were approved by the Institutional Animal Care and Use Committee at our local institute. The animal preparation was a clinically relevant model of coronary thrombosis and fibrinolytic-induced reperfusion (with recombinant human tissue-type plasminogen activator, rt-PA) as described [22]. Briefly, seven mongrel dogs (21.3 ± 3.4 kg) underwent aseptic left thoracotomy surgery and exposure of the left anterior descending coronary artery (LAD). A stainless steel needle electrode and an MR-compatible electromagnetic flow probe (Transonic Systems) were placed on the artery below the first diagonal branch to monitor the change in coronary artery blood flow. The chest was then closed in layers and the dogs recovered from surgery.
Coronary thrombosis was induced by application of anodal current to the coronary electrode from a 9 V battery with the cathode attached to the skin. One hour after complete thrombotic occlusion, rt-PA (1 mg/kg) was given to induce lysis of the thrombus and coronary reperfusion. Coronary patency was confirmed and followed with use of the flow probe as described [22].
CMR scans were at 7 days after reperfusion. Anesthesia was induced with isoflurane (1–5%) delivered through a facemask followed by a cuffed endotracheal tube. The electrocardiogram (ECG) and arterial oxygen saturation were monitored continuously.
2.2. CMR imaging protocol
All Cardiac MR studies were performed on a Siemens 3T Trio System (Siemens Medical Solution, Malvern, PA) using an 8-element phased-array coil as the receiver. After scout imaging to localize the short-axial slices, the following scans were performed: (1) native T1 mapping - measurements of myocardial T1 were performed using a modified fast look-locker imaging sequence that was developed and validated [23]; (2) non-contrast T1ρ dispersion imaging at two spin-lock frequencies (SLFs), 0 Hz and 510 Hz; (3) first-pass perfusion imaging for myocardial blood flow (MBF) measurements, with a dual-bolus approach (10 and then 100 μmol/kg of the MR contrast agent Multihance, Bracco Diagnostic, Princeton, NJ) [24]; and (4) late gadolinium enhancement (LGE) imaging - acquired after an additional injection of 50 μmol/kg Multihance, using a clinical LGE protocol in the MRI system [25]. All imaging parameters are shown in Table 1.
Table 1.
MRI sequences and parameters.
| T1-mapping | T1ρ mapping | First-pass perfusion | LGE | |
|---|---|---|---|---|
| Pulse sequence | Modified single-shot look-locker | T1ρ-prepared segmented gradient-echo | Saturation recovery turbo-FLASH | Phase-sensitive inversion recovery |
| TR/TE/flip angle | 2.3 ms/1.1 ms/15° | 3.4 ms/1.7 ms/15° | 2.2 ms/1.1 ms/15° | 4.4 ms/2.3 ms/20° |
| TI or time of spin-lock | TI = 100–7000 ms | TSL = 10, 30, 50 ms | TI = 100 ms | TI = 280–340 ms |
| B1 | N/A | 0 and 12 μT | N/A | N/A |
| Segment. # | Single-shot | 31–41 | Single-shot | 23 |
| FOV | 220 × 170 × 8 mm3 | 220 × 170 × 8 mm3 | 220 × 170 × 8 mm3 | 220 × 170 × 8mm3 |
| Matrix | 160 × 120 × 1 | 192 × 150 × 1 | 192 × 72 × 1 | 256 × 156 × 1 |
| Acquisition Time/slice | 30 cardiac cycles (~600 ms/cycle) | 45 cardiac cycles (~600 ms/cycle) | 70 cardiac cycle (~600 ms/cycle) | 16 cardiac cycles (~600 ms/cycle) |
The T1ρ sequence scanned each slice with two breath-holds to acquire T1ρ maps at two SLFs. This worked well in anesthetized, respiratory-controlled animals without any apparent registration motion artifacts. The T1ρ imaging sequence applied three 180° refocusing RF pulses and a rotary echo scheme for spin-lock pulses in the T1ρ-preparation module to reduce B0 and B1 inhomogeneity artifacts (Fig. 1) [21]. Triggered by every third ECG signal, the specific absorption rate was controlled under the safety limits imposed by the MRI system manufacturer. In our initial study with normal dogs (unpublished data), this approach provided the best image quality, given the limited breath-hold time, restriction of specific absorption rate, and desired image resolution. The T1ρ (0 Hz) is essentially T2 that can be also used to assess myocardial edema.
Fig. 1.
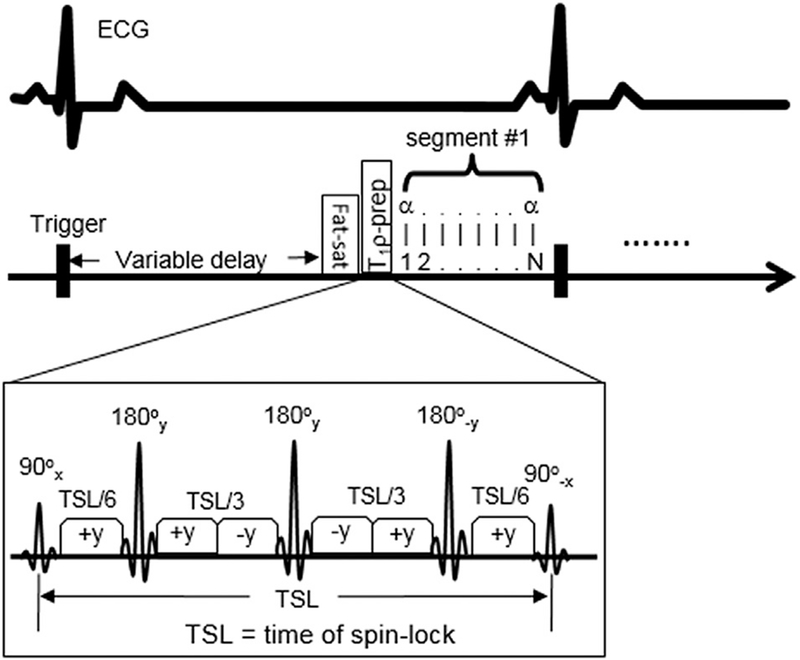
Schematic diagrams of the cardiac T1ρ -preparation sequence with three 180° refocusing pulses and rotary echo scheme for the reduction of B0 and B1 inhomogeneity. Three T1ρ-weighted images are acquired at three different TSL (10, 30, 50 ms) to form one T1ρ map. The sequence uses a segmented data acquisition scheme to acquire data and a trigger delay time is varied to ensure data acquisition time to occur at the mid-diastole for the reduction of cardiac motion.
2.3. Histopathology
After the CMR, the hearts were perfused in situ with Evans blue dye, with the coronary artery reoccluded using a suture tie to estimate the previous non-perfused ‘region-at-risk’ in transverse slices of the left ventricle. The slices were then placed in triphyltetrazolium chloride to delineate the unstained (infarcted) muscle in each slice. The slices were then fixed in 4% paraformaldehyde solution for morphologic examination. Two adjacent ventricular slices were selected, based on approximately the same distance to the ventricular base as two MRI slices. Tissue specimens from the mid-septal zone bordering the non-perfused myocardium in these slices were embedded in paraffin, cut in 5 μm sections, and stained with Masson’s trichrome stain for morphologic identification of collagen [26].
2.4. CMR data and histopathologic analysis
A myocardial fibrosis index (mFI) can be defined as follows:
where mFI was calculated on a pixel-by-pixel basis, with units of msec. Two short axial images matching the locations of the tissue slices were analyzed for each imaging session, based on the distances from the tissue locations to the base of the hearts. The T1ρ (ω1), T1ρ (0), mFI, and T1 maps were all generated using custom-made software written in MATLAB (MathWorks, Natick, MA). MBF maps were obtained using another custom-made software (Perfusion Imaging Toolkit) that employed the Fermi function deconvolution to determine absolute MBF (ml/min/g) [27].
Due to severe artifacts in the anterior and lateral regions of the LV caused by the metal needle in the LAD, image analysis for this study was performed only in the mid-anteroseptal region. Regions-of-interest (ROIs) were drawn in this region that matched the location of the specimens in histopathology. Despite being comprised of both normal and infarcted myocardium, this region has been shown to develop fibrosis several days after MI with impairment of energy metabolism and myocardial function [28,29]. Non-contrast T1ρ, native T1, mFI, and MBF in these ROIs were then measured on the corresponding maps. Using Masson’s trichrome-stained slides of the septal tissue, a pathologist blinded to the MRI results visually estimated the percentage of fibrosis area compared to the total tissue area at 4× (low power) and confirmed at 20× (high power). The fibrosis extent was then scored as grade 1 (fibrosis area, <20% of a low power field, low), grade 2 (fibrosis area, 20–50% of field, moderate), or grade 3 (fibrosis area, > 50% of field, high) as described previously [30]. The differences in image parameters between grades were compared using unpaired two-tailed Student’s t-tests. Significance was defined as P < 0.05.
3. Results
Because there were two mid-anteroseptal regions analyzed in each scan per dog, there were a total of 14 slides for analysis. Based on the microscopic examination, nine slides from five dogs were scored as grade 1, four slides from two dogs were scored as grade 2, and one slide was scored as grade 3. There was no edema evident in the septal regions in T1ρ (0) maps.
In Table 2, native T1, T1ρ, and mFI increased with increasing grades, whereas MBF decreased as expected. Comparing mFI to T1ρ at SLF of 510 Hz and native T1, mFI demonstrated the largest difference from grade 1 to grade 2 fibrosis. This difference in mean mFI was 183% (P < 0.001), whereas the differences in other indices were 8.8% (P = 0.14) for T1ρ (510 Hz), 5.5% (P = 0.12) for native T1, and −21.1% (P = 0.05) for MBF. Only the mFI index showed a significant difference between the two grades. Statistical comparisons were not feasible for grade 3 because of the single sample. Fig. 2 shows image examples of grade 1, 2, and 3 fibrosis in the septal region of the ventricular slices from three different animals, as well as the corresponding histopathology.
Table 2.
MRI parameters of myocardial tissue at different fibrosis grades determined by histopathology (mean ± standard deviation).
| Native T1 (ms) | T1ρ (0 Hz) (ms) | T1ρ (510 Hz) (ms) | mFI (ms) | MBF (ml/min/g) | LGE? | |
|---|---|---|---|---|---|---|
| Grade 1 (n = 9) | 1218 ± 43 | 38.6 ± 4.0 | 42.5 ± 3.6 | 3.9 ± 1.5 | 0.85 ± 0.15 | No |
| Grade 2 (n = 4) | 1285 ± 93 | 34.3 ± 4.0 | 46.2 ± 4.8 | 10.9 ± 0.9* | 0.67 ± 0.07 | Some |
| Grade 3 (n = 1) | 1413 | 43.3 | 67 | 22.7 | 0.39 | Yes |
P < 0.001, Grade 2 vs. Grade 1.
Fig. 2.
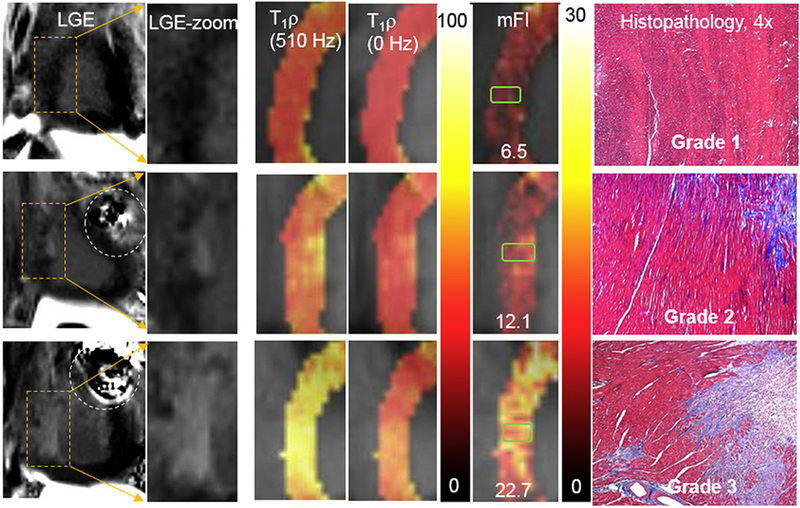
Examples of various contrasts of images and maps for fibrosis grade 1 (top), grade 2 (middle), and grade 3 (bottom). From left to right, LGE images, zoomed LGE images on septal regions, T1ρ maps (510 Hz), T1ρs map (0 Hz), and mFI maps (ms) in the same septal regions, as well as corresponding trichrome-stained histopathological images (blue = fibrosis). The green rectangles in mFI maps indicate approximate areas where the histopathological slides were located. The values in mFI maps indicated the mean mFI measured in the green rectangle covered regions. The dashed circles in the LGE images point to the artifacts induced by metal needles. The collagen deposit was shown in blue in histopathological slides. The units of color scale for T1ρ and mFI maps are ms. (For interpretation of the references to color in this figure legend, the reader is referred to the web version of this article.)
4. Discussion and conclusion
This study reports a sensitive index for the detection of myocardial fibrosis without use of an exogenous contrast agent. Correlating with histopathologic results, the index demonstrated approximately a 2-fold difference between low and moderate fibrosis grades, whereas other standard MRI parameters showed only 5–21% differences (Table 2).
The animal model of MI and reperfusion was followed by structural remodeling with scar formation at the MI site (the anterior regions) and tissue changes in the septal myocardium that we imaged in this study, including formation of the diffuse interstitial and replacement fibrosis. After MI and reperfusion, during the early stages of myocardial healing (24 h – 2 weeks), several cytokines, including TGF-β1 TNF-α, and IL-1 contribute to the conversion of cardiac fibroblasts into myofibroblasts [31]. The latter produce fibrillar type I and III collagens globally, i.e., increased collagen deposition in the interstitial compartment of non-infarcted myocardium [32]. Therefore, it is not unexpected to observe some infarction and diffuse fibrosis at the border zone of infarction in the septum at 7 days after a fairly large anterior MI and reperfusion in our canine model [33].
Non-contrast mFI imaging may provide an alternative to the current approach for assessing myocardial fibrosis. The mFI imaging is based on T1ρ dispersion contrast, rather than the absolute T1ρ contrast. The latter has been reported by several groups to show up to a 1-fold higher T1ρ value for myocardial scar tissue induced by MI [12,13,20]. For other regions with less collagen content, such as the border zone of the infarct, the amount of increase in T1ρ is much less, making the distinction and quantification of differences in fibrosis more problematic. On the other hand, the T1ρ dispersion contrast produced a much greater difference in T1ρ between two SLFs, resulting in detection of more subtle differences in the extent of fibrosis, even within the border zone region [20]. For this reason, mFI is defined as the difference between T1ρ (0) and T1ρ (ω1), rather than a composite metric R2 − R1ρ (R1ρ = 1/T1ρ) [16] or the ratio of T1ρ (ω1) and T1ρ (0) [34].
For normal myocardial tissue, the mFI contrast between 0 and 510 Hz of SLF should be relatively small [20]. For myocardial tissue with excess collagen, as with the diffuse type of fibrosis, T1ρ dispersion contrast is expected to increase and then reach much higher intensity in regions of densely packed collagen. The quantified mFI derived from the T1ρ dispersion contrast indeed showed approximately a 2-fold difference between fibrosis in grades 1 and 2 (Table 2). The moderate grade 2 fibrosis was composed of both diffuse and densely packed collagen (producing some LGE-enhanced areas). Although the low grade 1 fibrosis was defined as <20% by area, it was noted that the fibrosis content of grade 1 was negligible by visual inspection (Fig. 2). Although absolute T1ρ values also increased, the difference between two grades was not statistically significant, demonstrating greater sensitivity for the mFI contrast to detect myocardial diffuse types of fibrosis. To our knowledge, this is the first report for systematic investigation of T1ρ dispersion contrast in myocardial tissue with a diffuse type of fibrosis.
Despite a few studies in ex vivo tissue, in vivo animal, and human patients, the precise mechanisms of T1ρ to detect myocardial fibrosis remain unknown. Among possible contributors to alter T1ρ signals in myocardial tissue, chemical exchange on a time scale of γB1 or intermediate exchange regimen are likely to play an important role in the modulation of T1ρ signals [35,36,37]. By subtracting T1ρ (0) from T1ρ (ω1) (to result in mFI), the intrinsic T2 effect affecting both T1ρ (0) and T1ρ may be cancelled out or much reduced. This may “amplify” the chemical exchange effect in the relaxation times when water protons to exchange on the time scale of γB1 are locked without dephasing [19,38].
Although increased T1ρ in myocardial scar tissue was thought to be associated with increased macromolecular content such as collagen ex vivo studies in agarose and other protein phantoms pointed in an opposite direction, i.e., an increase in agarose/protein concentration resulted in a decrease in phantom T1ρ [39,40]. In addition, loss of proteoglycan and glycosaminoglycan (GAG) in cartilage appeared to be associated with the elevation of T1ρ. Nevertheless, based on chemical exchange theory [16,18], an increased concentration of water protons bound to macromolecules leads to increases in both ΔR1ρ and mFI The magnitude of the increase is modulated by the chemical shifts and exchange rates of macromolecules. After myocardial infarction, production of structural proteins such as collagens is elevated to facilitate in farct healing. Other nonstructural matricellular proteins proteoglycans, and GAGs are all upregulated as orchestrators of myocardial extracellular matrix (ECM) remodeling contributing to inflammation, angiogenesis, and fibrosis [41]. These nonstructural proteins include matricellular proteins (tenascins, osteopontin, perioddstin) hyaluronan (the largest GAG in cardiac ECM), and small leucine-rich proteoglycans (biglycan, decorin, lumican) [42]. These upregulated proteins with varied size and weight would increase the exchange sites, resulting in increased mFI. However, the dynamic changes of all proteins would alter the mFI during myocardial remodeling. More studies are needed to determine the correlation of mFI with extracellular volume and whether mFI reflects the content of collagen or other macromolecules in myocardial ECM.
There are several limitations in this pilot study besides the small number of animals. The animal model is not specialized for creating myocardial fibrosis, but rather MI. Fortunately, both replacement and diffuse interstitial fibrosis can be observed in the septum adjacent to the anterior MI region in some animals. Using this model is the first step to prove the concept of this non-contrast MRI approach. Although there were no artifacts observed in the septal regions, there were relatively large signal void artifacts in the anterior, lateral, and sometimes posterior regions due to the metal needle in the coronary artery (Fig. 2, dashed circles). Improvements in our animal model currently under development will eliminate the needle electrode increasing our ability to assess fibrosis in all regions of the heart. Another limitation is that two scans are needed for mFI measurements. Measurement errors could arise due to misregistration and cardiac motion. One solution is to use interleaved acquisition of k-space data of two T1ρ images in one scan. This CMR sequence is under development. Finally, whether this index can be used in the acute phase of MI, in the presence of interstitial edema is unknown. The current study only analyzed the septal region away from the acute infarct area. No edema was detected in this region. With future studies in a modified MI preparation, characteristics of mFI in the acute infarct area will be defined as well.
In summary, we have presented initial data using a non-contrast imaging index for the detection of myocardial fibrosis in a canine model of MI and reperfusion. Histopathological differences in fibrosis extent at 7 days appear to account for large differences in this index. While this index has the potential for quantification of fibrosis content, much more work is needed to characterize its sensitivity and specificity against the gold standards of molecular structure and histopathology.
Acknowledgements
The authors acknowledge funding from NIH 2R44HL095169 (to RC and DA) to support this work. We would also like to thank Dr. Jeff Wang, a pathologist at Washington University, for reviewing and grading the fibrosis content in the histopathologic sections, Pamela Baum for surgical assistance and post-operative care of the animals, and Annie Nguyen for help with the histopathology.
References
- [1].Mann DL, Barger PM, Burkhoff D. Myocardial recovery and the failing heart: myth, magic, or molecular target? J Am Coll Cardiol 2012;60:2465–72. [DOI] [PMC free article] [PubMed] [Google Scholar]
- [2].Brown RD, Ambler SK, Mitchell MD, Long CS. The cardiac fibroblast: therapeutic target in myocardial remodeling and failure. Annu Rev Pharmacol Toxicol 2005;45:657–87. [DOI] [PubMed] [Google Scholar]
- [3].Kosmala W, Przewlocka-Kosmala M, Wojnalowicz A, Mysiak A, Marwick TH. Integrated backscatter as a fibrosis marker in the metabolic syndrome: association with biochemical evidence of fibrosis and left ventricular dysfunction. Eur Heart J Cardiovasc Imaging 2012;13:459–67. [DOI] [PubMed] [Google Scholar]
- [4].Wickline SA, Thomas LJ, Miller JG, Sobel BE, Perez JE. Sensitive detection of the effects of reperfusion on myocardium by ultrasonic tissue characterization with integrated backscatter. Circulation 1986;74:389–400. [DOI] [PubMed] [Google Scholar]
- [5].Di Bello V, Cucco C, Giannini C, et al. Myocardial tissue characterization and aortic stenosis. J Am Soc Echocardiogr 2010;23:1067–70. [DOI] [PubMed] [Google Scholar]
- [6].Broberg CS, Chugh SS, Conklin C, Sahn DJ, Jerosch-Herold M. Quantification of diffuse myocardial fibrosis and its association with myocardial dysfunction in congenital heart disease. Circ Cardiovasc Imaging 2010;3:727–34. [DOI] [PMC free article] [PubMed] [Google Scholar]
- [7].Miller CA, Naish JH, Bishop P, et al. Comprehensive validation of cardiovascular magnetic resonance techniques for the assessment of myocardial extracellular volume. Circ Cardiovasc Imaging 2013;6:373–83. [DOI] [PubMed] [Google Scholar]
- [8].Schleichert RA, Seliger SL, Zhan M, Gaspari AA. Nephrogenic systemic fibrosis and diabetes mellitus. Arch Dermatol 2012;148:255–7. [DOI] [PubMed] [Google Scholar]
- [9].Wang L, Regatte RR. T1ƒÏ MRI of human musculoskeletal system. J Magn Reson Imaging 2015;41:586–600. [DOI] [PMC free article] [PubMed] [Google Scholar]
- [10].Peng XG, Wang Y, Zhang S, et al. Noninvasive assessment of age, gender, and exercise effects on skeletal muscle: initial experience with T1 ρ MRI of calf muscle. J Magn Reson Imaging 2016http://dx.doi.org/10.1002/jmri.25546. [DOI] [PubMed] [Google Scholar]
- [11].Redfield AG. Nuclear magnetic resonance saturation and rotary saturation in solids. Phys Rev 1955;98:1787–809. [Google Scholar]
- [12].Musthafa HS, Dragneva G, Lottonen L, et al. Longitudinal rotating frame relaxation time measurements in infarcted mouse myocardium in vivo. Magn Reson Med 2013;69:1389–95. [DOI] [PubMed] [Google Scholar]
- [13].Witschey WR, Zsido GA, Koomalsingh K, et al. In vivo chronic myocardial infarction characterization by spin locked cardiovascular magnetic resonance. J Cardiovasc Magn Reson 2012;14:37–46. [DOI] [PMC free article] [PubMed] [Google Scholar]
- [14].van Oorschot JW, Güçlü F, de Jong S, et al. Endogenous assessment of diffuse myocardial fibrosis in patients with T1ρ-mapping. J Magn Reson Imaging 2017;45:132–8. [DOI] [PubMed] [Google Scholar]
- [15].van Oorschot JW, El Aidi H, Jansen Of Lorkeers SJ, et al. Endogenous assessment of chronic myocardial infarction with T1ρ-mapping in patients. J Cardiovasc Magn Reson 2014;16:104–12. [DOI] [PMC free article] [PubMed] [Google Scholar]
- [16].Russell C, Pedoia V, Majumdar S, AF-ACL Consortium. Composite metric R2-R1ρ (1/T2 - 1/T1ρ) as a potential MR imaging biomarker associated with changes in pain after ACL reconstruction: a six-month follow-up. J Orthop Res 2016http://dx.doi.org/10.1002/jor.23400. [DOI] [PMC free article] [PubMed] [Google Scholar]
- [17].Wang P, Zhu H, Hakmook Kang, Gore JC. Correction between sodium and T1ρ dispersion in human calf muscle Proceedings of the 24th Annual Meeting of ISMRM, Singapore; 2016. p. 2827. [Google Scholar]
- [18].Jin T, Kim SG. Quantitative chemical exchange sensitive MRI using irradiation with toggling inversion preparation. Magn Reson Med 2012;68:1056–64. [DOI] [PMC free article] [PubMed] [Google Scholar]
- [19].Cobb JG, Xie J, Gore JC. Contributions of chemical exchange to T1ρ dispersion in a tissue model. Magn Reson Med 2011;66:1563–71. [DOI] [PMC free article] [PubMed] [Google Scholar]
- [20].Witschey WR, Pilla JJ, Ferrari G, et al. Rotating frame spin lattice relaxation in a swine model of chronic, left ventricular myocardial infarction. Magn Reson Med 2010;64: 1453–60. [DOI] [PMC free article] [PubMed] [Google Scholar]
- [21].McCommis KS, He X, Abendschein D, Gupte PM, Gropler RJ, Zheng J. Cardiac 17O MRI: towards direct quantification of myocardial oxygen consumption. Magn Reson Med 2010;63:1442–7. [DOI] [PMC free article] [PubMed] [Google Scholar]
- [22].Moeckel D, Jeong SS, Sun X, et al. Optimizing human apyrase to treat arterial thrombosis and limit reperfusion injury without increasing bleeding risk. Sci Transl Med 2014;6:1–10. [DOI] [PMC free article] [PubMed] [Google Scholar]
- [23].Zhang H, Shea SM, Park V, et al. Accurate myocardial T1 measurements: toward quantification of myocardial blood flow with arterial spin labeling. Magn Reson Med 2005;53:1135–42. [DOI] [PubMed] [Google Scholar]
- [24].Christian TF, Rettmann DW, Aletras AH, et al. Absolute myocardial perfusion in canines measured by using dual-bolus first-pass MR imaging. Radiology 2004;232: 677–84. [DOI] [PubMed] [Google Scholar]
- [25].Kellman P, Arai AE, McVeigh ER, Aletras AH. Phase-sensitive inversion recovery for detecting myocardial infarction using gadolinium-delayed hyperenhancement. Magn Reson Med 2002;47:372–83. [DOI] [PMC free article] [PubMed] [Google Scholar]
- [26].de Jong S, van Veen TA, de Bakker JM, van Rijen HV. Monitoring cardiac fibrosis: a technical challenge. Neth Hear J 2012;20:44–8. [DOI] [PMC free article] [PubMed] [Google Scholar]
- [27].Goldstein TA, Jeorsch-Herold M, Misselwitz B, Zhang HS, Gropler RJ, Zheng J. Fast mapping of myocardial blood flow with MR first-pass perfusion imaging. Magn Reson Med 2008;59:1394–400. [DOI] [PubMed] [Google Scholar]
- [28].Volders PG, Willems IE, Cleutjens JP, Arends JW, Havenith MG, Daemen MJ. Interstitial collagen is increased in the non-infarcted human myocardium after myocardial infarction. J Mol Cell Cardiol 1993;25:1317–23. [DOI] [PubMed] [Google Scholar]
- [29].Cleutjens JP, Blankesteijn WM, Daemen MJ, Smits JF. The infarcted myocardium: simply dead tissue, or a lively target for therapeutic interventions. Cardiovasc Res 1999;44:232–41. [DOI] [PubMed] [Google Scholar]
- [30].Milano AD, Faggian G, Dodonov M, et al. Prognostic value of myocardial fibrosis in patients with severe aortic valve stenosis. J Thorac Cardiovasc Surg 2012;144:830–7. [DOI] [PubMed] [Google Scholar]
- [31].Jugdutt BI. Ventricular remodeling after infarction and the extracellular collagen matrix: when is enough enough? Circulation 2003;108:1395–403. [DOI] [PubMed] [Google Scholar]
- [32].Jugdutt BI, Joljart MJ, Khan MI. Rate of collagen deposition during healing after myocardial infarction in the rat and dog models: mechanistic insights into ventricular remodeling. Circulation 1996;94:94–101. [DOI] [PubMed] [Google Scholar]
- [33].Talman V, Ruskoaho H. Cardiac fibrosis in myocardial infarction-from repair and remodeling to regeneration. Cell Tissue Res 2016;365:563–81. [DOI] [PMC free article] [PubMed] [Google Scholar]
- [34].Keenan KE, Besier TF, Pauly JM, Smith RL, Delp SL, Beaupre GS, et al. T1ρ dispersion in articular cartilage: relationship to material properties and macromolecular content. Cartilage 2015;6:113–622. [DOI] [PMC free article] [PubMed] [Google Scholar]
- [35].Mäkelä HI, Gröhn OH, Kettunen MI, Kauppinen RA. Proton exchange as a relaxation mechanism for T1 in the rotating frame in native and immobilized protein solutions. Biochem Biophys Res Commun 2001;289:813–8. [DOI] [PubMed] [Google Scholar]
- [36].Cobb JG, Xie J, Gore JC. Contributions of chemical and diffusive exchange to T1ρ dispersion. Magn Reson Med 2013;69:1357–66. [DOI] [PMC free article] [PubMed] [Google Scholar]
- [37].Wang P, Block J, Gore JC. Chemical exchange in knee cartilage assessed by R1ρ (1/T1ρ) dispersion at 3T. Magn Reson Imaging 2015;33:38–42. [DOI] [PMC free article] [PubMed] [Google Scholar]
- [38].Kogan F, Singh A, Cai K, Haris M, Hariharan H, Reddy R. Investigation of chemical exchange at intermediate exchange rates using a combination of chemical exchange saturation transfer (CEST) and spin-locking methods (CESTrho). Magn Reson Med 2012;68:107–19. [DOI] [PMC free article] [PubMed] [Google Scholar]
- [39].Virta A, Komu M, Kormano M. T1rho of protein solutions at very low fields: dependence on molecular weight, concentration, and structure. Magn Reson Med 1997; 37:53–7. [DOI] [PubMed] [Google Scholar]
- [40].van Oorschot JW, Visser F, Eikendal AL, et al. Single breath-hold T1ρ-mapping of the heart for endogenous assessment of myocardial fibrosis. Investig Radiol 2016;51: 505–12. [DOI] [PubMed] [Google Scholar]
- [41].Ma Y, de Castro Brás LE, Toba H, Iyer RP, Hall ME, Winniford MD, et al. Myofibroblasts and the extracellular matrix network in post-myocardial infarction cardiac remodeling. Pflugers Arch 2014;466:1113–27. [DOI] [PMC free article] [PubMed] [Google Scholar]
- [42].Rienks M, Papageorgiou AP, Frangogiannis NG, Heymans S. Myocardial extracellular matrix: an ever-changing and diverse entity. Circ Res 2014;114:872–88 [DOI] [PubMed] [Google Scholar]