

INTRODUCTION
Commensal gut bacterial communities (microbiomes) are predicted to influence human health and disease1,2. Neonatal gut microbiomes are colonized with maternal and environmental flora, and mature toward a stable composition over two to three years3,4. To study pre- and post-natal determinants of infant microbiome development, we analyzed 402 fecal metagenomes from 60 infants aged 0–8 months, using longitudinal generalized linear mixed models (GLMMs). Distinct microbiome signatures correlated with breastfeeding, formula ingredients, and maternal gestational weight gain (GWG). Amino acid synthesis pathway accretion in breastfed microbiomes complemented normative breastmilk composition. Prebiotic oligosaccharides, designed to promote breastfed-like microflora5, predicted functional pathways distinct from breastfed infant microbiomes. Soy formula in six infants was positively associated with Lachnospiraceae and pathways suggesting a short-chain fatty acid (SCFA)-rich environment, including glycerol to 1-butanol fermentation, which is potentially dysbiotic. GWG correlated with altered carbohydrate degradation and enriched vitamin synthesis pathways. Maternal and postnatal antibiotics predicted microbiome alterations, while delivery route had no persistent effects. Domestic water source correlates suggest water may be an underappreciated determinant of microbiome acquisition. Clinically important microbial pathways with significant dietary correlates included dysbiotic markers6,7, core enterotype features8, and synthesis pathways for enteroprotective9 and immunomodulatory10,11 metabolites, epigenetic mediators1, and developmentally-critical vitamins12, warranting further investigation.
MAIN TEXT
Commensal gut microbes contribute to pathogen exclusion, nutrient acquisition, and immune recognition, thereby preventing or modulating multiple human pathologies1,2. Understanding determinants of early microbiome establishment can guide health-promotion and disease-prevention efforts.
Human milk provides optimal infant nutrition12, and favors gut Bifidobacterium and Lactobacillus spp4,13. While commercial formulas closely approximate breastmilk composition12,14, and galacto- (GOS) and fructo-oligosaccharides (FOS) are designed to mimic human milk oligosaccharides5, breastfed and formula-fed infant gut microbiomes remain distinct4,12. The impact of specific formula ingredients on gut microbiome acquisition is underdetermined.
To test the hypothesis that specific formula components alter developing gut microbiomes’ taxa and gene-encoded functions, we whole-metagenome shotgun sequenced 402 frozen fecal samples collected monthly from 60 healthy twins (median gestational age 37 weeks) from birth to eight months3,13 (Table S1). We constructed longitudinal GLMMs for taxa and genetically-encoded functional pathways (for brevity hereafter referred to as “pathways”) inferred using MetaPhlAn2 and HUMAnN2; all p values are two-tailed, from maximum-likelihood GLMMs Tukey-corrected for multiple comparisons (see Online Methods, Tables S2-S7). This study, approved by the Human Research Protection Office of Washington University School of Medicine, complied with all ethical regulations. Written informed consent was obtained for all subjects.
We identified multiple known determinants of gut microbiome assembly, confirming the validity of our approach. (Figures 1, S1)4,15–17. Alpha diversity (Shannon index) correlated positively with time (N=402 samples, p<0.001) and fruit/vegetable exposure (N=160, p=0.011), and negatively with maternal intrapartum ampicillin-sulbactam (N=46, p=0.005) and any postnatal antibiotics (N=49, p=0.043). Bifidobacteriaceae enrichment correlated with >50% breastfeeding (N=75, p=0.003) and lifetime GOS exposure (N=204, p=0.005). Lachnospiraceae increased with time (N=402, p<0.001) and decreased with any breastfeeding (N=125, p=0.014), Enterobacteriaceae decreased with time (N=402, p<0.001) and GOS (N=204, p=0.003), and Bacteroidaceae decreased with Cesarean delivery (N=227, p=0.003) and increased with fruit/vegetable exposure (N=160, p=0.004).
Figure 1: Taxonomic Composition of Infant Fecal Microbiota.
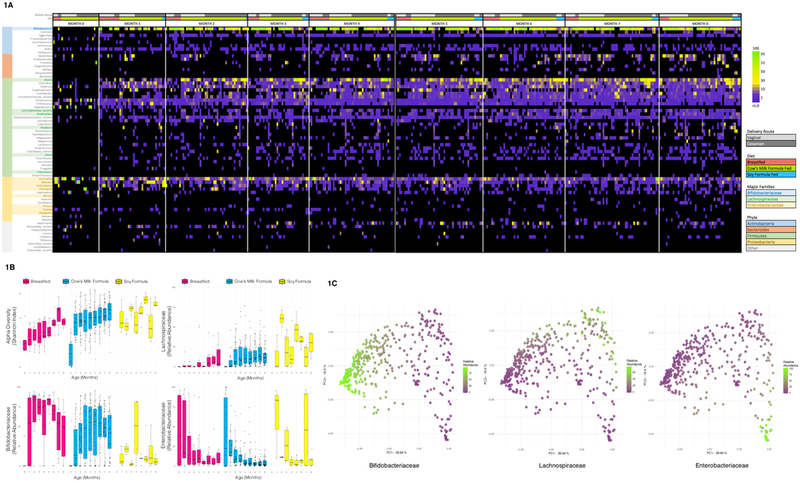
1A: Relative Abundance of Genera, Grouped by Month, Diet, and Delivery Route. Samples are grouped horizontally by month of life, diet (breastfeeding, cow’s milk formula, soy formula), and delivery route. All genera with ≥ 2% relative abundance in any sample are included, sorted vertically by phylum and relative contribution to the aggregate community of all subjects.
1B: Diversity and Major Taxa by Age and Diet. Boxplots (boxes representing interquartile ranges with median shown in black) portray alpha diversity (Shannon index) and relative abundance of Bifidobacteriaceae, Lachnospiraceae, and Enterobacteriaceae over time, separated by diet type: majority breastfeeding (N=75 samples), cow’s milk formula-feeding (N=295), and soy formula-feeding (N=32). Diversity increases with age (p<0.001) and soy (p=0.036). Bifidobacteriaceae positively correlated with breastfeeding (p=0.003), and negatively with soy (p<0.001). Lachnospiraceae increased in association with time (p<0.001) and soy (p<0.001) and decreased with breastfeeding (p=0.014). Enterobacteriaceae decreased with time (p<0.001) and GOS in cow’s milk formula (p=0.003). All p values are from multivariate longitudinal maximum-likelihood GLMMs, Tukey-corrected for multiple comparisons (Table S3).
1C: Principle Coordinate Analysis (PCoA) plot of Taxonomic Families, Colored by Major Taxa. PCoA plots of taxonomic families based on the Bray-Curtis dissimilarity index for all samples (N=402) are shaded from low (purple) to high (green) relative abundance of Bifidobacteriaceae, Lachnospiraceae, and Enterobacteriaceae, highlighting three distinct clusters. Sequential MANOVA (adonis in R, two-tailed) yielded R2 values of 0.37 for Bifidobacteriaceae (p=0.001), 0.13 for Lachnospiraceae (p=0.001), 0.11 for Enterobacteriaceae (p=0.001); residual R2 from a multivariate model including only these three taxa was 0.38.
Breastfed infant gut microbiomes accrued amino acid synthesis pathways that complemented breastmilk’s changing amino acid content14, suggesting that parallel milk and microbiome development may reflect physiologic adaptation (Figure 2). Majority-breastfed (>50%) infant gut microbiomes (N=75) had significantly more methionine (p<0.001), BCAA (branched-chain amino acids isoleucine/leucine/valine, p=0.020), cysteine/serine (p=0.012), threonine (p=0.004), and arginine (p=0.023) synthesis pathways. All pathways enriched in breastfed microbiomes except cysteine/serine correspond to amino acids less concentrated in breastmilk than in standard infant formula14,18. Breastfed microbial arginine and BCAA synthesis pathways increased sharply after birth and plateaued at ~60 days, coinciding precisely with normative declining amino acid content as breastmilk transitions from colostrum to mature milk.14 (Fig. 2). Breastmilk is low in methionine and cysteine in all lactation stages14; breastfed microbiomes had more methionine and cysteine pathways at all timepoints. Histidine and tryptophan are more abundant in breastmilk than in formula14, and breastfed microbiomes had significantly less histidine-purine-pyrimidine (p=0.046) and tryptophan-precursor chorismate (p<0.001)19 synthesis pathways. Glutamate and glutamic acid are abundant in breastmilk14, and glutamate synthesis pathways (PWY-5505), though too sparse to model, were almost exclusive to formula-fed microbiomes (N=114, 90% of total). Lysine was an exception to milk-microbe complementarity. Infant formulas have more lysine than breastmilk, yet formula-fed microbiomes had more lysine synthesis pathways (p=0.003). Lysine synthesis pathways mapped to Bacteroides and Firmicutes genera (Supplementary Table 40); formula-associated enrichment likely reflects accelerated microbiome maturation following breastfeeding cessation4,13.
Figure 2: Dynamic Development of Amino Acid Synthesis Pathways.
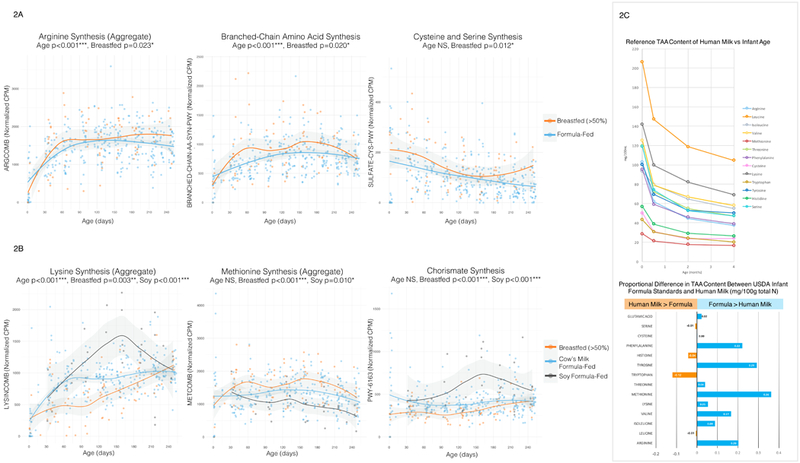
2A: Selected Amino Acid Synthesis Pathways, By Age and Diet (Breastfeeding vs. Formula), 2B: Selected Amino Acid Synthesis Pathways, By Age and Diet (Breastfed, Cow’s Milk Formula-Fed, Soy Formula-Fed). Scatterplots of normalized abundance (counts per million) of selected amino acid synthesis pathways vs. infant age (days) are shaded according to diet type. In plot 2A, mostly breastfeeding (N=75 samples) is compared with mostly formula feeding (N=327); in plot 2B, current majority breastfeeding (N=75), cow’s milk formula-feeding (N=295), and soy formula-feeding (N=32) are compared. Regression lines with 95% confidence interval shading are drawn using the loess method in R. All p values are two-tailed, from multivariate longitudinal maximum-likelihood GLMMs, Tukey-adjusted for multiple comparisons (Table S3).
2C: Known Reference Ranges for Human Milk Total Amino Acid (TAA) Content. Published TAA reference ranges in term breastmilk are plotted in comparison with USDA standards for infant formula to contextualize panels 2A and 2B. The line graph plots normative human milk TAA content (mg/100mL) content over time for colostrum (origin), transitional milk (0.5 months), two months, and four months post-delivery (Zhang et. al, Table 4)14. The bar plot shows predicted differences in total amino acid content (mg/100g total nitrogen) between USDA 2009 standards for infant formula and mature human milk (Zhang et. al, Table 8)14, divided by normative values for human milk; a +0.36 value for methionine indicates that formula has 36% more methionine (mg/total N) than human milk.
Milk-microbiome complementarity may be physiologically relevant to neonatal and infant protein balance12,14. Although breastmilk’s amino acid content declines post-partum14 and formula composition is static, normative serum arginine, cysteine, and methionine levels decline almost identically in breastfed and formula-fed infants20, suggesting a “gap” that might be filled by microbially-produced amino acids. Breastfeeding-enriched metabolic pathways could mechanistically explain some of its known benefits11,12. Arginine and cysteine might prevent serious infections10,11 and biotin, enriched in breastfed infants (p=0.006), inhibits pathogenic E. coli adherence9. Many breastfeeding-associated amino acid synthesis pathways mapped to Bifidobacterium spp., an exceptionally successful breastfed gut colonizer. Breastfeeding-correlated enrichment of Bifidobacterium-identified amino acid synthesis pathways in a pattern contemporaneous and complementary to human milk maturation might reflect ancestral co-evolution with commensal microbiota.
GOS and FOS are added to formulas to promote breastfed-like microbial communities5. Although lifetime GOS exposure correlated with Bifidobacteriaceae enrichment, prebiotics did not uniformly predict breastfed-like functional pathways, highlighting current technologic limitations of formula design and manufacturing (Figure S2). Concurrent GOS and FOS exposure (N=26) predicted increased microbial BCAA (p<0.001) and threonine (p=0.038) synthesis pathways, mimicking breastfeeding. Lifetime GOS exposure (N=204) predicted decreased tyrosine (p=0.004), cysteine/serine (p=0.003), and arginine-polyamine (p=0.040) synthesis pathways, opposing breastfeeding. In all models, prebiotic coefficients approximately equaled or exceeded those for breastfeeding. Pathways depleted with GOS exposure primarily belonged to Enterobacteriaceae (Table S4); discordant GOS and breastfeeding correlates might reflect GOS-related decrease in Enterobacteriaceae5.
Six infants from four families were soy-exposed; sample size ranged from 31–37, depending on soy formula type (+/− FOS) and exposure type (current or lifetime, Table S6). Soy feeding predicted greater alpha diversity (Shannon index, N=31, p=0.036), low Bifidobacteriaceae (N=31, p<0.001) and high Lachnospiraceae (N=32, p<0.001) content; in both taxonomic models, the coefficient for soy was greater than for breastfeeding (Figures 1b, 3, S3). Two soy-exposed twin pairs were soy-discordant, permitting comparison with a related control. Twins are expected to have similar microbiomes3,13, yet soy-discordant twin microbiomes were dissimilar, while unrelated soy-exposed microbiomes had strong resemblance. Soy encourages Lachnospiraceae proliferation16, but has no clear effect on Bifidobacteriaceae16,21. Soy formula could disfavor Bifidobacteriaceae via cidal effects of soy isoflavone derivatives22, by containing prebiotics (FOS) with weak bifidogenic properties23, or by favoring competing taxa16. Pre-soy samples were few (N=6), but pre-post soy comparisons did not suggest soy-mediated bifidobacterial suppression: soy-fed microbiomes were low in Bifidobacteriaceae prior to soy exposure.
Figure 3: Taxonomic and Functional Changes Associated with Soy Formula.
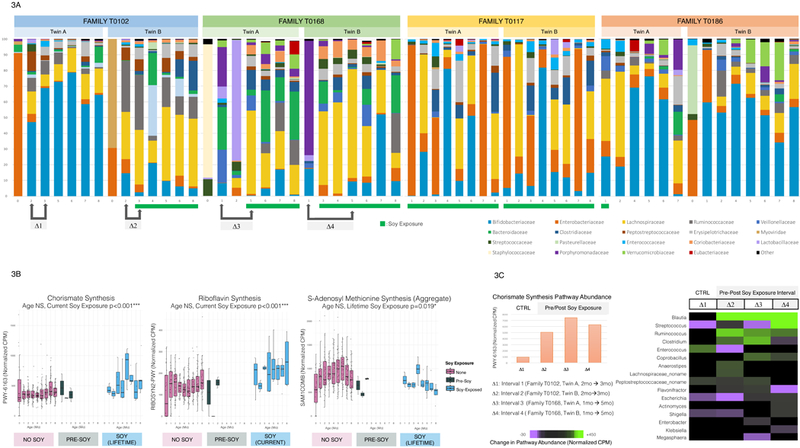
3A: Taxonomic Structure of Soy-Exposed Infants’ Gut Microbiota. Stacked bar plots show relative abundances of taxonomic families over time from four twin pairs with at least one soy-exposed sibling. All families with ≥ 3% relative abundance are included (rare taxa aggregated as “Other”). Pre- and post-soy samples were available for three infants. Bifidobacteriaceae abundance was low pre-soy and throughout the study in all soy-exposed infants, except infant T0186_A, whose Bifidobacteriaceae recovered following soy formula cessation. Soy-discordant twin microbiomes were visibly dissimilar.
3B: Metabolic Pathways by Age and Soy Exposure Status. These boxplots (boxes representing interquartile ranges with median shown in black) show normalized abundance (normalized counts per million CPM) versus age (months) of three functional pathways: chorismate synthesis (PWY-6163), riboflavin synthesis (RIBOSYN2-PWY), and the aggregate methionine synthesis variable METCOMB. Longitudinal plots are separated into soy-naïve (N=364 current, N=359 lifetime), pre-soy (N=6), and soy-exposed samples (N=32 current, N=37 lifetime). Chorismate and riboflavin synthesis pathways increased post-soy, while methionine synthesis pathways decreased. All p values are two-tailed, from multivariate longitudinal maximum-likelihood GLMMs, Tukey-adjusted for multiple comparisons (Table S3).
3C: Changes in Chorismate Synthesis Pathway Homology Following Soy Exposure. The column graph shows numerical differences in total chorismate synthesis pathway (PWY-6163) abundance pre- and post-soy in three soy-exposed infants and one control (N=4 each timepoint). Total PWY-6163 abundance qualitatively increased more in soy-exposed infants than in the control. The heatmap plots numerical pre-post soy difference (normalized CPM) in chorismate synthesis pathway-identified genera, which qualitatively shifted towards Blautia pathway homology with soy exposure.
Low pre-soy bifidobacterial content suggests that low-Bifidobacteriaceae microbiomes might drive soy formula selection, especially as soy-feeding is usually elective24, rather than required for galactosemia, congenital lactase deficiency, and cow’s milk protein allergy25. Soy-correlated depletion of Bifidobacteriaceae-identified methionine (N=31, p=0.010) and S-adenosyl methionine (N=37, p=0.019) synthesis pathways suggests a mechanism for this effect (Table S4). Low-Bifidobacteriaceae microbiomes are associated with infant colic, which often prompts formula changes6. Methionine is a plausible mediator of enteric symptoms, as it is affects both gut epithelia26 and motility27. Indeed, methionine synthesis pathways positively correlated with reported diarrhea in our cohort (N=16, p<0.001), possibly representing a clinical correlate of methionine’s reported prokinetic properties27. Soy protein is methionine-deficient relative to mammalian casein and whey proteins; soy formula is methionine-supplemented with a free methionine content ~125 times that of breastmilk18,24. These gut-specific effects of methionine provide a biologically-plausible mechanism for symptoms associated with low bifidobacterial and methionine synthesis pathway content to improve after initiation of high-methionine formula.
Several soy-associated pathways – chorismate synthesis (N=31, p<0.001), lactose/galactose degradation (N=37, p=<0.001), and starch degradation (N=31, p<0.001) – suggested SCFA-producing Lachnospiraceae proliferation. Soy-correlated enrichment of lysine synthesis (N=32, p<0.001), riboflavin synthesis (N=32, p<0.001), and glycerol-to-butanol fermentation (N=32, p<0.001) pathways suggested adaptation to SCFAs. Lactose/galactose and starch degradation pathways frequently mapped to Lachnospiraceae (Table S4), and a greater proportion of chorismate synthesis pathways were Blautia-identified post-soy exposure (Fig. 3c). Lysine provides an acetate and butyrate synthesis substrate28, butyrate stress in Clostridium spp. induces upregulation of riboflavin and downregulation of methionine synthesis29, acetate stress promotes glycerol to butanol fermentation29, and many microbes co-regulate riboflavin synthesis genes with metabolic stress response modules30. Some soy-associated changes are potentially dysbiotic: decreased Bifidobacteriaceae and elevated glycerol to 1-butanol fermentation combined with high Lachnospiraceae content have been associated with inflammation, allergies, and hepatic steatosis2,7. These dysbiotic features raise concerns about the long-term safety and efficacy of elective soy formula feeding.
Maternal GWG has yet-to-be determined effects on infant gut microbiome development15,31,32. Here, GWG (N=402) predicted persistent enrichment of infants’ microbial glucose (p<0.001) and glycogen (p=0.005) degradation pathways, and phenylalanine (p=0.011), cysteine/serine (p<0.001), folate (p=0.015), thiamine (p<0.001), biotin (p<0.001), and pyridoxine (p=0.009) synthesis pathways, after controlling for gestational age, maternal diabetes, and pre-pregnancy body mass index (Table S1). Starch degradation pathways negatively correlated with GWG (p=0.032) The GWG distribution in our cohort roughly corresponded with Institute of Medicine guidelines for twin pregnancies (see Online Methods): women with inadequate and excessive GWG fell into the first and fourth quartiles, respectively. GWG-correlated pathways plotted by age and quartile suggest that GWG-mediated effects persistent at 8 months are most apparent in infants born to mothers who gained the least weight, and low GWG appears more impactful with increasing gestational age (Figure 4).
Figure 4: Altered Development of Vitamin Synthesis and Carbohydrate Utilization Pathways in Association with GWG (kg).
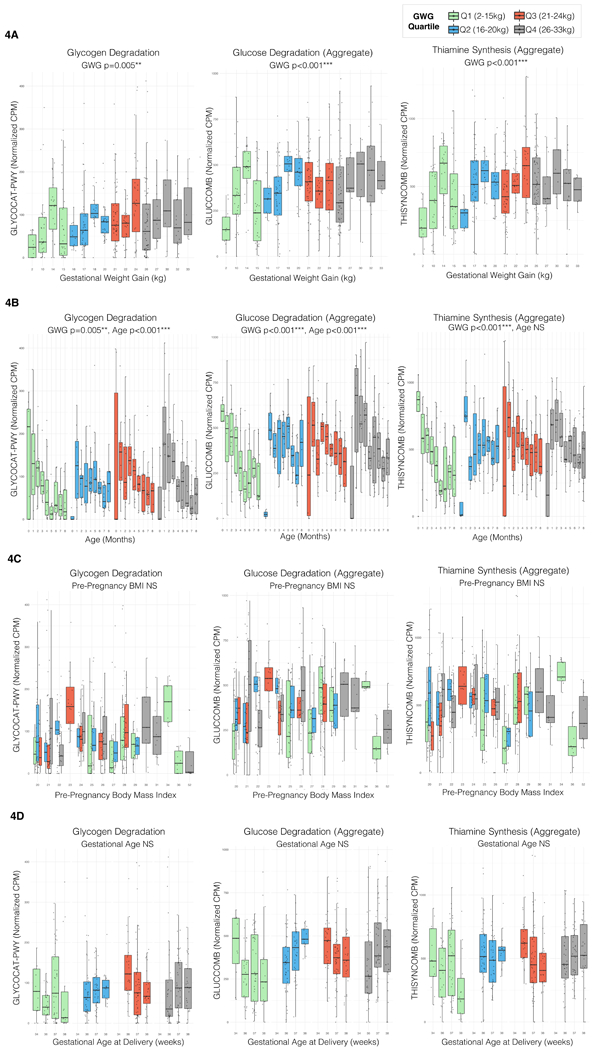
Boxplot boxes in all panels represent interquartile ranges with the median line shown in black; total N=402 all plots. All p values in all panels are two-tailed, from multivariate longitudinal maximum-likelihood GLMMs Tukey-adjusted for multiple comparisons (Table S3).
4A: Selected Metabolic Pathways by GWG. These panels plot normalized abundance (counts per million) of the glycogen degradation pathway GLYCOCAT-PWY, the aggregate glucose degradation variable GLUCCOMB and the aggregate pyridoxine synthesis variable THISYNCOMB versus GWG (kg). The plots are colored according to GWG quartile in this population. All pathways plotted have a significant positive association with GWG. Sample size by quartile: Q1 (N=93 samples), Q2 (N=93), Q3 (N=108), Q4 (N=108).
4B: Selected Metabolic Pathways by Age, GWG. These panels plot normalized abundance (counts per million) of the same pathways by month of life, stratified by maternal GWG (kg) quartile in this population. The differences between the lowest and highest GWG become more apparent over time.
4C: Selected Metabolic Pathways by Maternal Pre-Pregnancy Body Mass Index. Normalized abundance (cpm) of the same pathways plotted versus maternal pre-pregnancy BMI, colored by GWG (kg) quartile.
4D: Selected Metabolic Pathways by Gestational Age (GA), GWG. These panels plot normalized abundance (counts per million) of the same three pathways versus GA at delivery, stratified by GWG (kg) quartile. In the lowest GWG quartile, the abundance vs GA curve slopes in the opposite direction of the abundance vs GWG curve, suggesting that lower GWG is more important with increasing GA.
Although true malnutrition is unlikely in our cohort, maternal undernutrition increases risk of oxidative injury, glucose dysregulation, adiposity, and cardiovascular disease in offspring1. Several GWG-enriched vitamin synthesis pathways (pyridoxine, thiamine, folate) are critical to early infant neurodevelopment12 and thiamine synthesis pathways are a proposed distinguishing core ‘enterotype’ feature8. GWG negatively correlates with folate synthesis pathway abundance in the placental microbiome33. We observed the inverse relationship in our population (GWG-associated folate pathway enrichment), perhaps representing compensation for the fetal microenvironment. Folic acid is a key epigenetic mediator, and might effectuate enduring host-microbe interactions and mediate fetal origins of disease1.
GWG-associated microbial metabolic pathway changes persisting eight months postnatally extends current knowledge that GWG influences microbiome development in the first months of human life15,31,32 and up to one year in non-human primates34. As maternal dietary records and weight gain by trimester were not collected, we can neither identify trimester-specific modulations nor attribute GWG-associated effects to specific dietary variables (e.g. fat content). Enduring GWG-associated changes independent of delivery route or breastfeeding might reflect altered in-utero meconium colonization35, microbe transfer from caregivers36, and other genetic or environmental factors (e.g. family feeding practices) influencing both GWG and infant microbiome acquisition.
Maternal intrapartum antibiotics predicted postnatal development of taxa and functional pathways, eclipsing the effects of delivery route and postnatal antibiotics (Figure S4). Maternal intrapartum ampicillin-sulbactam exposure (N=46) predicted depleted histidine/purine/pyrimidine synthesis (p=0.012) and homolactic fermentation (p<0.001) pathways in offspring microbiomes. Postnatal amoxicillin exposure (N=38), analogous to ampicillin without sulbactam, predicted increased histidine/purine/pyrimidine synthesis pathways (p=0.011). Maternal intrapartum clindamycin exposure (N=25) positively correlated with Lachnospiraceae (p= 0.008), Enterobacteriaceae (p<0.001), and cysteine/serine (p<0.001) and biotin (p=0.002) synthesis pathways. Clindamycin was given immediately prior to Cesarean delivery in our cohort, but the more frequently used cefazolin (N=164) did not correlate with these pathways. Lack of persistent microbiome effects associated with Cesarean delivery when corrected for confounders is consistent with prior reports15. Infant multivitamin with iron exposure (N=40, Fig. S5) predicted enriched arginine-polyamine (p=0.018), folate (p<0.001), and heme (p=0.026) biosynthesis and homolactic fermentation pathways (p=0.028).
Domestic drinking water sources had associated microbiome signatures (Figure S5); sample size depended on exposure type (Table S6). Lactose/galactose degradation pathways positively correlated with filtered water exposure (N=42, p=0.004); enhanced bacterial counts with home water filters might explain this effect37. Tap water exposure predicted decreased Enterobacteriaceae (N=251, p=0.016), glycogen degradation (N=230, p=0.006) and homolactic fermentation (N=230, p=0.007) pathways. Bottled water exposure predicted increased homolactic (N=122, p=0.002) pathways, and boiled/distilled water correlated with increased pyridoxine synthesis pathways (N=61, p=0.003). Together with animal data38, these patterns suggest an underappreciated influence of drinking water on microbiome acquisition.
Although this DNA-based study represents genetic potential rather than confirmed functions, our observations are consistent with transcriptomic studies showing enriched arginine biosynthesis transcripts in mother-fed relative to formula-fed piglets39 and enhanced BCAA synthesis with sialylated oligosaccharide exposure in mice40. Further work is required to mechanistically establish a causal relationship between soy exposure and soy-fed microbiome signatures and to definitively show that soy protein per se drives these changes, likely via experimental validation in microbiome-humanized gnotobiotic mice13.
In summary, our findings suggest host-microbe metabolic mutualism in infancy, whereby gut microbiome gene content expands to counterbalance components lacking in human milk (Fig. S6). We propose that this milk-microbiome synergy reflects physiologic co-evolution with our earliest commensals, and could play a major teleological role in infant protein nutrition and child growth. The observed discordance between microbial functional correlates of formula components (e.g. prebiotics) and breastmilk may warrant revised metrics for evaluating the safety and efficacy of infant formulas. Soy formulas corresponded with profoundly altered taxa and pathways, some of which have pathologic correlates6,7. Finally, the association between maternal GWG and altered infant microbiome carbohydrate utilization and vitamin synthesis pathways enduring eight months postnatally extends current knowledge that maternal GWG influences early microbiome acquisition. These data can inform further ecologic and mechanistic interrogations of gut microbiome development.
ONLINE METHODS
Study Population
This study was approved by the Human Research Protection Office of Washington University School of Medicine in St. Louis, and it complied with all ethical regulations. Written informed consent was obtained from all adult participants, and from the parents or legal guardians of all minor subjects. We used fecal samples that had been frozen at −80oC since collection at monthly intervals from a birth cohort of healthy twins in St. Louis, in which the mothers had consented to monthly fecal sample collection from birth until two years of age3,13,41–43. We selected a time interval of 0–8 months of age to capture transitions from breastfeeding to formula and early introduction of solid food. To minimize potential confounding effects of early illness or antibiotic administration, we excluded any neonates who received antibiotics in hospital following delivery. Because of this predetermined exclusion criterion, we also excluded all infants with a maternal history of chorioamnionitis. 402 samples from 60 infants in thirty-one families met our pre-defined coverage threshold of 5 million reads (2.5 million forward/reverse) before processing44, for a median of 7 samples per infant (IQR 6–8). Demographic data are provided in Table S1. We excluded neonates treated with antibiotics in the first week of life to avoid potential bias from early illness or antibiotic exposure; there were accordingly no infants with a maternal history of chorioamnionitis. Infant age at stool collection ranged from the day of delivery to 253 days. All infants were exposed to solid food by the end of the study period. The median gestational age was 37 weeks (IQR 36–38), 43% of infants were delivered vaginally, and 47% of twins were monozygotic, 50% dizygotic, and 3% of unknown zygosity. Four infants’ mothers were diabetic (7%), six infants’ mothers developed preeclampsia (10%), and two infants were born to a mother with both conditions.
DNA Extraction and Sequencing
We extracted fecal metagenomic DNA and a positive control (Zymobiomics microbial community standard D6300), and used a modified Nextera DNA Library Preparation Kit protocol to prepare DNA for Illumina-platform sequencing (NextSeq-High; ~400,000,000 max reads, 150 cycles per read). A positive control (Zymobiomics community standard) and a negative control (nuclease-free water) were included in sequencing runs. Detailed experimental protocols follow.
DNA extraction
We extracted DNA using the MoBio DNEasy PowerSoil Extraction Kit (Qiagen, 12888–100) according to the manufacturer’s instructions, with the following modification: in lieu of centrifugation, we used bead-beating with a BioSpec Mini-BeadBeater for 4 minutes. Bead-beating consisted of 2 minutes on the “homogenize setting”, 2 minutes on ice, and then 2 minutes on the “homogenize setting”. A Zymobiomics microbial community standard (Zymobiomics, D6300) 0.75 mL was also extracted along with fecal DNA samples. DNA was eluted in 100uL nfH20 and quantitated using a Qbit fluorometer and a Qbit dsDNA HS Assay Kit (Invitrogen, Q32854) according to the manufacturer’s instructions.
Nextera library preparation
Fecal DNA samples were diluted to a concentration of 0.5 ng/uL and 1uL of each sample (including a nuclease free water negative control and the Zymo community standard positive control) were added to a 96-well plate. Sequencing libraries were prepared using the Nextera DNA Library Preparation Kit (Illumina, FC-121–1011) protocol according to the manufacturer’s instructions, with the following modifications:
- Tagmentation
- Tagmentation master mix (TMM) Preparation:
Component 1 rxn (uL) 100 rxns (uL) TD buffer 1.25 125.0 TDE1 enzyme 0.125 12.5 Nuclease free water 0.125 12.5 - 1.5uL TMM added to 1uL gDNA in each well of the 96-well plate, vortexed, and centrifuged
- Plate covered with microseal B and incubated in a Thermocycler at 55C for 15 minutes.
- Adapter Addition
- KAPA HiFi PCR master mix (KAPA HiFi HotStart 2x ready mix #KK2602/KM2605) used for addition of oligonucleotide index adapters. 11.2 uL KAPA PCR MasterMix and 8.8 uL of adapters (1uM) to each well, vortex and centrifuge.
- PCR done with following Thermocycler protocol
- 72C, 3:00
- 98C, 5:00
- 98C, 0:10
- 63C, 0:30
- 72C, 0:30
- go to iii 13X
- 72C, 5:00
- 4C, forever
- PCR cleanup
- Add 22.5 uL AmpPure XP beads to PCR reaction (Agencourt A63881)
- Incubate 5 min at room temperature
- Separate beads x 2min on magnetic stand
- Remove supernatant
- Wash beads x 2 with 200uL 80% ethanol
- Air-dry x 15 min
- Add 30uL resuspension buffer (10 mM Tris-Cl, 1 mM EDTA, 0.05% Tween-20 (pH 8.0)), pipet mix
- Incubate at RT for 5 minutes
- Separate beads on magnetic plate x 2 minutes
- Transfer 27uL supernatant to new plate
- Quantitate DNA with Qubit HS dsDNA Assay kit (Invitrogen, Q32854)
Illumina sequencing
- Library Pooling: After quantitation, sequencing libraries were pooled in triplicate to minimize the effects of pipetting error. Schema for pooling included the following rules:
- Target of 5ng DNA per sample, per pool
- If calculated volume for 5ng <1uL, samples were diluted (2x, 5x, 10x, or 20x) so the volume was >1uL
- Triplicate pools quantitated with Qubit HS dsDNA Assay kit (Invitrogen, Q32854)
- Each pool was added to a single pool to make an equimolar solution, and diluted to a concentration of 2ng/uL
- Pool submitted for Illumina platform sequencing (MiSeq flowcell) as a ~500,000 read spike-in sample; reads analyzed to determine evenness of sample distribution. If needed, a fourth corrective pool was pipetted and added to the solution to ensure adequate read coverage (>2.5M forward/reverse) for all samples.
-
Sequencing
Pooled samples diluted to 2ng/uL with nfH20 (~10uM based on expected fragment size) were submitted for Illumina platform sequencing (NextSeq-High; ~400,000,000 max reads) with 150 cycles per read. Sequence data was returned as a .fastq file with reads demultiplexed according to oligonucleotide adapter indexes.
Clinical Data Collection
Clinical data were collected from medical records at the time of delivery, monthly parental surveys at the time of stool sample collection, and outpatient pediatric records, and securely stored on a RedCap database. Parental questionnaires, infant medical records, and formula manufacturers’ labels provided a detailed clinical and dietary dataset (including symptoms, medications, and introduction of new foods) associated with each sample. Parental dietary reports included infant formula brands, solid foods, and water sources, as well as fields for reporting daily or weekly frequency of each dietary exposure from the CDC Infant Feeding Practices Study II 45. As exclusive breastfeeding was rare in this twin cohort, infants were classified as breastfed if their parents reported >=50% of their feeds as breastmilk in the survey associated with a given stool sample. All breastfed infants received maternal milk; there were no reported exposures to banked or donated human milk. Medication exposures reported on parental surveys were confirmed with medical records from the child’s primary care physician. Information from the manufacturer’s label for each infant formula was used to generate a suite of variables representing exposure to specific formula ingredients (e.g. lactose, sucrose, soy protein, GOS, FOS); full details are below.
Clinical data analytic specifications
Clinical data de-identified of any protected health information was collected from medical records at the time of delivery, monthly parental surveys at the time of stool sample collection, and outpatient pediatric medical records, and securely stored on the RedCap database. Parental dietary reports included:
Binary fields for exposure to human milk, various infant formula brands, foods, medications, experience of symptoms, etc.
Fields for frequency of exposure to a food type, expressed either as the number of times an infant received a food per day, or per week
Free text options
To transform dietary information into data that were usable in statistical models, the following steps were followed
All frequency information listed as exposures per day was converted into exposures per week for convenience
Percentage of feeds comprised of formula were calculated from parental reports of number of formula feeds per week and number of breastfeeds per week. A binary variable for “Mostly Breastfeeding” was also generated if the percentage of breastfeeds was > 50%.
Carbohydrate, protein, and prebiotic (galacto-oligosaccharides, fructo-oligosaccharides) ingredients were determined for each infant formula according to the manufacturer’s label (Table S7). Binary variables for exposure to each ingredient at each timepoint were generated according to the brand(s) of formula(s) the parents had reported, and the manufacturer’s labels. If parents reported using any brand of formula use on the survey associated with a stool sample, binary variables for ingredients in that formula were coded as “1”, even if the parents otherwise recorded that the infant was exclusively breastfed (i.e. if parents reported 100% breastfeeds, but filled in Enfamil Lipil as a formula they selected, the infant was coded as mostly breastfed, but exposed to the ingredients in Enfamil Lipil). If there was ambiguity in the specific brand of formula, then missing values were recorded for binary variables (e.g. if it was unclear whether an infant was given Enfamil Lipil or Enfamil Premium, Lactose and Cow’s milk Formula, which are present in both, would be coded as “1” but galacto-oligosaccharides and Polydextrose, which were only present in Premium, were recorded as missing). Twin siblings were assumed to have concordant feeding practices unless the parents specified otherwise.
- Prebiotic variables were assigned according to exposure to neither, one, or both prebiotics (galacto-oligosaccharides and fructo-oligosaccharides)
- GOS: exposure to galacto-oligosaccharides, regardless of concurrent FOS exposure
- FOS: exposure to fructo-oligosaccharides, regardless of concurrent GOS exposure
- Only GOS: exposure to galacto-oligosaccharides with NO concurrent FOS exposure
- Only FOS: exposure to fructo-oligosaccharides with NO concurrent GOS exposure. ONLY found in soy formulas.
- GOS/FOS: concurrent exposure to galacto-oligosaccharides AND fructo-oligosaccharides.
- Solid food binary variables were aggregated as follows:
- Fruit or vegetable exposure → Fruit/Veg variable; positive if either Fruit or Vegetables were positive
- Meat, fish, or egg exposure → MeatFishEggs variable; positive if any of the components were positive
- Juice or sweetened drink exposure → JuiceSweetDrink variable; positive if either component was positive
- Cereal or starch exposure → CerealStarch variable; positive if either component was positive
- An AnyDairy variable was created for exposure to any dairy product, including cow’s milk formula.
For binary variables reflecting current exposure to a food, medication, or ingredient, a second binary variable was generated reflecting lifetime exposure to that food, medication, or ingredient (exposure at any point prior).
Sample size for all binary variables is listed in Table S6.
Continuous variables (day of life, maternal weight gain, gestational age, weight) were log10-transformed prior to statistical analysis. Sample size for all continuous variables is 402.
Sequence Data Processing
A predetermined minimum sequencing depth of 5 million raw reads (2.5 million forward/reverse) per sample was required for inclusion in the study. Reads were trimmed using Trimmomatic (trimmomatic/0.33, minimum length = 60), and human DNA contamination was removed using Deconseq (Deconseq/0.4.3-chr38). We used MetaPhLan 2 (metaphlan2/2.2.0)46 to extract taxonomic data, and HUMAnN2 (humann2/0.9.4)47 to identify microbial functions. All taxonomic data is reported as relative abundance; all functional data was normalized to counts per million using the humann2_renorm_table function. Full details are below.
Quality control
Only samples with >2.5M raw reads in each direction (>5M total raw reads) were included in this study. Fig. S7 shows reads by subject age (months) and the distribution of samples included in the study by age in months There was no systematic bias in raw reads by age. Neonates and infants <3 months had fewer successful samples than infants 3–8 months of age, with neonates having the lowest number of samples that met our quality threshold. The median number of raw reads per sample was 11.3 million (IQR 6.3 million); the median number of reads following trimming and filtering human DNA was 9.2 million (IQR 5.6 million).
We trimmed reads using Trimmomatic48 (trimmomatic/0.33), with the following specifications
PE –phred33
SLIDINGWINDOW:6:10
LEADING:13
TRAILING:13
MINLEN:60
We eliminated human sequences using Deconseq/0.4.3-chr3849. All analyses were performed on trimmed and decontaminated samples. Decontaminated sequence data was publicly deposited to protect the privacy of human subjects (Bioproject ID PRJNA473126, accession codes SAMN09259835-SAMN09260236).
Taxonomic data extraction
We used MetaPhlAn246 (metaphlan2/2.2.0) to extract taxonomic data from quality-filtered reads, with the following specifications
-
--
mpa_pkl ${mpa_dir}/db_v20/mpa_v20_m200.pkl
-
--
bowtie2db ${mpa_dir}/db_v20/mpa_v20_m200
Control samples (both a negative control and a positive control from a Zymo community standard) were included in all sequencing runs; the community standard failed in the fifth run. There were no taxa identified from the negative control samples. Although there was some bias in the community standard (gram negative organisms overrepresented, gram positive underrepresented), likely reflective of bias in DNA extraction, the results were highly reproducible, which is reassuring for analysis of longitudinal trends. There were small proportions (relative abundance <0.1%) of taxa identified in the community standard sample that were not part of the theoretical community composition: Nauvomozyma unclassified, Pantoea unclassified, and Eremothecium unclassified (Table S8). Nauvomozyma and Eremothecium were not identified in any fecal samples, and Pantoea unclassified was only found in a relatively small number of fecal samples (N=73 out of 402). There were no taxa identified in the negative control sample. Community standard and negative control results did not suggest any systemic contamination.
Functional data extraction
We used Humann247 (humann2/0.9.4) to identify genes and functional pathways from short-read data, with the following specifications.
-
--
input-format fastq
-
--
search-mode uniref50
-
--
bypass-translated-search
-
--
bypass-prescreen
-
--
gap-fill off
We used the function humann2_renorm_table to convert gene and pathway output into normalized counts per million.
All models are performed on community-wide counts of MetaCyc-identified functional pathways47,50. Individual pathways contributing to aggregate families are detailed in Table S2. The proportion of functional pathways identified as homologous to specific genera are summarized in Table S4. In order to model the abundance of pathways related to synthesis of a specific metabolite (e.g. clinical predictors of arginine synthetic pathway abundance instead of just the abundance of arginine synthesis I or arginine synthesis IV), pathways that were related to a specific metabolite were aggregated by summing the normalized community-wide abundance.
Statistical Analysis
Statistical analysis and generation of figures was performed in R using the vegan, ape, ggplot2, lme4, lmerTest, MuMin, and multcomp packages. Alpha-diversity is reported as the Shannon index, determined from species-level abundance using the vegan diversity() function. PCOA plots were generated from a Bray-Curtis dissimilarity matrix of family-level taxa generated using the vegan vegdist() and ape pcoa() functions. Sequential MANOVA was performed using the vegan adonis() function. All generalized linear mixed models (GLMMs) in this study are maximum-likelihood mixed models generated using the lme4 lmer() function, and Because the close resemblance between twins’ microbial communities represent an important potential confounding factor3,13,42, we controlled for twin status by including both Family and subject (Time | Subject) as mandatory random effects in all models.
Time, in log(days) was a mandatory fixed effect in all longitudinal GLMMs; all other fixed effects were back-fitted using a stepwise approach, according to the following schema. As the effects of some clinical variables (e.g. specific formula ingredients) on the developing gut microbiome are completely unknown, we began the model-fitting process agnostic to which variables would be significant and screened all variables for inclusion. To broadly screen for covariation between clinical variables and microbiome features, for every taxonomic or pathway variable, we created two arrays of metadata corresponding to the values above and below the median (relative abundance or normalized CPM). We then applied a two-tailed test to compare these two arrays (t-test for continuous variables and Fisher’s Exact test for binary variables) and included all metadata variables with a screening p value <0.05 in a first-approximation GLMM. Because of the potential effects of Cesarean delivery and breastfeeding on the developing microbiome, they were always included in the first-approximation GLMM, even if they did not pass the screening test.
Maternal weight variables represented a special case, with multiple potential confounding variables15,31,32,35,51–53. GWG would ideally be classified as normal, inadequate, or excessive according to maternal pre-pregnancy BMI and estimated gestational age of delivery, according to Institute of Medicine guidelines54. However, such calculations are established only for singleton pregnancies, with provisional guidelines available for total weight gain in twin gestation. Thus, in our twin population, we attempted to control for confounding variables such as pre-pregnancy BMI, gestational age, maternal diabetes, and preeclampsia, by modifying our model selection pathway so that pre-pregnancy BMI and gestational age at delivery were always included in our first-approximation GLMM, even if they did not pass the initial screening test. The GWG distribution in our cohort roughly corresponded with provisional IOM guidelines for GWG in twin pregnancies (16.8–24.5kg for normal pre-pregnancy BMI, 14.1–22.7 kg for overweight pre-pregnancy BMI, 11–3-19.1 kg for obese pre-pregnancy BMI)54. All mothers with inadequate GWG were in the first quartile of our population (2–15kg), while the fourth quartile from our population (26–33kg) represented excessive weight gain irrespective of pre-pregnancy BMI. Additional information found in Table S1.
First-approximation GLMM was then back-fitted with the lmerTest step() function, and the MuMin rsquaredGLMM() function as a preferred post-hoc test for goodness of fit. All p values are two-tailed, and are adjusted for multiple comparisons using the multcomp glht() function (tension = Tukey)55. Parameters for all GLMMs are in Table S1, and statistically significant coefficients are summarized in Table S5. Full details are below.
Statistical Modeling:
All maximum-likelihood longitudinal generalized linear mixed models were constructed using the lme4, lmerTest, MuMin, and multcomp packages in R. For all taxonomic and functional pathways, the model formulae took the format of:
lmer(PathwayOrTaxon ~ (1 | Family) + (0 + log(day of life) | Subject) + log (day of life) + x + y + …., REML=FALSE, data=df)
Family and (time | subject) were mandatory random effects and time was a mandatory fixed effect in all models.
Fixed effects were backfitted according to the following schema:
- Screening for candidate variables
- For each outcome variable of interest (pathway or taxon abundance), the median was determined.
- Two arrays of clinical variables were created; one associated with values above the median for the pathway or taxon of interest, and one associated with values below the median
- To screen for co-variation of clinical variables with the outcome variable of interest, a two-tailed t-test was done for all continuous clinical variables, and a two-tailed Fisher’s Exact test was done for all binary clinical variables. This screening test was performed to select candidate variables for inclusion in a longitudinal generalized linear mixed model (GLMM). No statistical conclusions were made based on this screening test, as this simple screen could not correct for repeated sampling over time, familial effects, and correction for confounding variables.
- All clinical variables with p<0.05 on initial t-test or Fisher’s Exact test screening were considered candidate variables for inclusion in the next naïve model-fitting set.
- Day of life, delivery route, and breastfeeding (>50%) were always included in the set of candidate variables, regardless of significance in the initial variable screening step.
- If any maternal weight variable (maternal pre-pregnancy BMI or maternal gestational weight gain) came through the initial screening step, then maternal pre-pregnancy BMI, maternal gestational weight gain, and infant gestational age at delivery were all included in the set of candidate variables, due to the potential for confounding effects.
- Naïve model fitting
- As binary variables were in two formats (current exposure to an ingredient vs lifetime exposure to an ingredient), two models were fitted: one for current exposure; one for lifetime exposure. Demographic variables (e.g. maternal age, infant birthweight, day of life) were included in all models
- If variables were supersets of other variables (e.g. “Maternal Peripartum antibiotics” is a superset of “Maternal Ampicillin” and “Maternal Cefazolin”), the supersets and subsets were not included in the same model; instead a specific model (with only subset variables) and a general model (with only superset variables) were created.
- Maximum-likelihood generalized linear models of all candidate variables identified in step 1 were created using the lmer() function in the lme4 package.
- The step() function in the lmerTest package was used to backfit maximum-likelihood generalized linear models (GLMMs) for all candidate variables, with a significance cutoff of 0.05 for retaining fixed effects.
- Pseudo-R2 was determined using r.squaredGLMM() in the MuMin package
- Testing for contribution of interaction terms
- If the correlation matrix of the output model showed any values >0.1 or < −0.1, between infant age and another variable, an interaction term for that variable and infant age (x * log(day of life)) was added to the set of candidate variables, and back-fitting with the step() function was repeated
- Pseudo-R2 was determined using r.squaredGLMM() in the MuMin package
- Model comparison
- The best model was selected from the set of backfitted models associated with a given outcome variable, which included a current-exposure model and a lifetime-exposure model. If superset/subset variables were part of the candidate set, then the current and/or lifetime-exposure models were also divided into specific and general models. Pseudo-R2 was prioritized as a post-hoc test to select the best model.
- Adjustment for multiple comparisons
- The glht() function in the multcomp package55 was used to adjust p values in the preferred model for multiple comparison (lincfit=mcp(tension=“Tukey”)).
Supplementary Material
ACKNOWLEDGMENTS
This work is supported in part by awards to G. Dantas through the Edward Mallinckrodt, Jr. Foundation (Scholar Award), and the National Institute of General Medical Sciences (NIGMS: http://www.nigms.nih.gov/) of the National Institutes of Health (NIH) under award number R01GM099538. A.M. Baumann-Dudenhoeffer was supported by the National Institutes of Diabetes and Digestive and Kidney Diseases (NIDDK) of the NIH under award number K08-DK102673. A.W. D’Souza received support from the Institutional Program Unifying Population and Laboratory-Based Sciences Burroughs Welcome Fund grant to Washington University. B.B. Warner and P.I. Tarr received support for the cohort and sample collection from the Children’s Discovery Institute of Washington University and St. Louis Children’s Hospital, and P.I. Tarr is supported by P30DK052574 (Biobank Core). P.I. Tarr, B.B. Warner, and G. Dantas are also supported in part by a grant from the Eunice Kennedy Shriver National Institute of Child Health & Human Development (https://www.nichd.nih.gov/) of the NIH under award number R01HD092414. The content is solely the responsibility of the authors and does not necessarily represent the official views of the funding agencies. We would like to thank E. Martin, B. Koebbe, and J. Hoisington-López from the Edison Family Center for Genome Sciences & Systems Biology at Washington University School of Medicine for technical support in high-throughput computing and sequencing. We would like to thank A.J. Gasparrini, B. Wang, and B. Berla, for technical assistance in experimental and computational protocol optimization for whole-metagenome shotgun sequencing of fecal samples. We would like to thank I.M. Ndao, N. Shaikh, S. Patel, B. Wang, and S.X. Sun for archival and maintenance of frozen fecal sample inventory. We would like to thank F.S. Cole, MD and members of the Dantas lab for general helpful discussions regarding the research presented in this manuscript, and K. Guilonard, DO for helpful comments on the text.
Sequence data supporting these findings have been deposited, along with relevant clinical metadata, in the SRA under Bioproject ID PRJNA473126 (https://www.ncbi.nlm.nih.gov/bioproject/PRJNA473126), with the primary accession codes SAMN09259835-SAMN09260236 (https://trace.ncbi.nlm.nih.gov/Traces/sra/?study=SRP148966).
Footnotes
ACCESSSION CODES
R code is described in the Online Methods, and sample code is available at https://bitbucket.org/alaricwdsouza/twindiet/src/master/TwinDiet_ModelFittingExample.R
COMPETING FINANCIAL INTERESTS STATEMENT
The authors declare that they have no competing financial interests.
Data availability
Sequence data supporting these findings have been deposited, along with relevant clinical metadata, in the SRA under Bioproject ID PRJNA473126 (https://www.ncbi.nlm.nih.gov/bioproject/PRJNA473126), with the primary accession codes SAMN09259835-SAMN09260236 (https://trace.ncbi.nlm.nih.gov/Traces/sra/?study=SRP148966). Source data for the figures in the main text are available online. Any additional data generated and analyzed in this study are available from the corresponding author upon reasonable request.
Code Availability
Example code is available at https://bitbucket.org/alaricwdsouza/twindiet/src/master/TwinDiet_ModelFittingExample.R
Reporting Summary
Additional experimental design specifications are available in the linked Nature Research Life Sciences Reporting Summary.
References
- 1.Indrio F , et al. Epigenetic Matters: The Link between Early Nutrition, Microbiome, and Long-term Health Development. Front Pediatr 5, 178 (2017). [DOI] [PMC free article] [PubMed] [Google Scholar]
- 2.Clemente JC, Ursell LK, Parfrey LW & Knight R The impact of the gut microbiota on human health: an integrative view. Cell 148, 1258–1270 (2012). [DOI] [PMC free article] [PubMed] [Google Scholar]
- 3.Yatsunenko T , et al. Human gut microbiome viewed across age and geography. Nature 486, 222–227 (2012). [DOI] [PMC free article] [PubMed] [Google Scholar]
- 4.Bäckhed F , et al. Dynamics and Stabilization of the Human Gut Microbiome during the First Year of Life. Cell Host Microbe 17, 852 (2015). [DOI] [PubMed] [Google Scholar]
- 5.Oozeer R , et al. Intestinal microbiology in early life: specific prebiotics can have similar functionalities as human-milk oligosaccharides. Am J Clin Nutr 98, 561S-571S (2013). [DOI] [PubMed] [Google Scholar]
- 6.de Weerth C, Fuentes S, Puylaert P & de Vos WM Intestinal microbiota of infants with colic: development and specific signatures. Pediatrics 131, e550-558 (2013). [DOI] [PubMed] [Google Scholar]
- 7.Del Chierico F , et al. Gut microbiota profiling of pediatric nonalcoholic fatty liver disease and obese patients unveiled by an integrated meta-omics-based approach. Hepatology 65, 451–464 (2017). [DOI] [PubMed] [Google Scholar]
- 8.Arumugam M , et al. Enterotypes of the human gut microbiome. Nature 473, 174–180 (2011). [DOI] [PMC free article] [PubMed] [Google Scholar]
- 9.Yang B, Feng L, Wang F & Wang L Enterohemorrhagic Escherichia coli senses low biotin status in the large intestine for colonization and infection. Nat Commun 6, 6592 (2015). [DOI] [PMC free article] [PubMed] [Google Scholar]
- 10.Badurdeen S, Mulongo M & Berkley JA Arginine depletion increases susceptibility to serious infections in preterm newborns. Pediatr Res 77, 290–297 (2015). [DOI] [PMC free article] [PubMed] [Google Scholar]
- 11.Zhou P, Li Y, Ma LY & Lin HC The Role of Immunonutrients in the Prevention of Necrotizing Enterocolitis in Preterm Very Low Birth Weight Infants. Nutrients 7, 7256–7270 (2015). [DOI] [PMC free article] [PubMed] [Google Scholar]
- 12.Schwarzenberg SJ, Georgieff MK & NUTRITION CO Advocacy for Improving Nutrition in the First 1000 Days to Support Childhood Development and Adult Health. Pediatrics 141(2018). [DOI] [PubMed] [Google Scholar]
- 13.Planer JD , et al. Development of the gut microbiota and mucosal IgA responses in twins and gnotobiotic mice. Nature 534, 263–266 (2016). [DOI] [PMC free article] [PubMed] [Google Scholar]
- 14.Zhang Z, Adelman AS, Rai D, Boettcher J & Lőnnerdal B Amino acid profiles in term and preterm human milk through lactation: a systematic review. Nutrients 5, 4800–4821 (2013). [DOI] [PMC free article] [PubMed] [Google Scholar]
- 15.Chu DM , et al. Maturation of the infant microbiome community structure and function across multiple body sites and in relation to mode of delivery. Nat Med 23, 314–326 (2017). [DOI] [PMC free article] [PubMed] [Google Scholar]
- 16.Butteiger DN , et al. Soy Protein Compared with Milk Protein in a Western Diet Increases Gut Microbial Diversity and Reduces Serum Lipids in Golden Syrian Hamsters. J Nutr 146, 697–705 (2016). [DOI] [PubMed] [Google Scholar]
- 17.Yassour M , et al. Natural history of the infant gut microbiome and impact of antibiotic treatment on bacterial strain diversity and stability. Sci Transl Med 8, 343ra381 (2016). [DOI] [PMC free article] [PubMed] [Google Scholar]
- 18.Agostoni C, Carratù B, Boniglia C, Riva E & Sanzini E Free amino acid content in standard infant formulas: comparison with human milk. J Am Coll Nutr 19, 434–438 (2000). [DOI] [PubMed] [Google Scholar]
- 19.Sharon G , et al. Specialized metabolites from the microbiome in health and disease. Cell Metab 20, 719–730 (2014). [DOI] [PMC free article] [PubMed] [Google Scholar]
- 20.Haschke-Becher E, Kainz A & Bachmann C Reference values of amino acids and of common clinical chemistry in plasma of healthy infants aged 1 and 4 months. J Inherit Metab Dis 39, 25–37 (2016). [DOI] [PubMed] [Google Scholar]
- 21.Piacentini G, Peroni D, Bessi E & Morelli L Molecular characterization of intestinal microbiota in infants fed with soymilk. J Pediatr Gastroenterol Nutr 51, 71–76 (2010). [DOI] [PubMed] [Google Scholar]
- 22.Vázquez L, Flórez AB, Guadamuro L & Mayo B Effect of Soy Isoflavones on Growth of Representative Bacterial Species from the Human Gut . Nutrients 9(2017). [DOI] [PMC free article] [PubMed] [Google Scholar]
- 23.Li S , et al. Continuously Ingesting Fructooligosaccharide Can’t Maintain Rats’ Gut Bifidobacterium at a High Level. J Food Sci 80, M2530-2534 (2015). [DOI] [PubMed] [Google Scholar]
- 24.Bhatia J, Greer F & Nutrition AA o.P.C.o. Use of soy protein-based formulas in infant feeding. Pediatrics 121, 1062–1068 (2008). [DOI] [PubMed] [Google Scholar]
- 25.Vandenplas Y Prevention and Management of Cow’s Milk Allergy in Non-Exclusively Breastfed Infants. Nutrients 9(2017). [DOI] [PMC free article] [PubMed] [Google Scholar]
- 26.Bauchart-Thevret C, Stoll B, Chacko S & Burrin DG Sulfur amino acid deficiency upregulates intestinal methionine cycle activity and suppresses epithelial growth in neonatal pigs. Am J Physiol Endocrinol Metab 296, E1239-1250 (2009). [DOI] [PMC free article] [PubMed] [Google Scholar]
- 27.Choe EK, Moon JS & Park KJ Methionine enhances the contractile activity of human colon circular smooth muscle in vitro. J Korean Med Sci 27, 777–783 (2012). [DOI] [PMC free article] [PubMed] [Google Scholar]
- 28.Neis EP, Dejong CH & Rensen SS The role of microbial amino acid metabolism in host metabolism. Nutrients 7, 2930–2946 (2015). [DOI] [PMC free article] [PubMed] [Google Scholar]
- 29.Alsaker KV, Paredes C & Papoutsakis ET Metabolite stress and tolerance in the production of biofuels and chemicals: gene-expression-based systems analysis of butanol, butyrate, and acetate stresses in the anaerobe Clostridium acetobutylicum. Biotechnol Bioeng 105, 1131–1147 (2010). [DOI] [PubMed] [Google Scholar]
- 30.Vitreschak AG, Rodionov DA, Mironov AA & Gelfand MS Regulation of riboflavin biosynthesis and transport genes in bacteria by transcriptional and translational attenuation. Nucleic Acids Res 30, 3141–3151 (2002). [DOI] [PMC free article] [PubMed] [Google Scholar]
- 31.Stanislawski MA , et al. Pre-pregnancy weight, gestational weight gain, and the gut microbiota of mothers and their infants. Microbiome 5, 113 (2017). [DOI] [PMC free article] [PubMed] [Google Scholar]
- 32.Collado MC, Isolauri E, Laitinen K & Salminen S Effect of mother’s weight on infant’s microbiota acquisition, composition, and activity during early infancy: a prospective follow-up study initiated in early pregnancy. Am J Clin Nutr 92, 1023–1030 (2010). [DOI] [PubMed] [Google Scholar]
- 33.Antony KM , et al. The preterm placental microbiome varies in association with excess maternal gestational weight gain. Am J Obstet Gynecol 212, 653e651-616 (2015). [DOI] [PMC free article] [PubMed] [Google Scholar]
- 34.Ma J , et al. High-fat maternal diet during pregnancy persistently alters the offspring microbiome in a primate model. Nat Commun 5, 3889 (2014). [DOI] [PMC free article] [PubMed] [Google Scholar]
- 35.Hu J , et al. Diversified microbiota of meconium is affected by maternal diabetes status. PLoS One 8, e78257 (2013). [DOI] [PMC free article] [PubMed] [Google Scholar]
- 36.Prince AL , et al. The perinatal microbiome and pregnancy: moving beyond the vaginal microbiome. Cold Spring Harb Perspect Med 5(2015). [DOI] [PMC free article] [PubMed] [Google Scholar]
- 37.Sacchetti R, De Luca G, Dormi A, Guberti E & Zanetti F Microbial quality of drinking water from microfiltered water dispensers. Int J Hyg Environ Health 217, 255–259 (2014). [DOI] [PubMed] [Google Scholar]
- 38.Dias MF , et al. Changes in mouse gut bacterial community in response to different types of drinking water. Water Res 132, 79–89 (2017). [DOI] [PubMed] [Google Scholar]
- 39.Poroyko V , et al. Gut microbial gene expression in mother-fed and formula-fed piglets. PLoS One 5, e12459 (2010). [DOI] [PMC free article] [PubMed] [Google Scholar]
- 40.Charbonneau MR , et al. Sialylated Milk Oligosaccharides Promote Microbiota-Dependent Growth in Models of Infant Undernutrition. Cell 164, 859–871 (2016). [DOI] [PMC free article] [PubMed] [Google Scholar]
Methods-Only References
- 41.Lim ES , et al. Early life dynamics of the human gut virome and bacterial microbiome in infants. Nat Med 21, 1228–1234 (2015). [DOI] [PMC free article] [PubMed] [Google Scholar]
- 42.Moore AM , et al. Gut resistome development in healthy twin pairs in the first year of life. Microbiome 3, 27 (2015). [DOI] [PMC free article] [PubMed] [Google Scholar]
- 43.Gurnee EA , et al. Gut colonization of healthy children and their mothers with pathogenic ciprofloxacin-resistant Escherichia coli. J Infect Dis (2015). [DOI] [PMC free article] [PubMed] [Google Scholar]
- 44.Gibson MK , et al. Developmental dynamics of the preterm infant gut microbiota and antibiotic resistome. Nat Microbiol 1, 16024 (2016). [DOI] [PMC free article] [PubMed] [Google Scholar]
- 45.Fein SB , et al. Infant Feeding Practices Study II: study methods. Pediatrics 122 Suppl 2, S28-35 (2008). [DOI] [PubMed] [Google Scholar]
- 46.Segata N , et al. Metagenomic microbial community profiling using unique clade-specific marker genes. Nat Methods 9, 811–814 (2012). [DOI] [PMC free article] [PubMed] [Google Scholar]
- 47.McHardy IH , et al. Integrative analysis of the microbiome and metabolome of the human intestinal mucosal surface reveals exquisite inter-relationships. Microbiome 1, 17 (2013). [DOI] [PMC free article] [PubMed] [Google Scholar]
- 48.Bolger AM, Lohse M & Usadel B Trimmomatic: a flexible trimmer for Illumina sequence data. Bioinformatics 30, 2114–2120 (2014). [DOI] [PMC free article] [PubMed] [Google Scholar]
- 49.Schmieder R & Edwards R Fast identification and removal of sequence contamination from genomic and metagenomic datasets. PLoS One 6, e17288 (2011). [DOI] [PMC free article] [PubMed] [Google Scholar]
- 50.Abubucker S , et al. Metabolic reconstruction for metagenomic data and its application to the human microbiome. PLoS Comput Biol 8, e1002358 (2012). [DOI] [PMC free article] [PubMed] [Google Scholar]
- 51.Chu DM , et al. The early infant gut microbiome varies in association with a maternal high-fat diet. Genome Med 8, 77 (2016). [DOI] [PMC free article] [PubMed] [Google Scholar]
- 52.Robinson A , et al. Association of Maternal Gestational Weight Gain With the Infant Fecal Microbiota. J Pediatr Gastroenterol Nutr 65, 509–515 (2017). [DOI] [PMC free article] [PubMed] [Google Scholar]
- 53.Singh S, Karagas MR & Mueller NT Charting the Maternal and Infant Microbiome: What Is the Role of Diabetes and Obesity in Pregnancy? Curr Diab Rep 17, 11 (2017). [DOI] [PMC free article] [PubMed] [Google Scholar]
- 54.Gynecologists AC o.O.a. ACOG Committee opinion no. 548: weight gain during pregnancy. Obstet Gynecol 121, 210–212 (2013). [DOI] [PubMed] [Google Scholar]
- 55.Joo JW, Hormozdiari F, Han B & Eskin E Multiple testing correction in linear mixed models. Genome Biol 17, 62 (2016). [DOI] [PMC free article] [PubMed] [Google Scholar]
Associated Data
This section collects any data citations, data availability statements, or supplementary materials included in this article.