

Abstract
Germinal center (GC) B cells feature repression of many gene enhancers to establish their characteristic transcriptome. Here we show that conditional deletion of Lsd1 in GCs significantly impaired GC formation, associated with to failure to repress immune synapse genes linked to GC exit, which are also direct targets of the BCL6 transcriptional repressor. We found that BCL6 directly binds and recruits LSD1, primarily to intergenic and intronic enhancers. Conditional deletion of Lsd1 suppressed GC hyperplasia caused by constitutive expression of Bcl6, and significantly delayed Bcl6-driven lymphomagenesis. Administration of LSD1 catalytic inhibitors had little effect on GC formation or GC derived lymphoma cells. Using a CRISPR/Cas9 domain screen we found instead that the LSD1 Tower domain was critical for LSD1 dependency in GC derived B cells. These results indicate an essential role of LSD1 in the humoral immune response, where it modulates enhancer function by forming repression complexes with BCL6.
INTRODUCTION
Germinal centers (GCs) are dynamic structures induced by T cell-dependent antigen stimulation during the humoral immune response, to enable immunoglobulin affinity maturation1. GC B cells manifest a unique phenotype that includes features such as massive proliferation and tolerance of genomic damage occurring as a byproduct of somatic hypermutation2. The transition from resting, quiescent B cells to GC B cells requires multilayered chromatin reorganization and the coordinated action of multiple transcription factors3, 4, 5, 6, 7, 8, 9, 10.
One of the dominant regulatory mechanisms involved in setting up the GC B cell phenotype is the transient transcriptional repression of gene promoters and enhancers involved in terminal differentiation, as well as genes involved in chemotaxis and DNA damage and proliferation checkpoints. Histone-modifying enzymes such as CREBBP, EP300 and KMT2D all play important roles in regulating the switching of enhancers on and off in GC B cells through histone 3 lysine 27 (H3K27) acetylation and H3K4 monomethylation respectively7, 8, 9, 10. The polycomb protein EZH2 mediates promoter poising by creating bivalent chromatin domains at checkpoint and differentiation genes3, 4. The BCL6 transcriptional repressor helps to coordinate enhancer and promoter pausing through recruitment of corepressor proteins6. The proliferative and genetically unstable nature of GC B cells makes them prone to malignant transformation. Most B cell lymphomas accordingly arise from GC B cells and often share dependencies on the same transcriptional regulators (e.g. such as BCL6).
Recent studies of gene enhancer chromatin during the GC reaction unveiled a specific pattern of enhancer erasing and rewriting involving loss of H3K4me1/2 in about 2,800 sites5, suggesting that histone demethylases likely contribute to the GC reaction. The first histone demethylase to be discovered, LSD1 (Lysine(K)-Specific Demethylase 1A encoded by KDM1A in humans and Kdm1a in mice), specifically catalyzes demethylation of H3K4me1/211. Lsd1 deletion results in developmental arrest and is lethal at early embryonic stages12, 13, 14. However, many of its cell context specific functions remain unknown. It was recently shown that inducible deletion of Lsd1 in early hematopoietic stem cells (HSCs) perturbs differentiation and terminal blood cell maturation resulting in pancytopenia15. LSD1 overexpression has been observed in many tumor types such as bladder, colorectal, breast and small cell lung cancer, and high LSD1 expression may function as biomarker for disease aggressiveness. In acute myeloid leukemia (AML), LSD1 was shown to maintain leukemic stem cells and LSD1 inhibition was shown to promote differentiation16. Here we explore the role of LSD1 in GC formation and the humoral immune response.
RESULTS
LSD1 is required for the humoral immune response
To identify histone demethylases that might repress enhancers in GC B-cells we first mined RNA-seq data profiles to determine expression of the two known families of H3K4 demethylases (KDM1 and KDM5) in naïve B (NB) versus GC B cells in humans and mice. LSD1 was the most consistently upregulated from NB to GC B cells (Fig. 1a, Supplementary Fig. 1a). We confirmed this result by qPCR in purified human NB vs. GC B cells, where we observed two-fold LSD1 induction along with the expected upregulation of BCL6 and AICDA (Fig. 1b, Supplementary Fig. 1b) and LSD1 immunoblots showing a similar degree of upregulation (Fig. 1c). Immunohistochemistry (IHC) of tonsil sections showed higher LSD1 expression in GCs, especially in the proliferative dark zone (Supplementary Fig. 1c). Lsd1 expression was maintained in post GC B cells such as plasmacytes and memory B cells (Supplementary Fig. 1d).
Figure 1. LSD1 is essential for GC formation and robust humoral immune response.
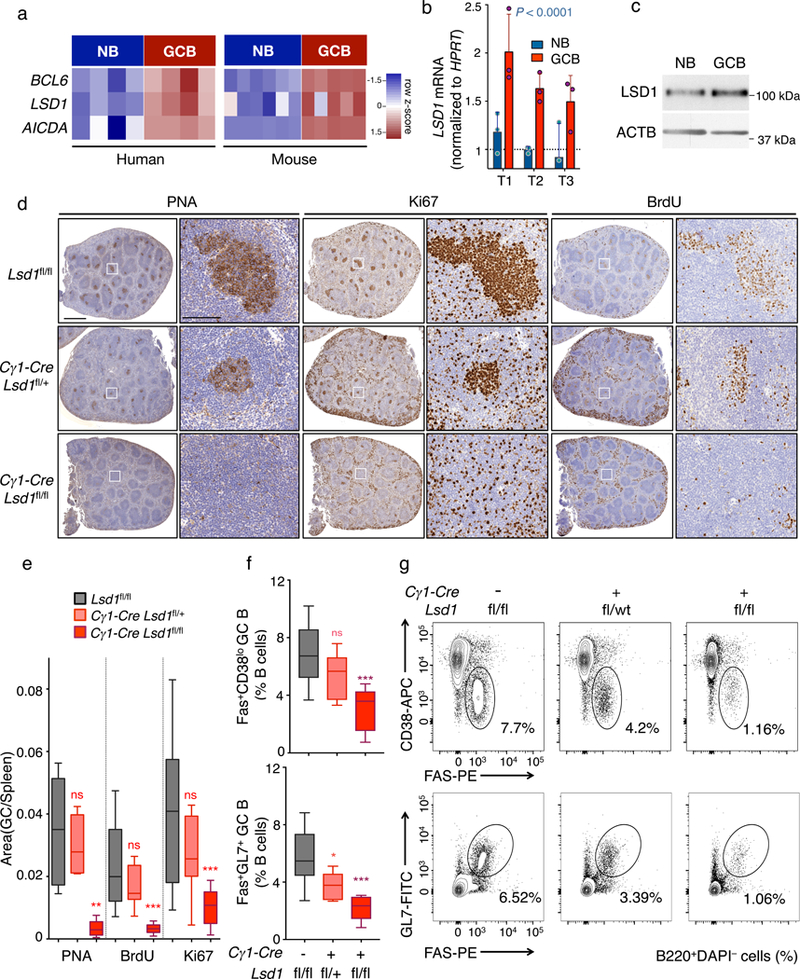
a) RNA-seq analysis showing BCL6, LSD1 and AICDA mRNA abundance in human and mouse NB vs GC B cells visualized by heatmap based on row FPKM (Fragments Per Kilobase of transcript per Million mapped reads) z-scores. Data from biologically independent human (n= 4 Naïve B (NB), n= 4 GC B samples) or mouse RNA-seq (n= 6 Naïve B, n= 5 GC B) samples b) Fold LSD1 mRNA levels (mean ± s.d.) in NB and GC B cells isolated from three biologically independent reactive human tonsils (T1, T2, T3) normalized to HPRT (triplicate qPCR reactions). P value was calculated by two-way ANOVA. c) LSD1 immunoblot (cropped image) from NB and GC B cells isolated from human tonsils. Actin served as protein loading control. Data are representative of two independent experiments with similar results. d) Immunohistochemistry of spleen sections from Lsd1fl/fl, Cγ1-Cre Lsd1fl/+ or Cγ1-Cre Lsd1fl/fl immunized with SRBC and sacrificed 10 d post immunization stained with PNA, Ki67, and BrdU at two magnifications (Scale bars: 1 mm, 100 μm). Images representative of more than 10 spleen sections. e) Quantification of PNA, Ki67 and BrdU staining from (d). The GC area versus the total spleen section area is the quantified area of PNA stained regions versus the total area of each spleen section. Data from n= 12 Lsd1fl/fl, n=11 Cγ1-Cre Lsd1fl/+ and n=10 Cγ1-Cre Lsd1fl/fl biologically independent mice. f-g) Flow cytometry analysis of mouse GC splenocytes populations calculated as percent of GC B cells (Fas+CD38lo or Fas+GL7+) within live B cells (B220+) (f). The gated areas in representative flow cytometry dotplots (g) show the corresponding GC B cell population within live B cells (B220+ DAPI–). Data from n= 10 Lsd1fl/fl, n= 9 Cγ1-Cre Lsd1fl/+ and n= 9 Cγ1-Cre Lsd1fl/fl biologically independent mice. Boxplots are shown as median, interquartile range, and minimum to maximum (e,f).P values indicate comparison to Lsd1fl/fl mice by two-sided unpaired t-test (e,f) (*P < 0.05, **P < 0.01, ***P < 0.001).
We next asked if LSD1 is required for the development of GCs. We crossed conditional Lsd1fl/fl mice15 with the Cγ1-Cre strain, which expresses Cre recombinase in GC B cells. Next we immunized Lsd1fl/fl, Cγ1-Cre Lsd1fl/+ or Cγ1-Cre Lsd1fl/fl conditional mice with T cell-dependent antigen (sheep red blood cells, SRBCs) to induce GC formation and analyzed the composition of their spleens 10 days later. Conditional homozygous and heterozygous Lsd1 deletion in GCs, resulted in a marked and gene-dose dependent reduction in GCs as shown by IHC using peanut agglutinin (PNA, Fig. 1d,e) without any perturbation of B cell follicular structure as shown by B220 IHC (Supplementary Fig. 1e). The numbers of splenic GCs formed were markedly reduced in LSD1-deficient mice (Supplementary Fig. 1f). Concordant with the reduction in GC B cells, we observed a dose-dependent reduction in Ki67+ (Fig. 1d,e) and bromodeoxyuridine positive (BrdU+) cells after injection with BrdU 4 h prior to euthanasia at day 10 post-antigen challenge (Fig. 1d,e).
Using flow cytometry staining to quantify relative abundance of GC B cells (Fas+GL7+B220+ and Fas+CD38loB220+) we observed dose dependent and significant loss of GC B cells in Lsd1-deficient mice (Fig. 1f,g). Lsd1 locus amplification from sorted GC B cells from Lsd1fl/fl or Cγ1-Cre Lsd1fl/fl mice confirmed loss of LSD1 in these residual cells (Supplementary Fig. 1g), and prompted us to monitor the GC reaction in Lsd1fl/fl vs. Cγ1-Cre Lsd1fl/fl mice every two days, starting 4 days post antigen challenge. Although control Lsd1fl/fl animals showed robust GC formation at days 6, 8 and 10, Cγ1-Cre Lsd1fl/fl mice showed a severe loss of their ability to mount a full-blown GC response and most of the incipient GC B cells were cleared within 10 days post-antigen challenge (Supplementary Fig. 1h,i). Hence, Lsd1 is required to support the expansion of newly forming GCs.
To assess the impact of Lsd1 loss of function on immunoglobulin affinity maturation, we challenged Lsd1fl/fl and Cγ1-Cre Lsd1fl/fl with NP30-CGG, followed with a boost immunization at day 21. Measurement of high-affinity (binding NP7-BSA) or low-affinity serum antibodies (binding NP30-BSA) by ELISA revealed significantly lower high affinity IgG1 titers (P value = 0.0007) in conditional Lsd1-deficient mice (Supplementary Fig. 1j). The ratio of high-affinity to low-affinity IgG1, IgG2b and IgG3 circulating antibody titers were also reduced (Supplementary Fig. 1k). In addition, long-lived plasma cells secreting class switched anti-NP immunoglobulins were markedly reduced in Cγ1-Cre Lsd1fl/fl mice vs. Lsd1fl/fl 40 days after their primary immunization as shown by ELISpot (Supplementary Fig. 1l).
These results raised the possibility that Lsd1 deletion earlier in B cell development might force premature differentiation to plasma cells or extrafollicular plasmablasts. To investigate this possibility we crossed conditional Lsd1fl/fl mice15 with Cd19-Cre mice expressing Cre recombinase in all B lymphocytes. These animals also manifested significantly reduced GC formation (Supplementary Fig. 2a,b) and significant depletion of GC B cells (Supplementary Fig. 2c-e). However, we did not observe spontaneous differentiation of B cells to downstream lineages such as plasmacytes (CD138+B220–) or plasmablasts (CD138+, κ+, B220–) in the absence of Lsd1 (Supplementary Fig. 2f,g). Taken together, these results indicate that Lsd1 plays an important role in GC formation and immunoglobulin affinity maturation.
LSD1 is a key mediator of the GC transcriptional program
To identify the LSD1 regulated transcriptome in GC B cells, we performed RNA-seq on sorted GC B-cells from three independent Lsd1fl/fl or Cγ1-Cre Lsd1fl/fl mice. We observed 120 genes significantly differentially expressed in Lsd1-deficient GC B cells (FDR<0.05, fold change>1.5), the majority of which were upregulated (n=87, Fig. 2a) including canonical plasma and memory cell differentiation genes such as Irf4 and Prdm1, as well as Cd80, which is important for B cell induction of follicular helper T (TFH) cells17, Cxcr3, which plays a critical role in plasma cell differentiation18 and Stat4, which induces plasma cell differentiation in GC B cells downstream of IL-1219. Lsd1 loss of function also yielded upregulation of Gpr132, a gene that suppresses the proliferation of B cells20.
Figure 2. LSD1 deletion alters the GC B cell transcription program.
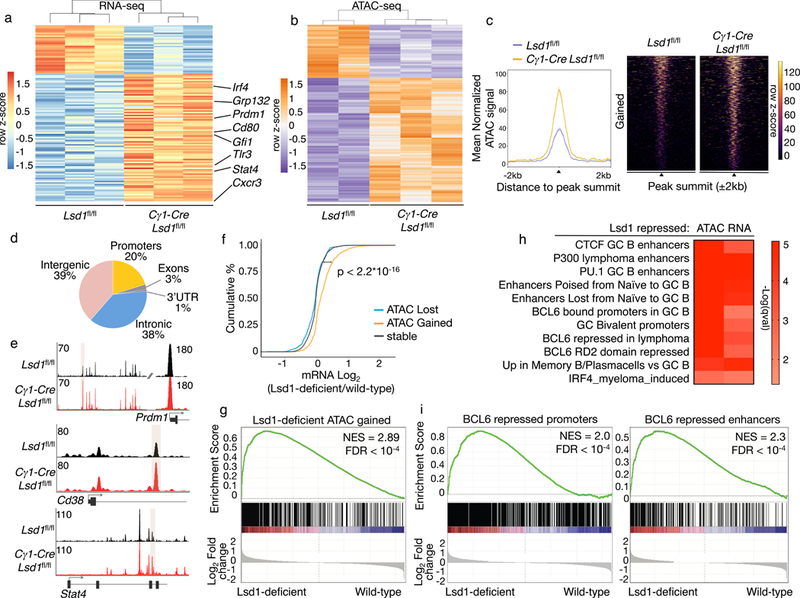
a) RNA-seq analysis of sorted GC B cells from biologically independent immunized conditional Lsd1fl/fl (n = 3) versus Cγ1-Cre Lsd1fl/fl (n = 3) mice. Heatmap represents row-based z-scores of DESeq2 normalized read counts for differentially expressed genes (FDR < 0.05, fold change > 1.5). b) Heatmap of differentially accessible ATAC-seq peaks (FDR < 0.05) from sorted GC B cells from biologically independent immunized Lsd1fl/fl (n = 2) versus Cγ1-Cre Lsd1fl/fl (n = 3) mice. Heatmap represents row based z-scores of DESeq2 normalized Tn5 insertion counts for each differentially accessible ATAC-seq peak. c) Mean normalized Tn5 insertion signal and heatmap of fragment density for loci gaining accessibility (FDR < 0.05) in ATAC-seq from GC B cells sorted from biologically independent immunized Lsd1fl/fl (n = 2) versus Cγ1-Cre Lsd1fl/fl (n = 3) mice. d) Genomic distribution of loci gaining accessibility in Lsd1-deficient cells compared to wild-type based on RefSeq. e) Examples of loci gaining accessibility in Lsd1-deficient cells compared to wild-type controls surrounding Prdm1, Cd38 and Stat4. Read density tracks from pooled replicates (n = 2 Lsd1fl/fl; n = 3 Cγ1-Cre Lsd1fl/fl). f) Cumulative distribution of log2 fold gene expression change values by proximity of the genes to differentially accessible loci that are closing, opening or remaining stable in Lsd1 deficient cells compared to wild-type controls. Data from biologically independent immunized Lsd1fl/fl (n = 2) versus Cγ1-Cre Lsd1fl/fl (n = 3) mice. P value was based on two-sided Kolmogorov-Smirnov test. g) GSEA analysis of genes linked to opening loci in Lsd1-deficient GC B cells versus wild-type using ranked gene expression changes induced by Lsd1 depletion in GC B cells in vivo. NES and FDR values as implemented by GSEA; based on 10,000 sample permutations. h) Gene pathway analysis of genes gaining accessibility upon Lsd1 deletion (ATAC) or genes upregulated by RNA-seq upon LSD1 deletion in GC B cells (RNA). Fisher exact test was used to calculate enrichment P values for each gene set and q values were calculated based on BH. i) GSEA analysis of genes targeted and repressed by BCL6 through their promoter or genes linked to BCL6 bound proximal enhancers that are upregulated upon BCL6 knockdown in lymphoma cells. Genes were ranked based on decreasing log2 fold gene expression changes comparing LSD1 deficient cells to wild-type GC B cells (NES and FDR values as implemented by GSEA, based on 10,000 sample permutations).
ATAC-seq in sorted viable GC B cells from Cγ1-Cre Lsd1fl/fl or Lsd1fl/fl mice revealed 733 loci with gained accessibility and 314 with reduced accessibility (FDR< 0.05, Fig. 2b,c). Loci that gained chromatin accessibility were mostly localized in intergenic and intronic regions (77%, Fig. 2d). Examples of genes linked to loci that gained accessibility included Prdm1 (FDR= 0.032), Cd38, a marker induced in memory B cells (intronic, FDR= 0.00045) and Stat4 (intronic, FDR= 0.02) (Fig. 2e). Notably gene transcripts linked to gained chromatin accessibility in Lsd1-deficient cells were significantly upregulated (Fig. 2f), whereas genes associated with loci with unaltered or reduced chromatin accessibility did not manifest significant differential expression. Along these lines, we observed significant enrichment for genes with increased chromatin accessibility (n= 610 genes) among those genes induced in Lsd1-deficient GC B cells (Fig. 2g).
Pathway analysis using curated genesets linked to normal and malignant B cell functions revealed significant enrichment for genes linked to silenced or poised enhancers in the transition from NB to GC B cells (Fig. 2h) as well as genes involved in the terminal differentiation of GC B cells into plasma cells and memory B cells (Fig. 2h). Also enriched were direct target genes of CTCF, EP300, and most notably genes directly bound and repressed by BCL6. In an orthogonal analysis we observed significant enrichment for genes repressed by BCL6 through promoter or enhancer binding among genes that are upregulated upon Lsd1 deletion in GC B cells (Fig. 2i)6. BCL6 contains two repressor domains, and Lsd1 deficient GC B-cells featured upregulation of genes repressed by BCL6 specifically through its RD2 repression domain [23]. Taken together, both the phenotypic and transcriptome data point to LSD1 as being functionally linked to the actions of BCL6, a factor required for GC formation due in part to its blockade of plasma cell differentiation and supporting proliferation.
BCL6 mediates LSD1 recruitment to its direct target genes
The data presented above suggest a functional connection between BCL6 and LSD1. To explore this possibility, we first tested whether BCL6 and LSD1 interact. We performed co-immunoprecipitation in DLBCL cells (OCI-Ly1, SUDHL4 and HBL1) and showed that LSD1 antibodies could precipitate BCL6, and reciprocally that BCL6 antibodies enrich LSD1 (Fig. 3a). We were also able to co-immunoprecipitate LSD1 and BCL6 in lysates from human tonsil-derived GC B cells (Fig. 3b). In addition, we performed in vitro histone demethylation assays using LSD1 or BCL6 immunoprecipitates and bulk core histones that bear the various post transcriptional modifications as substrates. As expected, precipitated LSD1 could demethylate H3K4me1 compared to actin control but BCL6 precipitates could also demethylate H3K4me1 in an LSD1-dependent manner, since a specific LSD1 inhibitor blocked BCL6 mediated histone demethylation (Fig. 3c, Supplementary Fig. 3a). To determine if BCL6-LSD1 interaction is direct, we performed protein affinity chromatography with bacterially expressed GST-LSD1 and in vitro synthetized BCL6. BCL6 was enriched by GST-LSD1 beads even with increasing concentrations of NaCl up to 350 mM, indicating direct and robust interaction between these proteins (Fig. 3d, Supplementary Fig. 3b).
Figure 3. LSD1 interacts with BCL6 in lymphoma cells.
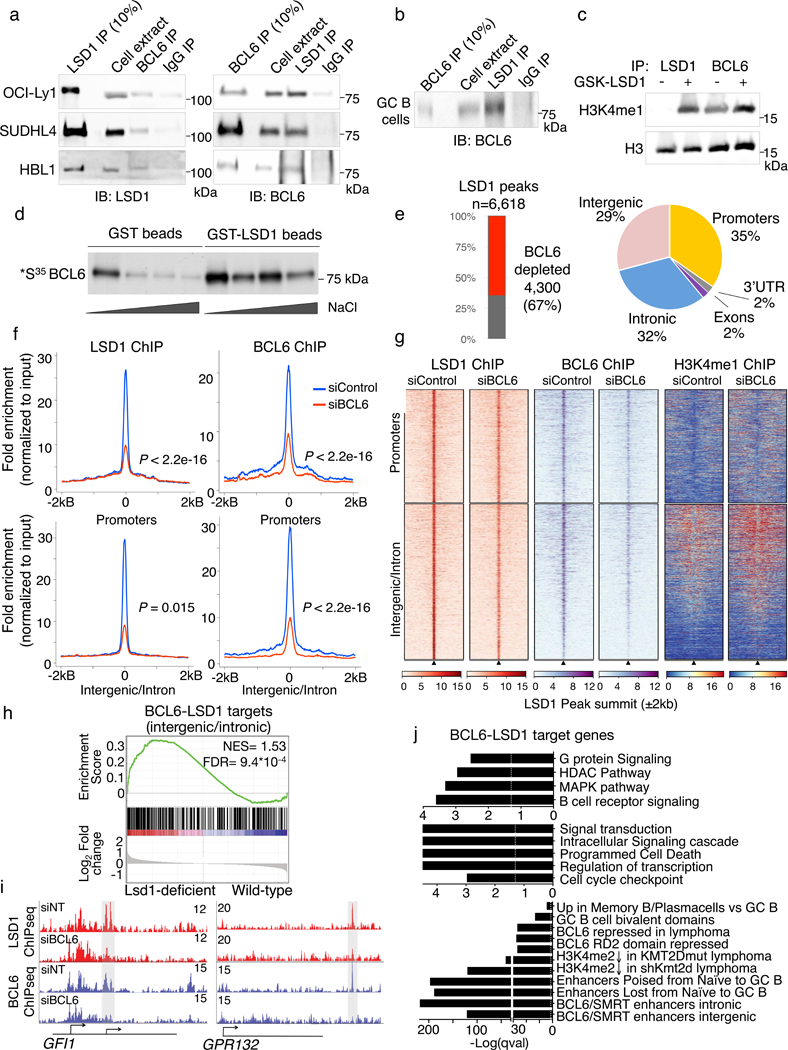
a) Reciprocal coimmunoprecipitation of BCL6 and LSD1 (cropped image) from lymphoma cell extracts from OCI-Ly1, SUDHL4 and HBL1 cells. IgG antibody served as a negative control. Experiments were performed at least 3 times with OCI-Ly1 twice with SUDHL4 and once with HBL1 cells. b) Coimmunoprecipitation of BCL6 and LSD1 in tonsil GC B cell extracts (cropped image). IgG antibody served as a negative control. Experiment was performed twice with similar result. c) H3 and H3K4me1 immunoblot of histone demethylation reactions (cropped image) from LSD1and BCL6 precipitates from lymphoma B cell extracts and bulk core histone substrates treated 1 μM GSK-LSD1 inhibitor or vehicle. Experiment was performed twice with similar result. d) GST-pull down assay using GST-LSD1 or GST alone as control. Purified proteins were incubated with radiolabelled BCL6 and washed with increasing NaCl concentration washes. Radioactive signal indicating interaction was captured by fluorography (cropped image). Experiment was performed at least twice with similar result. e) Breakdown of LSD1 significantly depleted peaks after BCL6 knockdown or LSD1 peaks unaltered after BCL6 depletion. Piechart indicates the genome-wide distribution of BCL6-dependent LSD1 peaks based on RefSeq. f) Fold enrichment of BCL6 and LSD1 ChIP-seq reads normalized to corresponding input in lymphoma cells treated with BCL6 siRNA or non-targeted control siRNA (P values were calculated by one-sided Kolomonov-Smirnoff test). Top panels show LSD1 peaks that occur in promoter regions (n= 2,557) and bottom panel show LSD1 peaks that are in intronic or intergenic regions (n= 3,503). g) Heatmaps showing LSD1, BCL6 and H3K4me1 ChIP-seq peak density surrounding LSD1 peaks in promoters and intergenic/intronic regions shown in (e) with BCL6 siRNA or non-targeted control siRNA. h) GSEA analysis based on genes ranked by decreasing log2 fold gene expression changes of LSD1-deficient cells versus wild-type controls using genesets linked to BCL6-LSD1 complexes through intronic or intergenic binding (NES and FDR as implemented by GSEA; based on 10,000 sample permutations). i) Examples of LSD1 and BCL6 ChIP-seq tracks surrounding the GFI1 and GPR132 promoter with or without siBCL6 treatment. Experiment was validated more than three times by qChIP. j) Pathway analysis of genes linked to BCL6 dependent LSD1 peaks. P values based on two-sided Fisher exact test for each gene set; FDR was calculated based on BH.
To determine whether LSD1 is associated with BCL6 on chromatin we characterized the genomic localization of LSD1 and its relationship to the BCL6 cistrome in GC-derived B cells using ChIP-seq. We identified 6,618 robust LSD1 peaks across replicate experiments (FC= 5, P value < 10−10). Notably, a majority of LSD1 peaks (4,300/6,618, 67%) were lost when BCL6 was depleted, suggesting BCL6 recruits LSD1 to these sites (Fig. 3e). 61% of these BCL6-dependent LSD1 peaks were localized to intronic and intergenic regions whereas 35% localized to promoters (Fig. 3e). Further analysis revealed significant reduction in BCL6 and LSD1 read counts at these sites after BCL6 siRNA (Fig. 3f,g). H3K4me1 ChIP-seq in BCL6 knockdown cells or controls showed that gain of this mark was more pronounced at intergenic and intronic BCL6-LSD1 peaks vs promoters, (Fig. 3g) while neighboring regions (−50 kb) were largely unaltered (Supplementary Fig. 3c). We confirmed that genomic loci occupied by BCL6 and LSD1 gained H3K4me1 upon BCL6 knockdown in an additional DLBCL cell line (SUDHL4, Supplementary Fig. 3d) and we showed that BCL6-LSD1 target sites also gain H3K4me2, another histone mark demethylated by LSD1 (Supplementary Fig. 3e).
We next tested whether genes directly bound by LSD1-BCL6 complexes were induced in Cγ1-Cre Lsd1fl/fl GC B cells. Indeed, genes with intronic or intergenic LSD1-BCL6 complexes were significantly enriched among those upregulated in Cγ1-Cre Lsd1fl/fl mice (Fig. 3h) as exemplified by GFI1 and GPR132 (Fig. 3i). BCL6-LSD1 targets were significantly enriched for genes linked to enhancers that are poised or lost from naïve B to GC B cells, genes with intronic and intergenic enhancers repressed by BCL6 in primary GC B cells and genes with enhancers activated by Kmt2d (Fig. 3j). Genes involved in plasma cell differentiation and GC exit such as B cell receptor signaling, signal transduction, MAPK signaling, cell cycle checkpoints, and programmed cell death were also enriched (Fig. 3j). These results suggest that LSD1 is a BCL6 corepressor, directly recruited by BCL6 to repress enhancers for genes involved in GC exit, terminal differentiation and proliferation.
LSD1 regulates GC B cell differentiation and BCL6 targets
To more thoroughly characterize the regulated transcriptome of LSD1, we next performed RNA-seq on human GC derived lymphoma cells transduced with two LSD1 shRNAs (Fig. 4a) or a control shRNA. We found that most differentially regulated genes (FC >1.5, FDR< 0.05) were upregulated (n= 472, 69%) by both LSD1 hairpins, while 213 genes (31%) were significantly downregulated (Fig. 4b,c). Consistent with our murine GC B cell Cγ1-Cre Lsd1fl/fl RNA-seq studies, we observed significant enrichment for the plasma/memory B cell differentiation signature and BCL6 target genes, including the RD2 domain controlled transcriptome (Fig. 4d). We also observed enrichment for genes controlled by KMT2D through enhancer and promoter H3K4 methylation, and the histone acetyltransferase CREBBP, both of which counteract BCL6 as B cells exit the GC reaction by activating enhancers required for terminal differentiation into plasma cells (Fig. 4d)7, 8, 9, 10.
Figure 4. Loss of LSD1 inhibits proliferation and lymphoma cell growth in vivo.
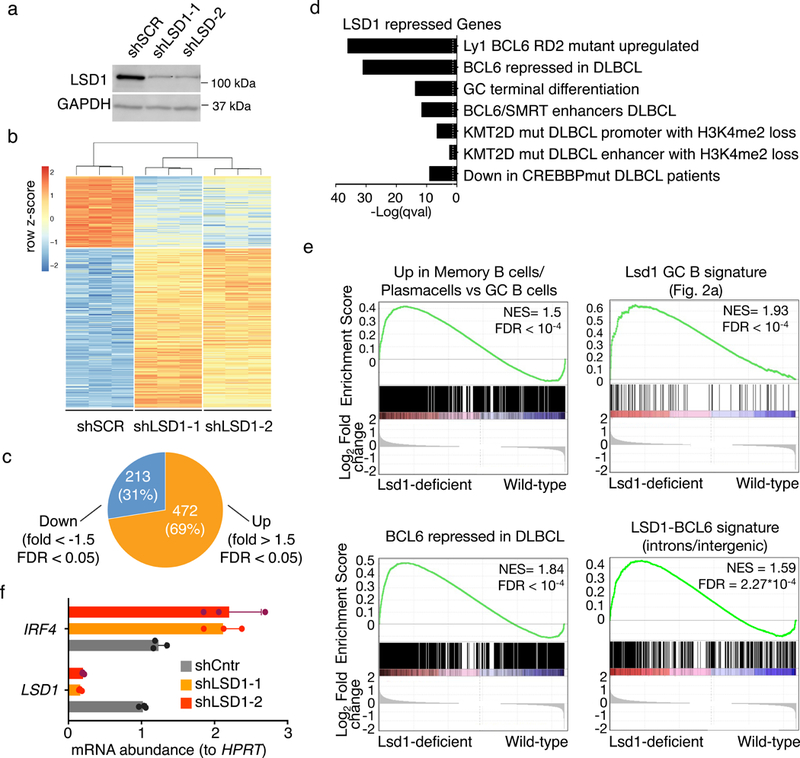
a) Cropped immunoblot for LSD1 in OCI-Ly1 cells transduced with control shRNA or two shRNA targeting LSD1. GAPDH was used as loading control. Data are representative of three independent experiments. b) Heat map representing the row z-scores of the expression value (DESeq2 normalized read counts) characterized by RNA-seq for genes differentially expressed between shLSD1–1 and shLSD1–2 versus control shRNA (FDR < 0.05, fold change > 1.5). Data from triplicate independent shRNA treated samples. c) Piechart of genes differentially expressed between shLSD1–1 and shLSD1–2 versus control shRNA GC B cells (FDR < 0.05, fold change >1.5) d) Gene ontology analysis and pathway analysis based on curated datasets of genes upregulated upon LSD1 depletion (FDR<0.05, fold change>1.5) in DLBCL cells. Fisher exact test was used to calculate enrichment P values for each gene set and FDR was calculated based on BH. e) GSEA analysis based on decreasing log2 fold gene expression changes comparing LSD1 knockdown DLBCL cells to cells with control shRNA using the following genesets i) genes upregulated in plasma cell and memory cells versus GC B cells ii) genes repressed by Lsd1 in GC B cells in vivo iii) genes upregulated after BCL6 siRNA knockdown in DLBCL and iv) genes linked to BCL6-LSD1 complexes through intronic or intergenic binding (NES and FDR values as implemented by GSEA, based on 10,000 sample permutations) f) Fold change of IRF4 mRNA levels (mean ± s.d.) in LSD1 knockdown cells versus control shRNA transfected cells normalized to HPRT based (triplicate qPCR reactions).
We performed GSEA using the plasma/memory cell differentiation gene signature and the Cγ1-Cre Lsd1fl/fl GC B cell induced genes and observed enrichment among genes induced by LSD1 shRNA (Fig. 4e). Confirming the significance of its interaction with BCL6, LSD1 shRNA induced genes were significantly enriched in BCL6 repressed genes, as were ChIP-seq defined intergenic and intronic LSD1-BCL6 target enhancers (Fig. 4e). We validated by qPCR upregulation of the critical LSD1 target and GC exit gene IRF4 (Fig. 4f). These data indicate similar functions for LSD1 in murine and human GCs and GC derived lymphoma cells, linked to BCL6, cell proliferation and GC B cell differentiation pathways.
Non-canonical LSD1 effect in GC B cells and lymphoma
To understand the LSD1 mechanism of action in GC B cells we next explored whether its function is mediated through its histone demethylase activity. We first examined the effect on GC formation of a specific and irreversible LSD1 enzymatic inhibitor (GSK-LSD1; EC50< 10 nM in growth assays using AML cell lines)21, 22. To this end, we immunized mice with SRBCs and then initiated intraperitoneal injections of GSK-LSD1 inhibitor (0.5 mg/kg) at the highest dose recommended based on limiting thrombocytopenia or vehicle on a daily basis for 10 days (Fig. 5a). In contrast to the striking loss of GCs induced by Lsd1 conditional deletion, the LSD1 inhibitor effect on GC B cell populations by flow cytometry and PNA staining was modest, albeit still significant, although LSD1 treatment did not affect splenic GC counts (Fig. 5a,b). Unlike this moderate effect on GC B cell B cell populations, LSD1 inhibition in vivo resulted in a significant reduction of Gr1hiCd11b+ bone marrow resident mature granulocytes consistent with its known role in their differentiation (Supplementary Fig. 4a,b)23. LSD1 enzymatic inhibition of a panel of GC derived lymphoma cell lines had very little effect even in doses up to 10 μM, although it was highly effective at these doses against leukemia cells, which are known to be sensitive to LSD1 inhibitors (Supplementary Fig. 4c)22. LSD1 inhibition induced H3K4me2 at LSD1 targets without inducing expression of these targets, in contrast to LSD1 knockdown that does induce gene expression (Supplementary Fig. 4e). And yet we confirmed that LSD1 is required to maintain the proliferation of GC derived lymphoma cells by performing both viability and cell cycle analysis on lymphoma cell lines transduced with LSD1 shRNA (Supplementary Fig. 4f,g).
Figure 5. LSD1 lymphoma prosurvival effect is mediated through non-catalytic functions.
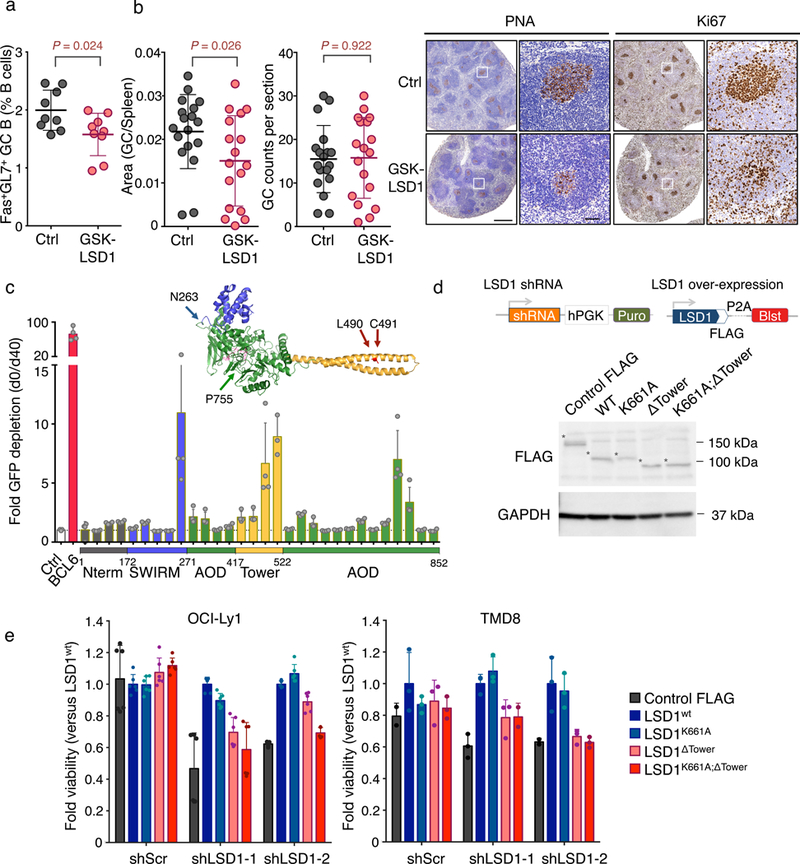
a) Flow cytometry analysis of GC B cell splenocytes calculated as percent Fas+GL7+ cells within live B cells (B220+DAPI–) from biologically independent immunized mice (n = 9 mice per group; mean ± s.d.) and treated on a daily basis with GSK-LSD1 (0.5 mg/kg) or PBS vehicle and sacrificed at 10 days. P values were calculated using two-sided unpaired t-test, *P < 0.05). Data are representative of three independent experiments. b) Quantification of PNA stained spleen sections from GSK-LSD1 treated versus vehicle treated mice. Left: Fraction of PNA stained area versus the total spleen section area. Middle: GC counts per spleen section. Right: Representative immunohistochemistry images of mouse spleen sections stained with PNA or Ki67 at two magnifications (vehicle versus GSK-LSD1 treated). Each point represents an individual mouse (Data pooled from two independent experiments; n=18 mice per group; mean ± s.d.; P values were calculated using two-sided unpaired t-test; scale bars, 0.5mm and 50 μm respectively). c) Fold depletion of % GFP+ cells (mean± s.d.) bearing sgRNAs targeting different parts of the LSD1 ORF at d40 post doxycycline induction versus d0. LSD1 protein structure with color-coded protein domains (N terminus: grey, SWIRM: blue, Tower: yellow, AOD: green) (PyMOL). Experiment was performed in n= 4 technical replicates and was further replicated using an independent Cas9 expressing OCI-Ly1 clone (see Supplementary Fig. 5h). d) Graphical representation of knockdown and rescue FLAG constructs and cropped immunoblot extracts from lymphoma cells transfected with FLAG tagged LSD1 rescue constructs: wild-type LSD1 (LSD1wt), catalytically inactive LSD1 (LSD1K661A), LSD1 lacking the Tower domain (LSD1ΔTower) and catalytically inactive LSD1 lacking the Tower domain (LSD1K661A;ΔTower) probed with anti-FLAG antibody. Cells transfected with Cas9-FLAG construct were used as controls. GAPDH served as protein loading control. Asterisk indicates each FLAG protein. Experiment representative of two blots. e) Viable cell counts (mean± s.d.) of two lymphoma cell lines (OCI-Ly1 and TMD8 cells in triplicate wells) transfected by control shRNA or two LSD1 targeted shRNAs and rescued with various LSD1 mutant constructs (d) normalized to cells rescued with wild-type LSD1.
These data suggest that LSD1 mechanism of action in GC B cells involves additional biochemical functions. To address this, we employed a CRISPR-Cas9 based structure-function approach to identify the LSD1 domain(s) that drive the proliferation of GC derived B cells. CRISPR-Cas9 genome editing frequently generates in-frame mutations instead of insertions/deletions, so that sgRNA targeting functional domains that sustain cell proliferation and survival are more deleterious to cells compared to sgRNAs targeted to non-essential domains24. We designed 30 GFP-expressing sgRNA vectors spanning the different LSD1 protein domains: the N-terminal SWIRM domain (aa172–271), the C-terminal AOD-histone demethylase domain (amine oxidase, aa271–852) and the central protruding “Tower” domain (aa417–522) (Fig. 5c)25, 26. The LSD1 SWIRM domain, which is often found in chromatin modifying and remodeling complexes, forms interactions with the AOD domain but lacks DNA binding properties25, 26. The FAD binding pocket and LSD1 catalytic center are located within the AOD domain, which accommodates the H3 tail as substrate for demethylation25, 26, 27. Finally the Tower domain is a coiled-coil domain that mediates interactions with CoREST25, 26. We initially generated two different OCI-Ly1 subclones that induce Cas9 expression upon doxycycline treatment. The effect of each sgRNA on cell survival was assessed by measuring the proportion of GFP-positive cells after doxycycline treatment independently for each of the two Cas9 expressing subclones (Fig. 5c and Supplementary Fig. 4h). As a positive control we used sgRNAs targeting BCL6, which is essential for lymphoma growth28, 29. We confirmed CRISPR-Cas9 mediated genetic engineering of the LSD1 locus for our sgRNAs by T7-endonuclease digestion (Supplementary Fig. 4i). The most consistently deleterious sgRNAs across clones disrupted the LSD1 Tower domain, which mediates protein-protein interactions (Fig. 5c and Supplementary Fig. 4h)25, 26. Two sgRNAs targeting part of the amino oxidase domain (AOD) near its FAD binding site also dropped out. Taken together, these results suggest that LSD1 GC B cell functions require both the Tower and the AOD domains, and that blocking the enzymatic activity of LSD1 alone is insufficient to fully elicit the LSD1 loss of function effect.
To validate this finding, we performed rescue experiments in two lymphoma cell lines (OCI-Ly1 and TMD8) expressing two different LSD1 shRNAs or control shRNA as well as FLAG-tagged LSD1 rescue constructs: wild-type LSD1 (LSD1wt), AOD catalytically inactive LSD1 (LSD1K661A)26, LSD1 lacking the Tower domain (LSD1ΔTower)26 and catalytically inactive LSD1 lacking the Tower domain (LSD1K661A; ΔTower). Rescue protein transduction was validated by immunoblot (Fig. 5d). We found that similar to LSD1wt, catalytically inactive mutant LSD1K661A fully rescued the effect of LSD1 depletion on cell growth (Fig. 5e). However, LSD1 lacking the Tower domain (LSD1ΔTower) only partially rescued lymphoma cells, consistent with the CRISPR domain screen (Fig. 5e). Finally, the double mutant LSD1K661A; ΔTower was almost incapable of rescuing LSD1 loss of function (Fig. 5e). Therefore, LSD1 actions in GC B cells involve both catalytic and structural functions mediated through the Tower domain.
The lymphomagenic effects of BCL6 require LSD1
GC B cells are the cells of origin of most non-Hodgkin lymphomas, including the diffuse large B cell lymphomas (DLBCLs), where BCL6 is a central and critical oncoprotein2. Given the functional cooperation of LSD1 and BCL6 in GC B cells we wondered whether LSD1 might also be important to the functions of BCL6 in lymphomagenesis. We first observed that LSD1 and BCL6 are concordantly expressed in primary human DLBCL patients based on gene expression profiling of two independent patient cohorts (Fig. 6a)7, 30.
Figure 6. LSD1 loss of function abrogates Bcl6 driven GC hyperplasia and lymphomagenesis.
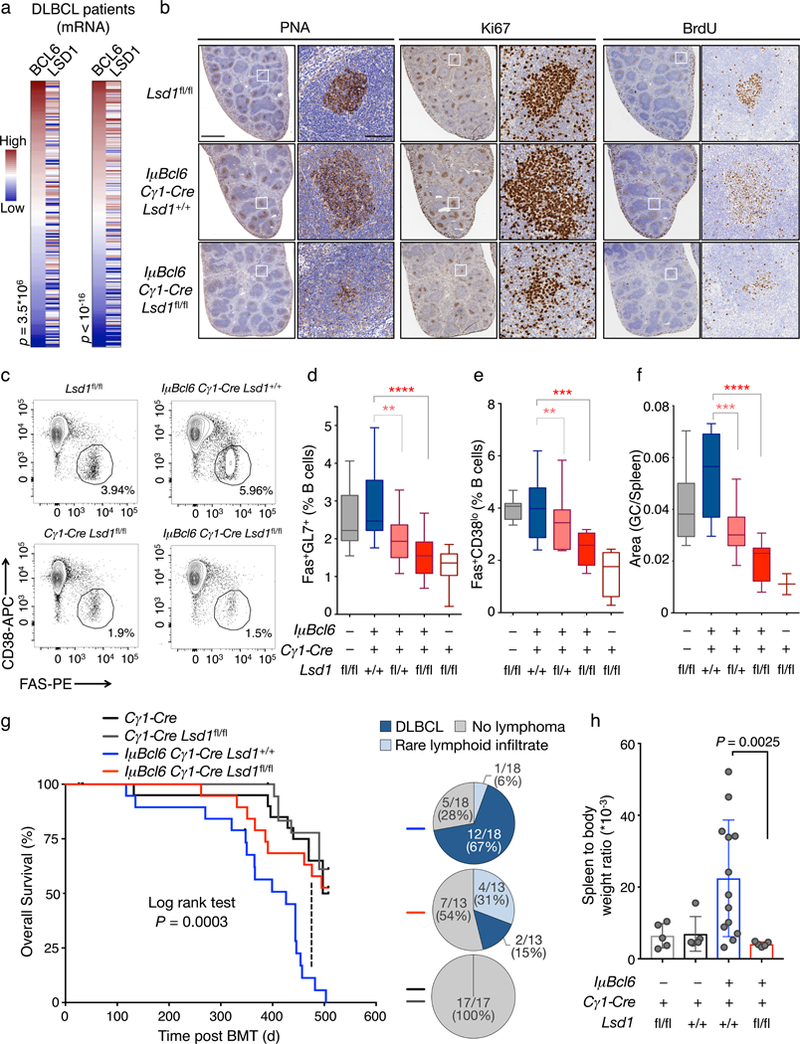
a) Correlation of BCL6 and LSD1 mRNA levels in two independent DLBCL cohorts from ref. 32 (left) and ref. 7 (right). Heatmaps were ranked by increasing BCL6 mRNA abundance. P value is based on Spearman correlation. b) Immunohistochemistry images of representative individual spleen sections from Lsd1fl/fl mice (n= 3), IμBcl6 Cγ1-Cre Lsd1+/+ mice (n= 11) and IμBcl6 Cγ1-Cre Lsd1fl/fl mice (n= 9) immunized with SRBC and sacrificed 10 d post immunization stained with PNA, Ki67, and BrdU at two magnifications. Scale bars, 1mm and 100 μm respectively. c) Representative flow cytometry dotplots of mouse GC splenocytes. The gated area shows the percent of GC B cell populations Fas+CD38lo within live B cells (B220+ DAPI–) d) Flow cytometry analysis of mouse GC B cell splenocytes identified as Fas+GL7+ from Lsd1fl/fl mice (n = 15), IμBcl6 Cγ1-Cre Lsd1+/+ mice (n = 19), IμBcl6 Cγ1-Cre Lsd1fl/+ mice (n = 18), IμBcl6 Cγ1-Cre Lsd1fl/fl mice (n = 17), and Cγ1-Cre Lsd1fl/fl mice (n = 11) at day 10 post immunization. Data are shown as percent of live B cells (B220+DAPI–) and were pooled from two independent experiments. e) Flow cytometry analysis of mouse GC B cell splenocytes identified as Fas+CD38lo cells from Lsd1fl/fl (n = 8), IμBcl6 Cγ1-Cre Lsd1+/+ (n = 11), IμBcl6 Cγ1-Cre Lsd1fl/+ (n = 10), IμBcl6 Cγ1-Cre Lsd1fl/fl (n = 9) and Cγ1-Cre Lsd1fl/fl mice (n = 3) at day 10 post immunization. Data are shown as percent of live B cells (B220+DAPI–). Flow cytometry analysis of mouse GC B cells as percent of live B cells (B220+DAPI–) as Fas+CD38loB220+DAPI–. f) Quantification of PNA stained area from Lsd1fl/fl (n = 8), IμBcl6 Cγ1-Cre Lsd1+/+ (n = 11), IμBcl6 Cγ1-Cre Lsd1fl/+ (n = 10), IμBcl6 Cγ1-Cre Lsd1fl/fl (n = 9) and Cγ1-Cre Lsd1fl/fl (n = 3) mouse spleen sections versus the total spleen section area. Each sample represents an individual mouse. P values indicate comparison to IμBcl6 Cγ1-Cre Lsd1+/+ mice by two-sided unpaired t-test (**P < 0.01, ***P < 0.001, ****P < 0.0001); boxplots are shown as median, interquartile range, and minimum to maximum. g) Overall survival of mice transplanted with bone marrow from Cγ1-Cre Lsd1fl/fl (n= 20), Cγ1-Cre (n= 18), IμBcl6 Cγ1-Cre Lsd1+/+ (n = 19), IμBcl6 Cγ1-Cre Lsd1fl/fl (n = 19) animals by measuring time of death or euthanasia after bone marrow transplantation. P value calculated by log rank test is indicated. h) Quantification of spleen to body ratio (mean ± s.d.) of individual sacrificed mice belonging to groups transplanted with bone marrow from Cγ1-Cre Lsd1fl/fl mice (n = 5), Cγ1-Cre mice (n = 5), IμBcl6 Cγ1-Cre Lsd1+/+ mice (n= 13), IμBcl6 Cγ1-Cre Lsd1fl/fl mice (n = 5). P value indicates two-sided unpaired t-test.
To determine whether LSD1 is required for BCL6 to induce lymphomagenesis we crossed Cγ1-Cre Lsd1fl/fl animals with mice carrying the IμBcl6 allele that mimics BCL6 translocation and causes GC hyperplasia and DLBCL in vivo31. To examine whether Lsd1 deletion impairs Bcl6 driven GC hyperplasia we immunized IμBcl6 transgenic mice with conditional deletion of one (IμBcl6 Cγ1-Cre Lsd1fl/+) or both (IμBcl6 Cγ1-Cre Lsd1fl/fl) Lsd1 alleles and compared them to littermate IμBcl6 animals (IμBcl6 Cγ1-Cre Lsd1+/+). In parallel, we immunized Lsd1fl/fl and GC conditional Lsd1-deficient mice (Cγ1-Cre Lsd1fl/fl) as controls. All animals manifested unperturbed splenic architecture and disposition of B cells 10 days after immunization (Supplementary Fig. 5a). As previously demonstrated, IμBcl6 mice (IμBcl6 Cγ1-Cre Lsd1+/+) manifested GC hyperplasia (Fig. 6b,f) and higher fractions of GC B cells based on flow cytometry (Fas+GL7+B220+ and Fas+CD38loB220+) (Fig. 6c-e). These enlarged IμBcl6 GCs contained increased numbers of Ki67+ cells and greater in vivo BrdU labeling, consistent with BCL6-sustained proliferation of the GC compartment (Fig. 6b). On the contrary, conditional deletion of Lsd1 rescued the IμBcl6 driven GC hyperproliferative phenotype in a dose dependent manner (Fig. 6d,f) as loss of one or both Lsd1 alleles (IμBcl6 Cγ1-Cre Lsd1fl/+ or IμBcl6 Cγ1-Cre Lsd1fl/fl) yielded significantly reduced GC B cell populations by flow cytometry and by PNA staining, compared to IμBcl6 Cγ1-Cre Lsd1+/+ (Fig. 6b-f). In addition, IμBcl6 transgenic mice with conditional loss of one or two Lsd1 alleles formed fewer GC per spleen section compared to IμBcl6 transgenic mice (Supplementary Fig. 5b). Unlike IμBcl6 transgenic mice, GC B cells from IμBcl6 Cγ1-Cre Lsd1fl/+ or IμBcl6 Cγ1-Cre Lsd1fl/fl transgenic mice were not significantly enriched in replicating (BrdU+) cells (Supplementary Fig. 5c).
To determine whether loss of LSD1 would also impair Bcl6 driven lymphomagenesis, we transplanted bone marrow from IμBcl6 Cγ1-Cre Lsd1+/+, IμBcl6 Cγ1-Cre Lsd1fl/fl and Cγ1-Cre Lsd1fl/fl mice or Lsd1fl/fl controls into lethally irradiated recipient mice. Animals were immunized with SRBC every 3 weeks to ensure continuous formation of GCs and regularly monitored for survival and lymphomagenesis. IμBcl6 Cγ1-Cre Lsd1fl/fl, mice manifested significantly delayed lethality compared to IμBcl6 Cγ1-Cre Lsd1+/+ controls (Fig. 6g). Lymphomagenesis in IμBcl6 is typically associated with massive splenomegaly. Accordingly, most IμBcl6 Cγ1-Cre Lsd1+/+ mice featured significantly increased spleen to body weight ratios as compared to Cγ1-Cre Lsd1fl/fl or Cγ1-Cre controls (Fig. 6h). Remarkably, spleens of IμBcl6 Cγ1-Cre Lsd1fl/fl were indistinguishable from controls and significantly reduced compared to IμBcl6 Cγ1-Cre Lsd1+/+ (Fig. 6h).
Pathological analysis of spleens, livers and other organs collected upon euthanasia revealed that the majority IμBcl6 Cγ1-Cre Lsd1+/+ mice had developed lymphoma with complete effacement of lymphoid organs (Fig. 6g, Supplementary Fig. 5d). These contained large atypical B220+ lymphoid cells with centroblast/immunoblast features. Moreover, IμBcl6 Cγ1-Cre Lsd1+/+ mice featured invasive lymphoma infiltrates in their livers within centrilobular spaces and with sinusoid spreading, as well as in lungs and kidneys. Conversely, in IμBcl6 Cγ1-Cre Lsd1fl/fl mice, lymphoid structures were mainly preserved with minimal effacement and no parenchymal infiltration, with only some large B220 positive lymphoid elements seen within GCs and/or ectopically scattered in the lymphoid organs. Taken together these data suggest that Lsd1 is required for Bcl6 to drive malignant transformation of GC B cells.
DISCUSSION
Dampening expression of genes induced by T cell help is believed to be important for B cells to undergo immunoglobulin affinity maturation without premature interruption1. Herein we report that LSD1, a FAD-dependent demethylase, is essential for GC formation and LSD1 loss causes reactivation of GC repressed enhancers, increased chromatin accessibility and gene upregulation implicating this chromatin modifier as a critical epigenetic regulatory factor in the GC reaction. LSD1 loss of function caused failure to repress genes induced by T-cell help involved in GC exit and terminal differentiation such as IRF4, XBP1 and PRDM1, which may explain why Lsd1-deficient GCs are short-lived and fail to expand preventing the formation of full-fledged GCs. In addition LSD1 repressed genes involved in B cell signaling interactions with T cells including CD80 (CLTA4 receptor), CXCR3, Stat4, and the CD155 ligands TIGIT and CD226. Failure to proliferate could also be linked to upregulation of genes that inhibit cell cycle progression. One of these genes, the orphan G-coupled receptor Gpr132 was shown to arrest cell cycle progression in B cells downstream of IKZF20.
LSD1 requires transcription factors for its recruitment to chromatin, and in GC B cells BCL6 accounts for a large fraction of LSD1 binding sites in the genome. Recruitment of LSD1 is clearly important for BCL6 to repress its direct targets. Yet we underline that LSD1 histone demethylase function alone is not sufficient for its actions in GC B cells, as we observed that the LSD1 Tower domain is required and essential for its actions in this cellular context. This finding suggests that recruitment of the CoREST complex (which also contains HDAC1/2)32, 33 is critically required for LSD1 to mediate the repressive chromatin state and downstream biological effects in GC B cells. Notably, among all monoamine oxidases, including the AOD containing homologue Lsd2 (Kdm1B), this coiled-coil Tower domain is unique to LSD1, which may explain the apparent lack of compensatory effects of Kdm1B in Lsd1-deficient GC B cells34. These findings are in sharp contrast to LSD1 mechanisms in myeloid leukemia where LSD1 catalytic activity was shown to be crucial16, 22, 35, 36. LSD1 inhibitors did cause a modest reduction in GC B-cells suggesting that loss of enzymatic activity might be slightly deleterious in primary GC B-cells. However this effect may also be due to perturbation of LSD1 function in other GC cell types such as GC-TFH cells. Indeed, there is evidence that LSD1 plays an important role in T cell development37. LSD1 is also known to act as a corepressor for PRDM138 suggesting that LSD1 binds to and enables BCL6 to maintain the GC phenotype and may then switch to assist PRDM1 in inducing the plasma cell phenotype once BCL6 is downregulated.
Finally, our data indicate that LSD1 plays a critical role in lymphomagenesis as an important BCL6 co-factor since it is LSD1 is required for this canonical lymphoma oncogene to induce malignant transformation. Although it is tempting to consider LSD1 enzymatic inhibitors as a potential therapeutic strategy in lymphomas, these drugs are not sufficient to antagonize its actions. Instead novel classes of inhibitors may need to be developed that could destabilize LSD1 protein interactions in addition to its enzymatic activity.
Methods
Mice.
Conditional Lsd1-deficient mice (loxP-flanked Lsd1 allele, Lsd1fl/fl) were purchased from the Jackson laboratory (023969). By crossing Lsd1fl/fl with the transgenic Cγ1-Cre strain (The Jackson Laboratory, 010611) we generated heterozygous Cγ1-Cre Lsd1+/fl mice, which were crossed to yield Cγ1-Cre Lsd1fl/fl mice. As controls, we used Cγ1-Cre negative Lsd1fl/fl littermates. B cell conditional Lsd1 deletion was generated by crossing Lsd1fl/fl mice with CD19-Cre mice (Jackson Laboratory, 006785) where Cre is expressed from the pre-B cell stage. Mice were used for assessment of GC formation induced by immunization with SRBCs, or affinity maturation by immunization with NP-CGG28–30. We also used IμBcl6 mice (obtained from R. Dalla-Favera, Columbia University31) to generate IμBcl6 Cγ1-Cre Lsd1fl/fl by crossing with Cγ1-Cre Lsd1fl/fl. These mice were used for GC formation assays or bone marrow donors to perform transplantation to C57BL/6 recipients. Animal care and all experiments were performed in strict compliance with the institutional guidelines and protocols of Weill Cornell Medicine and Memorial Sloan-Kettering Cancer Center Institutional Animal Care and Use Committee, the Association for Assessment and Accreditation of Laboratory Animal Care International and in accordance with the GSK Policy on the Care, Welfare and Treatment of Laboratory Animals.
Germinal center formation experiments and flow cytometry
Age- and sex-matched C57BL/6 mice (8–12 weeks old) were immunized intraperitoneally with 0.5 ml of a 2% SRBC suspension in PBS (Cocalico Biologicals) and sacrificed after 10 days. Single-cell suspensions from mouse spleens were separated by Ficoll gradient centrifugation and stained using fluorescent-labeled anti-mouse antibodies: PE-Cy7 anti-B220 (eBioscience, 25–0452, dilution 1:500), APC anti-CD38 (eBioscience,17–0381, dilution 1:500), APC anti-B220 (BD Biosciences, 553092, dilution 1:500), PE anti-FAS (BD Biosciences, 554258, dilution 1:500), FITC anti-GL7 (BD Biosciences, 553666, dilution 1:500), BV421 anti-CD138 (BioLegend, 142507, 1:500), FITC anti-κ (BioLegend, 409509, 1:500) or APC-Cy7 anti-κ (BioLegend, 409503, 1:500), PE-Cy7 anti-CD11b (BioLegend, 101216, dilution 1:300) and APC-Cy7 anti-Gr1 (108424, dilution1:300). DAPI was used for the exclusion of dead cells. When needed cells were fixed and permeabilized using BD Cytofix/Cytoperm™ Kit (554714, BD Biosciences). For cell cycle analysis cells were stained in vitro by addition of BrdU (10 μM) for 20 min. 7AAD was used to determine DNA content in cell cycle analysis along with V450 anti-BrdU staining (BD Pharmingen, V450, dilution: 1:50). For treatment with LSD1 inhibitor GSK-LSD1, mice were injected intraperitoneally with drug or PBS vehicle starting the day following SRBC injection and administered daily at a concentration of 50 mg/kg per day till they were sacrificed. For RNA-seq studies from sorted GC B populations, mononuclear splenocytes were enriched for B cells using magnetic cell separation (AutoMACS) with CD45R (B220) beads (130–049-501, Miltenyi Biotec). Cells were then stained with APC anti-B220 (553092, dilution 1:500), BV-421 anti-GL7 (562967, BD Biosciences, dilution 1:500) and PE-Cy7 anti-FAS (557653, BD Biosciences, dilution 1:500) and sorted on a BD FACSAria III instrument. Flow cytometry strategies are summarized in Supplementary Fig.6.
Bone marrow transplantation
For murine bone marrow (BM) transplantation assays, BM cells from 6–8-week-old male donors were harvested. 106 BM cells of each type were tail vein injected in female C57BL/6 mice lethally irradiated with two doses of 450 rad. All mice were monitored until any one of several criteria for euthanizing were met, including severe lethargy, more than 10% body weight loss, and palpable splenomegaly that extended across the midline. In our survival analysis we censored 3 mice that died less that one month after bone marrow transplantation lacking distinct pathological features due to failed BM engraftment, one animal that was euthanized due to tail necrosis and one euthanized due to dermatitis based on Research Animal Resource Center recommendations.
B cell purification and characterization
Human B cell populations were affinity-purified from de-identified human tonsillectomy specimens by Ficoll gradient separation to isolate mononuclear cells followed by magnetic cell separation (Miltenyi Biotec) based on the expression of phenotypic markers CD77 and IgD. Tissues were obtained with approval from the Human Research Protections Programs, Division of Research Integrity of the Weill Cornell Medical College, in accordance with the Declaration of Helsinki. For each isolation NB and GC B cell purity was determined by flow cytometry analysis of surface IgD (BD Pharmingen), CD77 (AbD Serotech) and CD38 (BD Pharmingen) more than 90%.
Immunohistochemistry
Tissues were fixed in 10% formalin and embedded in paraffin at the Laboratory of Comparative Pathology at MSKCC. Paraffin sections were dewaxed in xylene and hydrated into graded alcohols. Immunohistochemistry was performed on Leica Bond™ RX using the Bond™ Polymer Refine Detection Kit (Cat. No. DS9800). Deparaffinized slides were antigen retrieved depending on the target epitope and endogenous peroxidase (HRP) activity was blocked by immersing the slides in 1% hydrogen peroxide in PBS for 15 min. Slides were initially incubated with primary antibodies against BrdU (Abcam, ab6326, diluted 1:500, antigen retrieval: heat mediated, EDTA pH 9.0), Ki67 (Vector VP-K451, dilution 1:100, antigen retrieval: heat mediated, EDTA pH 9.0), B220 (BD Bioscience, 550286, diluted 1:200, antigen retrieval: heat mediated with 10 mM citrate buffer pH 6.0) and LSD1 (abcam 17721, diluted 1:1000, antigen retrieval: heat mediated with 10 mM citrate buffer pH 6.0). After washing, slides were incubated with species-specific biotinylated secondary antibodies and then avidin-HRP or avidin-AP incubation. Biotin-conjugated PNA (Vector Laboratories B-1075, dilution 1:250) was used to identify germinal centers. Antibody reaction was visualized with DAB (3–3′ Diaminobenzidine, Sigma, Cat. No. D8001) or Vector Blue (Vector Laboratories) followed by counterstaining with hematoxylin if necessary. For LSD1 staining we used BCIP/NBT chromogen to develop. Tissue sections were dehydrated in graded alcohols, cleared in xylene and mounted. Slides were scanned using a Zeiss Mirax Slide Scanner and photomicrographs were examined with Panoramic Viewer software. ImageJ 1.44o software (NIH) was used to quantify GC areas.
Coimmunoprecipitation
Lysates from DLBCL cells were prepared using 25 mM Tris, pH 7.4, 150 mM NaCl, 0.5% NP-40, 0.1%SDS lysis buffer with protease inhibitors (Roche). Five μg of antibodies against BCL6 (Santa Cruz N3, sc-858), LSD1 (abcam 17721) or IgG control antibodies were added to precleared lysates and incubated overnight at 4°C rocking. Protein-A beads (Roche) were added for 2 h at 4°C with gentle agitation, washed 4× (25 mM Tris, pH 7.4, 200 mM NaCl, 0.5% NP-40, 0.1%SDS) and then boiled in 1× LDS sample buffer (Thermo Fisher #NP0007) supplemented with 5% β-mercaptoethanol and supernatant was resolved on polyacrylamide gel electrophoresis (SDS-PAGE). For histone demethylation assays, immunoprecipitated complexes were washed on-bead and incubated with 1 μg bulk histones (H4524, Sigma) in histone demethylase buffer (50 mM Tris HCl, 50 mM KCl, 5 mM MgCl2, 0.5% BSA, 5% glycerol) overnight11. Reactions were denatured and resolved on 18% SDS-PAGE.
GST-pull down
Radiolabelled BCL6 was generated by TnT® T7 Quick Transcription/Translation system (Promega) according to the manufacturer’s protocol supplemented with 0.02 mCi EasyTag™ L-[35S]-Methionine (Perkin Elmer). GST and GST-LSD1 fusion pGEX based vectors were transformed in BL21(DE3) competent Escherichia coli. Bacterial cultures were grown to OD600 0.5–0.6 and then protein expression was induced with 1 mM IPTG for 3 h at 37 °C shaking. Bacteria were pelleted, resuspended in lysis buffer (50 mM Tris-HCl, pH 7.5, 150 mM NaCl, 1 mM EDTA, 1%Triton-X 100) supplemented with DNAseI (5 μg/ml) and lysozyme (20 μg/ml), and incubated for 30 min on ice and then spun for 30 min at 21,000 g. Bacterial lysates were incubated with glutathione sepharose beads (GE Healthcare) at 22 °C for 1 h rocking, then washed 5× with PBS. Finally GST or GST-LSD1 proteins were eluted with Glutathione Elution Buffer (50 mM Tris-HCl pH 8, 1 0mM reduced glutathione). After gel-based quantification 5 μg for purified GST tagged protein were bound to glutathione sepharose beads in binding buffer for 1 h at 4oC (20 mM HEPES pH7.5, 150 mM KCl, 25 mM MgCl2, 10 mM DTT, 0.1 mM EDTA, 0.15% NP-50) and after multiple washes 20 μl of the radiolabelled in vitro transcription/translation reaction containing 35S-labeled BCL6 protein bait was added to each sample and incubated 1 h at 4oC rocking. After washing the beads with binding buffer with increasing stringency salt concentrations, beads were boiled in 1× LDS sample buffer (Thermo Fisher #NP0007) supplemented with 5% β-mercaptoethanol and supernatant was resolved by SDS-PAGE. Gels were then fixed (10% glacial acetic acid, 20% methanol (v/v) in water), incubated in liquid autoradiography enhancer for 1 h (EN3HANCE™, Perkin Elmer), vacuum dried (70 oC, 3 h) and developed by autoradiography after exposing to film for 24 h at −80 oC.
Immunoblotting
Lysates from DLBCL lymphoma cell lines and isolated cell populations were prepared using 25 mM Tris, pH 7.4, 150 mM NaCl, 0.5% NP-40, 0.1%SDS and complete protease inhibitor cocktail (Roche) lysis buffer. Protein lysates were resolved by SDS-PAGE, transferred to PVDF membrane, and probed with primary antibodies: LSD1(Santa Cruz, 1B2E5, sc-53875), FLAG (F1804, M2, Sigma), GAPDH (Santa Cruz, FL-335, sc-25778), Actin (sc-81760). Membranes were then incubated with corresponding HRP-conjugated secondary antibodies and signal was detected using enhanced chemiluminescence (ChemiDoc Touch, Bio-Rad Laboratories). Densitometry values were obtained using ImageJ 1.44o software (NIH).
ELISA
Mice were immunized with intraperitoneal injection of NP-CGG28–30 (200 μg) in alum and boost immunized with the same dose 21 days after the primary immunization. Serum samples were collected at 26 days post primary NP-CGG immunization and the abundance of NP hapten-specific immunoglobulin titers were analyzed by ELISA. Sera were tested for binding of NP-specific antibodies to low-haptenated BSA (NP7-BSA) versus high-haptenated BSA (NP30-BSA) coated plates using HRP conjugated antibodies (SouthernBiotech, dilution 1:500). Optical density (OD) at 450nm was measured in a plate reader (BioTek) and the absorbance ratio was calculated by dividing the mean OD in NP7-BSA coated wells by the mean OD in NP30-BSA coated wells. Titers were calculated by logarithmic interpolation of the dilutions with readings immediately above and immediately below a chosen OD450 threshold equal to 2 fold of background OD450 as previously described39.
ELISpot
Mice were sacrificed 40 days after NP-CGG immunization and splenocytes were collected and analyzed for secretion of NP-specific IgG1 antibodies. ELISpot plates (Millipore, MAHAS4510) were activated by incubation with 35% ethanol, coated with NP7-BSA and NP30-BSA (Biosearch Technologies) and used for overnight culture of splenocytes seeded at 37 oC without disturbing overnight. Secreted antibodies binding to the coated reagent were visualized by HRP-conjugated anti-IgG1 antibodies and DAB substrate. The plates were scanned and the number of spots were analyzed by ZellNet Consulting Inc.
Plasmids, shRNAs and virus production
shRNAs against LSD1–1 and LSD1–2 shRNAs were delivered by lentiviral infection. Viral particles were produced by calcium phosphate transfection of 293T cells with pLKO.1 vector along with psPax2 and pMD2.G at a 4:3:1 ratio. Infected cells were selected by puromycin treatment (1 μg/mL). Mature antisense sequences of shRNA were: shLSD1–1: 5′-GCCTAGACATTAAACTGAATA-3′ and shLSD1–2: 5′-CCACGAGTCAAACCTTTATTT-3′. LSD1 wild-type and rescue mutant expression constructs were cloned into lentiCas9-Blast (Addgene 52962) replacing Cas9 using Gibson Assembly® Master Mix (NEB, E2611). Tower deleted constructs contained a pentaglycin loop that links the two parts of the amine oxidase domain, in place of the LSD1 Tower domain26.
CRISPR/Cas9 domain screen
Two lymphoma cell lines were subcloned after OCI-Ly1 lentiviral transfection of Dox inducible FLAG-tagged Cas9 constructs (pCW-Cas9, Addgene 50661) and puromycin selection. The highest scoring sgRNAs selected using CRISPR design (Zheng lab, http://crispr.mit.edu/) (Supplementary Table 1) and cloned into lentiviral construct pLKO5.sgRNA.EFS.GFP (Addgene 57822). After virus generation, infections were performed in 96-well plates containing selected Cas9-inducible lymphoma cells in quadruplicate wells per sgRNA. Percent GFP expression was assessed by flow cytometry (BD FACSCanto II) 48 h post-transfection (day 0). At this time doxycycline treatment was initiated to induce Cas9 expression (1 μg/ml). GFP expression (% to total population) was recorded every 2 days post doxycycline treatment and normalized to day 0.
Chromatin immunoprecipitation and ChIP-seq
ChIP assays were performed as previously described6. For ChIP-seq experiments with cells treated with siRNAs, OCI-Ly1 or SUDHL4 cells were transfected using Nucleofector 96-well Shuttle system (Lonza) with 1 μM siRNA against BCL6 (HSS100968) or non-targeted siRNA (46–2001) (Stealth RNAi, Invitrogen) for 24 h. Briefly cells were fixed, lysed, and sonicated to generate fragments less than 400 bp. Sonicated lysates were incubated with antibodies against LSD1 (abcam 17721), BCL6 (Santa Cruz N3, sc-858), H3K4me1 (abcam, ab8895) or IgG control (abcam, ab171870) and after increasing stringency washes immunocomplexes were recovered and DNA was isolated. Relative ChIP enrichment was confirmed by qPCR. Primers can be found in Supplementary Table 2. H3K4me1 ChIPs in SUDHL4 also contained Drosophila spike-in chromatin control (750 ng per ChIP, Active Motif, 53083) added during precipitation along with Drosophila antibody (2 μg, Active Motif, 61686) for signal normalization. Adaptor-ligated ChIP-seq libraries (250 ±25bp) were generated using the Illumina ChIP-seq Library preparation Kit starting with 10 ng of purified ChIP DNA (quantified by Qubit 2.0, Invitrogen). For ChIP-seq, raw images generated went through primary image analysis and base calling (RTA v1.6) that was followed by Illumina Genome Analyzer Off-Line Basecaller (OLB v1.6) analysis. Raw ChIP-seq reads were trimmed and filtered for quality using Trim Galore and FASTQC. Reads were aligned using BWA-mem against human reference genome hg38, and non-uniquely mapping reads and PCR duplicates were removed using SAMtools and Picard, respectively. Sequences mapped uniquely to the genome with < 2 mismatches were used for downstream analysis. Several reads mapping to the same exact location (clonal reads) were considered amplification artifacts and were excluded from the analysis. The determine the quality of individual ChIP-seq experiments we used ENCODE consortium quality metrics40. Strand cross-correlation analysis was performed to assess signal-to-noise ratios, and samples were retained for analysis that passed a normalized strand coefficient (NSC) threshold >1.05 and a relative strand correlation (RSC) threshold >0.8. Read density tracks were visualized using the UCSC browser. Peak calling was performed using MACS241. Each ChIP-seq dataset was normalized to its corresponding input. H3K4me1 signals from SUDHL4 cells were normalized based on the scaling factor calculated from the ratio of human and drosophila mapped reads as previously described42. Peaks were annotated based on the RefSeq database (hg38). Peaks localized ±2kb of the TSS were defined as promoter peaks, peaks localized ±2kb of the TES were defined as 3’ end peaks, and peaks > 2kb away from genes were defined intergenic.
Gene expression analysis by qPCR and RNA-seq
RNA was prepared using Trizol extraction (Invitrogen). cDNA was prepared using cDNA synthesis kit (Thermo Scientific) and detected by Fast SyberGreen on 7900HT Fast Real-Time PCR System (Applied Biosystems). Gene expression was normalized to HPRT1. All primers used in this study can be found in Supplementary Table 2. Fold changes relative to controls were calculated using the ΔΔCT method. For RNA-seq experiments STAR aligner43 was used to map fastq files to the reference genome. Gene counts were calculated for each transcript and normalized to determine differentially expressed genes using DESeq244.
ATAC-seq
ATAC-seq profiles were collected for 3 Cγ1-Cre Lsd1fl/fl mice and 2 Lsd1fl/fl mice. GC B cells were sorted as described above and ATAC-seq was performed as previously described45. 50,000 purified GC B cells were resuspended in 1 ml of ATAC-seq resuspension buffer (RSB; 10 mM Tris-HCl pH 7.4, 10 mM NaCl, and 3 mM MgCl2 in water) and centrifuged at 500 g and 4 °C for 5 min. Cell pellets were resuspended in 50 μl of ATAC-seq RSB containing 0.1% NP40, 0.1% Tween-20, and 0.01% digitonin and incubated on ice for 3 min. Following lysis, 1 ml of ATAC-seq RSB containing 0.1% Tween-20 was added, and nuclei were centrifuged at 500 g (4 °C, 10 min). Pelleted nuclei were resuspended in 50 μl of transposition mix (25 μl 2× TD buffer, 2.5 μl tagment DNA enzyme, 16.5 μl PBS, 0.5 μl 1% digitonin, 0.5 μl 10% Tween-20, and 5 μl water) and incubated at 37 °C for 30 min shaking. Reactions were cleaned up with Zymo DNA Clean and Concentrator columns. DNA libraries were prepared as described and sequenced on a Hi-Seq 2000 (Illumina).
ATAC-seq pair-end sequencing reads were trimmed to remove adapter sequences using NGmerge with option “-a”, and trimmed reads were aligned to mm10 reference genome using bowtie2 with options “-X2000 –local”46. Alignments were filtered using SAMtools v1.8 to retain only uniquely mapping read pairs and to discard mitochondrial mapping reads47. Read duplicates were removed using the MarkDuplicates program in Picard Tools 2.18.11 (http://broadinstitute.github.io/picard). Peak calling was performed by pooling all the samples to control false discovery48 using the MACS2 callpeak command with parameters “—shift −75 --extsize 150 --pval 0.01 –keep-dup all –call-summits”41. A matrix of non-nucleosomal Tn5 insertion counts was generated for the common set of peaks. The count matrix was used to identify differentially accessible peaks with DESeq2. Reads within the final set of peaks were taken as library size for normalization44. Differential peaks at FDR < 0.05 were retained for analysis. The peaks were annotated to RefSeq mouse genes using upstream promoter and regulatory regions (basal region plus upstream extension to the nearest gene up to 1MB). Genes near differentially opening peaks were used in pathway enrichment analysis by GSEA49. Mean normalized Tn5 insertions at differential peaks were computed for pooled replicates in both Cγ1-Cre Lsd1fl/fl and Lsd1fl/fl mice and smoothed over a 120-bp window. Average signal values were plotted using deepTools50.
Pathway Analysis
Pathway analysis was performed as previously described51. Gene sets for canonical pathways and Gene Ontology (GO52 terms were downloaded from the Molecular Signatures Database (MSigDB)49 using C5 collection. The B cell and lymphoid specific signatures were curated by published Staudt53 or Melnick laboratory studies. This database contains approximately 250 gene sets/signatures associated with normal lymphoid biology and lymphoid neoplasms. Fisher exact test was used to calculate enrichment P values for each of those gene sets. The Benjamini-Hochberg method52 was used for FDR control.
Statistics and reproducibility
Two-sided unpaired t-test was used where indicated. All proportional numerical values provided in the text are written as the mean ± sd. All statistical analyses were done in Prism 7.0 (Graphpad). Experiments were performed at least two times, with similar results obtained each time. For animal studies, the number of animals was chosen to ensure 90% power with 5% error based on observed standard deviation from previous studies. Additional information can be found in the Life Sciences Reporting Summary.
Supplementary Material
Acknowledgements
We thank the members of the Melnick and Lowe laboratories for helpful discussions throughout the duration of the project. We also thank T. Hoshii and S. Armstrong for sharing CRISPR-Cas9 reagents and protocols and M. Luo, B. Laurent and Y. Shi for helpful suggestions on LSD1 demethylation assays. A.M.M. is supported by the Chemotherapy Foundation, LLS-TRP 6457–15, LLS SCOR 7012–16, NCI R01 CA187109, NCI R35 CA220499 and the Follicular Lymphoma Consortium. K.H. was supported by the Charles H. Revson Senior Fellowship in Biomedical Science and the NIH/NCI K99CA212276 award.
Footnotes
Data availability
Sequence data that support the findings of this study have been deposited in GEO under SuperSeries GSE118783 with the accession codes GSE106417 (RNA-seq for GC B cell), GSE106416 (RNA-seq for lymphoma) and GSE107920 (ChIP-seq). Other data that support these findings are available from the corresponding author upon reasonable request.
Competing interests
A.M.M. received research funding from GlaxoSmithKline. H.P.M. and R.G.K are GlaxoSmithKline employees. R.S. is currently employed by Cancer Genetics Incorporated.
Reporting Summary
Further information on experimental design is available in the Life Sciences Reporting Summary linked to this article.
References
- 1.Mesin L, Ersching J & Victora GD Germinal Center B Cell Dynamics. Immunity 45, 471–482 (2016). [DOI] [PMC free article] [PubMed] [Google Scholar]
- 2.Hatzi K & Melnick A Breaking bad in the germinal center: how deregulation of BCL6 contributes to lymphomagenesis. Trends Mol Med 20, 343–352 (2014). [DOI] [PMC free article] [PubMed] [Google Scholar]
- 3.Beguelin W et al. EZH2 is required for germinal center formation and somatic EZH2 mutations promote lymphoid transformation. Cancer cell 23, 677–692 (2013). [DOI] [PMC free article] [PubMed] [Google Scholar]
- 4.Beguelin W et al. EZH2 and BCL6 Cooperate to Assemble CBX8-BCOR Complex to Repress Bivalent Promoters, Mediate Germinal Center Formation and Lymphomagenesis. Cancer Cell 30, 197–213 (2016). [DOI] [PMC free article] [PubMed] [Google Scholar]
- 5.Bunting KL et al. Multi-tiered Reorganization of the Genome during B Cell Affinity Maturation Anchored by a Germinal Center-Specific Locus Control Region. Immunity 45, 497–512 (2016). [DOI] [PMC free article] [PubMed] [Google Scholar]
- 6.Hatzi K et al. A hybrid mechanism of action for BCL6 in B cells defined by formation of functionally distinct complexes at enhancers and promoters. Cell Rep 4, 578–588 (2013). [DOI] [PMC free article] [PubMed] [Google Scholar]
- 7.Jiang Y et al. CREBBP Inactivation Promotes the Development of HDAC3-Dependent Lymphomas. Cancer Discov 7, 38–53 (2017). [DOI] [PMC free article] [PubMed] [Google Scholar]
- 8.Ortega-Molina A et al. The histone lysine methyltransferase KMT2D sustains a gene expression program that represses B cell lymphoma development. Nat Med 21, 1199–1208 (2015). [DOI] [PMC free article] [PubMed] [Google Scholar]
- 9.Zhang J et al. Disruption of KMT2D perturbs germinal center B cell development and promotes lymphomagenesis. Nat Med 21, 1190–1198 (2015). [DOI] [PMC free article] [PubMed] [Google Scholar]
- 10.Zhang J et al. The CREBBP Acetyltransferase Is a Haploinsufficient Tumor Suppressor in B-cell Lymphoma. Cancer Discov 7, 322–337 (2017). [DOI] [PMC free article] [PubMed] [Google Scholar]
- 11.Shi Y et al. Histone demethylation mediated by the nuclear amine oxidase homolog LSD1. Cell 119, 941–953 (2004). [DOI] [PubMed] [Google Scholar]
- 12.Foster CT et al. Lysine-specific demethylase 1 regulates the embryonic transcriptome and CoREST stability. Mol Cell Biol 30, 4851–4863 (2010). [DOI] [PMC free article] [PubMed] [Google Scholar]
- 13.Wang J et al. The lysine demethylase LSD1 (KDM1) is required for maintenance of global DNA methylation. Nat Genet 41, 125–129 (2009). [DOI] [PubMed] [Google Scholar]
- 14.Wang J et al. Opposing LSD1 complexes function in developmental gene activation and repression programmes. Nature 446, 882–887 (2007). [DOI] [PubMed] [Google Scholar]
- 15.Kerenyi MA et al. Histone demethylase Lsd1 represses hematopoietic stem and progenitor cell signatures during blood cell maturation. eLife 2, e00633 (2013). [DOI] [PMC free article] [PubMed] [Google Scholar]
- 16.Schenk T et al. Inhibition of the LSD1 (KDM1A) demethylase reactivates the all-trans-retinoic acid differentiation pathway in acute myeloid leukemia. Nat Med 18, 605–611 (2012). [DOI] [PMC free article] [PubMed] [Google Scholar]
- 17.Good-Jacobson KL, Song E, Anderson S, Sharpe AH & Shlomchik MJ CD80 expression on B cells regulates murine T follicular helper development, germinal center B cell survival, and plasma cell generation. J Immunol 188, 4217–4225 (2012). [DOI] [PMC free article] [PubMed] [Google Scholar]
- 18.Piovesan D et al. c-Myb Regulates the T-Bet-Dependent Differentiation Program in B Cells to Coordinate Antibody Responses. Cell reports 19, 461–470 (2017). [DOI] [PubMed] [Google Scholar]
- 19.Kim SJ et al. Increased IL-12 inhibits B cells’ differentiation to germinal center cells and promotes differentiation to short-lived plasmablasts. J Exp Med 205, 2437–2448 (2008). [DOI] [PMC free article] [PubMed] [Google Scholar]
- 20.Bond J et al. Direct interaction of Ikaros and Foxp1 modulates expression of the G protein-coupled receptor G2A in B-lymphocytes and acute lymphoblastic leukemia. Oncotarget 7, 65923–65936 (2016). [DOI] [PMC free article] [PubMed] [Google Scholar]
- 21.Mohammad HP et al. A DNA Hypomethylation Signature Predicts Antitumor Activity of LSD1 Inhibitors in SCLC. Cancer cell 28, 57–69 (2015). [DOI] [PubMed] [Google Scholar]
- 22.Mohammad H et al. Inhibition Of LSD1 As a Therapeutic Strategy For The Treatment Of Acute Myeloid Leukemia. Blood 122, 3964–3964 (2013).24113870 [Google Scholar]
- 23.Sprussel A et al. Lysine-specific demethylase 1 restricts hematopoietic progenitor proliferation and is essential for terminal differentiation. Leukemia 26, 2039–2051 (2012). [DOI] [PubMed] [Google Scholar]
- 24.Shi J et al. Discovery of cancer drug targets by CRISPR-Cas9 screening of protein domains. Nat Biotechnol 33, 661–667 (2015). [DOI] [PMC free article] [PubMed] [Google Scholar]
- 25.Stavropoulos P, Blobel G & Hoelz A Crystal structure and mechanism of human lysine-specific demethylase-1. Nat Struct Mol Biol 13, 626–632 (2006). [DOI] [PubMed] [Google Scholar]
- 26.Chen Y et al. Crystal structure of human histone lysine-specific demethylase 1 (LSD1). Proc Natl Acad Sci U S A 103, 13956–13961 (2006). [DOI] [PMC free article] [PubMed] [Google Scholar]
- 27.Forneris F, Binda C, Adamo A, Battaglioli E & Mattevi A Structural basis of LSD1-CoREST selectivity in histone H3 recognition. J Biol Chem 282, 20070–20074 (2007). [DOI] [PubMed] [Google Scholar]
- 28.Cerchietti LC et al. A small-molecule inhibitor of BCL6 kills DLBCL cells in vitro and in vivo. Cancer Cell 17, 400–411 (2010). [DOI] [PMC free article] [PubMed] [Google Scholar]
- 29.Polo JM et al. Specific peptide interference reveals BCL6 transcriptional and oncogenic mechanisms in B-cell lymphoma cells. Nat Med 10, 1329–1335 (2004). [DOI] [PubMed] [Google Scholar]
- 30.Monti S et al. Molecular profiling of diffuse large B-cell lymphoma identifies robust subtypes including one characterized by host inflammatory response. Blood 105, 1851–1861 (2005). [DOI] [PubMed] [Google Scholar]
- 31.Cattoretti G et al. Deregulated BCL6 expression recapitulates the pathogenesis of human diffuse large B cell lymphomas in mice. Cancer cell 7, 445–455 (2005). [DOI] [PubMed] [Google Scholar]
- 32.Shi YJ et al. Regulation of LSD1 histone demethylase activity by its associated factors. Mol Cell 19, 857–864 (2005). [DOI] [PubMed] [Google Scholar]
- 33.Yang M et al. Structural basis for CoREST-dependent demethylation of nucleosomes by the human LSD1 histone demethylase. Mol Cell 23, 377–387 (2006). [DOI] [PubMed] [Google Scholar]
- 34.Karytinos A et al. A novel mammalian flavin-dependent histone demethylase. J Biol Chem 284, 17775–17782 (2009). [DOI] [PMC free article] [PubMed] [Google Scholar]
- 35.Harris WJ et al. The histone demethylase KDM1A sustains the oncogenic potential of MLL-AF9 leukemia stem cells. Cancer cell 21, 473–487 (2012). [DOI] [PubMed] [Google Scholar]
- 36.Cusan M et al. LSD1 inhibition exerts its antileukemic effect by recommissioning PU.1- and C/EBPalpha-dependent enhancers in AML. Blood 131, 1730–1742 (2018). [DOI] [PMC free article] [PubMed] [Google Scholar]
- 37.Stamos D, Li L, Rosenfeld M & Love PE A requirement for Lysine-specific histone demethylase 1A (Lsd1) for T cell development. J Immunol 200 (2018). [Google Scholar]
- 38.Su ST et al. Involvement of histone demethylase LSD1 in Blimp-1-mediated gene repression during plasma cell differentiation. Mol Cell Biol 29, 1421–1431 (2009). [DOI] [PMC free article] [PubMed] [Google Scholar]
- 39.Ersching J et al. Germinal Center Selection and Affinity Maturation Require Dynamic Regulation of mTORC1 Kinase. Immunity 46, 1045–1058 e1046 (2017). [DOI] [PMC free article] [PubMed] [Google Scholar]
- 40.Landt SG et al. ChIP-seq guidelines and practices of the ENCODE and modENCODE consortia. Genome Res 22, 1813–1831 (2012). [DOI] [PMC free article] [PubMed] [Google Scholar]
- 41.Zhang Y et al. Model-based analysis of ChIP-Seq (MACS). Genome Biol 9, R137 (2008). [DOI] [PMC free article] [PubMed] [Google Scholar]
- 42.Egan B et al. An Alternative Approach to ChIP-Seq Normalization Enables Detection of Genome-Wide Changes in Histone H3 Lysine 27 Trimethylation upon EZH2 Inhibition. PLoS One 11, e0166438 (2016). [DOI] [PMC free article] [PubMed] [Google Scholar]
- 43.Dobin A et al. STAR: ultrafast universal RNA-seq aligner. Bioinformatics 29, 15–21 (2013). [DOI] [PMC free article] [PubMed] [Google Scholar]
- 44.Love MI, Huber W & Anders S Moderated estimation of fold change and dispersion for RNA-seq data with DESeq2. Genome Biol 15, 550 (2014). [DOI] [PMC free article] [PubMed] [Google Scholar]
- 45.Corces MR et al. An improved ATAC-seq protocol reduces background and enables interrogation of frozen tissues. Nat Methods 14, 959–962 (2017). [DOI] [PMC free article] [PubMed] [Google Scholar]
- 46.Langmead B & Salzberg SL Fast gapped-read alignment with Bowtie 2. Nat Methods 9, 357–359 (2012). [DOI] [PMC free article] [PubMed] [Google Scholar]
- 47.Li H et al. The Sequence Alignment/Map format and SAMtools. Bioinformatics 25, 2078–2079 (2009). [DOI] [PMC free article] [PubMed] [Google Scholar]
- 48.Lun AT & Smyth GK De novo detection of differentially bound regions for ChIP-seq data using peaks and windows: controlling error rates correctly. Nucleic Acids Res 42, e95 (2014). [DOI] [PMC free article] [PubMed] [Google Scholar]
- 49.Subramanian A et al. Gene set enrichment analysis: a knowledge-based approach for interpreting genome-wide expression profiles. Proc Natl Acad Sci U S A 102, 15545–15550 (2005). [DOI] [PMC free article] [PubMed] [Google Scholar]
- 50.Ramirez F, Dundar F, Diehl S, Gruning BA & Manke T deepTools: a flexible platform for exploring deep-sequencing data. Nucleic Acids Res 42, W187–191 (2014). [DOI] [PMC free article] [PubMed] [Google Scholar]
- 51.Geng H et al. Integrative epigenomic analysis identifies biomarkers and therapeutic targets in adult B-acute lymphoblastic leukemia. Cancer Discov 2, 1004–1023 (2012). [DOI] [PMC free article] [PubMed] [Google Scholar]
- 52.Yoav Benjamini YH Controlling the False Discovery Rate: A Practical and Powerful Approach to Multiple Testing. Journal of the Royal Statistical Society 57, 289–300 (1995). [Google Scholar]
- 53.Shaffer AL et al. A library of gene expression signatures to illuminate normal and pathological lymphoid biology. Immunol Rev 210, 67–85 (2006). [DOI] [PubMed] [Google Scholar]
Associated Data
This section collects any data citations, data availability statements, or supplementary materials included in this article.