

Abstract
Despite intense interest in discovering drugs that cause G-protein-coupled receptors (GPCRs) to selectively stimulate or block arrestin signalling, the structural mechanism of receptor-mediated arrestin activation remains unclear1,2. Here we reveal this mechanism through extensive atomic-level simulations of arrestin. We find that the receptor’s transmembrane core and cytoplasmic tail—which bind distinct surfaces on arrestin—can each independently stimulate arrestin activation. We confirm this unanticipated role of the receptor core, and the allosteric coupling between these distant surfaces of arrestin, using site-directed fluorescence spectroscopy. The effect of the receptor core on arrestin conformation is mediated primarily by interactions of the intracellular loops of the receptor with the arrestin body, rather than the marked finger-loop rearrangement that is observed upon receptor binding. In the absence of a receptor, arrestin frequently adopts active conformations when its own C-terminal tail is disengaged, which may explain why certain arrestins remain active long after receptor dissociation. Our results, which suggest that diverse receptor binding modes can activate arrestin, provide a structural foundation for the design of functionally selective (‘biased’) GPCR-targeted ligands with desired effects on arrestin signalling.
G-protein-coupled receptors (GPCRs) represent the largest class of drug targets, and their interactions with arrestins are emerging as a focal point for drug discovery efforts. Arrestins not only block interactions of GPCRs with G proteins, but also promote GPCR internalization and mediate a variety of G-protein-independent signalling pathways. The design of ‘biased’ drugs that cause GPCRs to favour or avoid stimulation of arrestins relative to stimulation of G proteins could lead to more effective and safer treatments for a wide range of diseases1,2.
Arrestin activation has long been associated with binding of the phosphorylated cytoplasmic tail of the receptor (RP tail), which displaces the long C-terminal tail of arrestin (C tail)3,4. Gurevich and Benovic originally proposed that arrestin activation requires interaction of the receptor with two separate sites on arrestin—a ‘phosphorylation sensor’ and an ‘activation sensor’—with arrestin undergoing an activating conformational change only when both sites are engaged4,5. Subsequent studies, including the recently reported structure of rhodopsin bound to arrestin-16,7, confirmed that the receptor binds arrestin at two distinct interfaces: the RP tail binds within a positively charged trench in the arrestin N domain, whereas the transmembrane helices and loops of the receptor (the receptor core) bind between the N domain and C domain (Fig. 1a). Multiple studies have concluded, however, that binding of the receptor core is not required for arrestin activation, as the RP tail is able to stimulate arrestin conformational change and signalling on its own8–13.
Fig. 1|. Removal of the C tail of arrestin leads arrestin to fluctuate between active and inactive states; the receptor core and RP tail each independently stabilize the active state.

a, Inactive-state (left; PDB 1CF1) and receptor-bound, active-state arrestin-1 (right; PDB 5W0P). b, Upon activation, the arrestin C domain twists with respect to the N domain. In simulations of arrestin-1 starting from its inactive state, the interdomain twist angle remained close to 0° (grey trace), while in simulations starting from its active state with rhodopsin bound, the twist angle remained close to 20° (blue trace). Thick traces represent a 50-ns sliding mean and thin traces represent unsmoothed values. c, In simulations of arrestin without its C tail and without a receptor, arrestin spontaneously transitioned between inactive and active conformations. Top, simulation of arrestin-1 with C tail removed, starting from inactive structure; bottom, arrestin-1 with C tail removed, starting from active structure. d, Distributions (histograms) of interdomain twist angles under different simulation conditions: grey, arrestin-1 with C tail (starting from inactive structure); blue, arrestin-1 bound to full-length rhodopsin (starting from active structure); green, arrestin-1 with C tail removed (starting from inactive structure); purple, arrestin-1 with C tail removed (starting from active structure); magenta, arrestin-1 bound to rhodopsin RP tail (starting from active structure); yellow, arrestin-1 bound to rhodopsin core (starting from active structure). Removal of the arrestin C tail leads to an increased range of interdomain twist angles (the standard deviation increases; P < 0.001, two-sided t-test with six simulations per condition, see Methods). Binding of either part of the receptor in simulation substantially increases the fraction of time that arrestin spends in active conformations (histograms, yellow and magenta; P = 0.002 for core binding; P = 0.003 for RP tail binding). Binding of the entire receptor has an even stronger effect (histogram, blue; P = 0.01 compared to both core-bound and to RP-tail-bound conditions). Histograms are based on all production simulations. Traces are shown for representative trajectories; all are shown in Extended Data Fig. 1.
To determine whether the receptor core plays a role in arrestin activation—and, more generally, to determine the structural mechanisms by which receptor binding at the RP tail and core interfaces brings about conformational change in arrestin—we performed extensive all-atom molecular dynamics simulations of arrestins, either free or bound to various parts of the receptor. Comparison of crystal structures of arrestin indicates that the largest conformational change arrestin undergoes upon activation is a ~20° twist of the C domain relative to the N domain7,9,14 (Fig. 1b). We used this twist angle as a primary metric of arrestin activation in simulations, but also examined other, more localized conformational changes associated with arrestin activation.
In simulation, active arrestin-1 (also known as visual arrestin) was stable when bound to co-crystallized rhodopsin, maintaining an average interdomain twist angle of 20° (Fig. 1b, Extended Data Fig. 1). Full-length inactive arrestin-1, with its C tail bound to its N domain, was also stable, although its twist angle increased slightly from the crystallographic conformation upon loss of crystal packing contacts.
By contrast, simulations of arrestin-1 with its C tail removed—mimicking the naturally occurring p44 splice variant—fluctuated between the active and inactive conformations with no receptor present (Fig. 1c, Extended Data Figs. 1, 2). Simulations initiated from the inactive crystal structure, but with the C tail deleted, reached active conformations with interdomain twist angles that matched those in the active crystal structure. Likewise, simulations initiated from the active structure—that is, after removing rhodopsin from the rhodopsin–arrestin complex, which lacks a resolved arrestin C tail—reached inactive conformations. This mobility between inactive and active conformations is consistent with the fact that p44 has been crystallized in both active and inactive conformations15,16. Simulations initiated in either conformation adopted interdomain twist angles closer to that of the crystallographic inactive conformation approximately 70% of the time (Fig. 1d), suggesting that displacement of the arrestin C tail increases arrestin’s conformational mobility but leaves it predominantly in an inactive conformation.
To investigate the contributions of receptor core and RP tail interactions to arrestin activation, we initiated simulations from the crystal structure of the rhodopsin–arrestin-1 complex, removing either the RP tail (leaving only the receptor core) or the receptor core (leaving only the RP tail). In each case, the C domain remained close to its active-state position, although not as consistently as when the entire receptor was present (average interdomain twist angles of 15.6 ± 5.1° with only the receptor core bound and 17.0 ± 5.1° with only the RP tail bound, compared to 20.6 ± 4.4 ° with both bound and 8.7 ± 6.4° with neither present) (Fig. 1d).
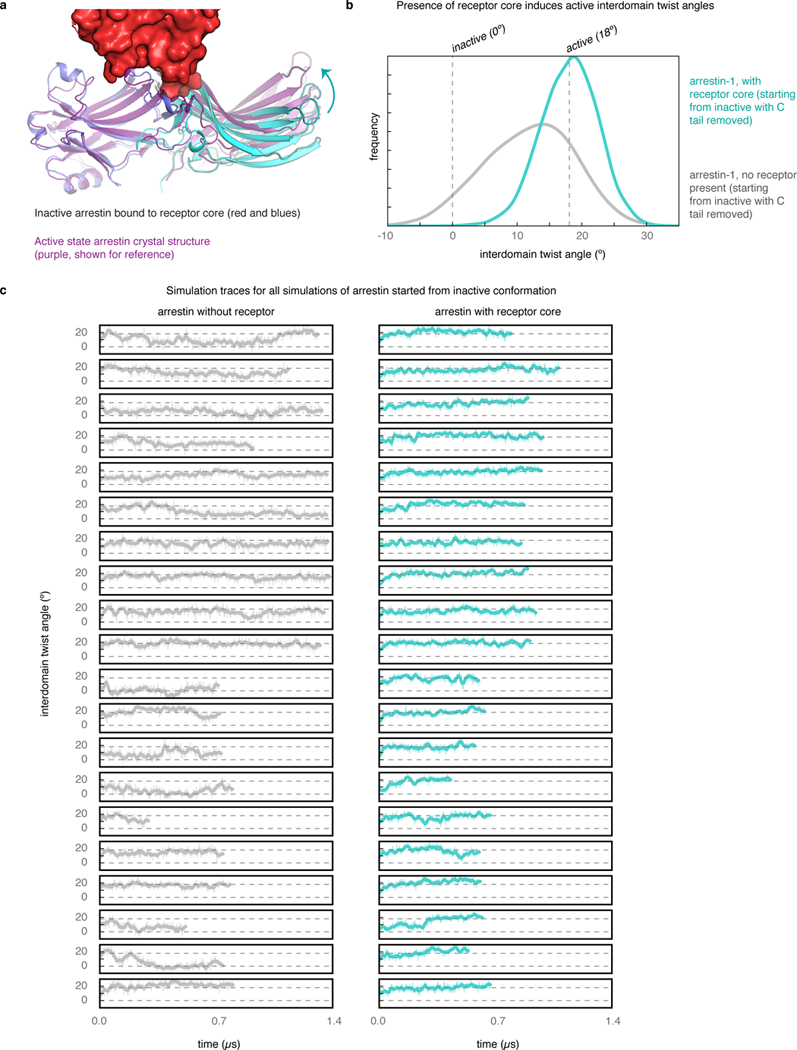
These results suggest that the receptor core and RP tail each individually stabilize the active conformation of arrestin, even though they bind at completely different interfaces, and binding of both together stabilizes it further. The simulated conformational ensembles of arrestin bound to the receptor core, the RP tail or full-length rhodopsin overlap substantially (Extended Data Fig. 2). Indeed, we were able to trigger transitions to the active state by applying force to arrestin loops that contact either the receptor core or the RP tail, as described below. We also initiated unbiased simulations from an inactive arrestin conformation, with and without the receptor core present (see Methods). The core had an immediate activating effect on the arrestin interdomain twist angle, suggesting that the core energetically disfavours inactive-like conformations as opposed to simply slowing transitions from active to inactive conformations (Extended Data Fig. 3).
How does the receptor core trigger arrestin activation? Three elements of arrestin interact with the core in the rhodopsin–arrestin-1 structure (Fig. 2a): the arrestin finger loop inserts into the receptor’s helical bundle, the C loop in the C domain of arrestin and nearby residues in the N domain interact with the second intracellular loop (IL2) of the receptor, and R318 in the back loop of the C domain forms an ionic interaction with E239 in the third intracellular loop (IL3) of the receptor.
Fig. 2|. The receptor core favours arrestin activation through interactions mediated by the receptor’s intracellular loops.

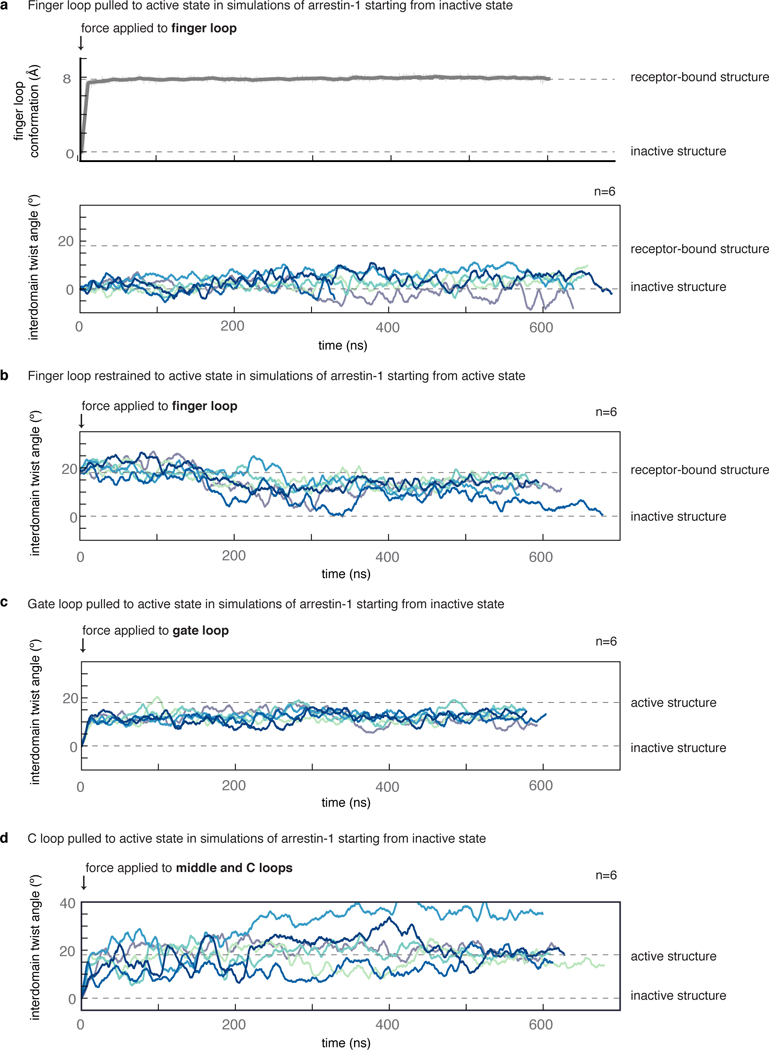
a, The core interface. b, The conformation of the finger loop is largely determined by the presence or absence of a receptor, with little coupling to the arrestin activation state. In simulations of arrestin-1 bound to the receptor core, the finger loop retains a helical conformation (blue). Upon removal of the core but in the presence of the RP tail, the finger loop collapses towards a set of disordered states (magenta), even as the global arrestin conformation remains active. This ensemble more closely resembles that observed in simulations starting from the inactive state (grey). c, Pulling the finger loop to its receptor-bound (helical) conformation does not induce twist angles characteristic of active states. d, In simulations in which the C loop is pushed away from the middle loop of the N domain, mimicking IL2 binding, arrestin adopts active conformations (six independent simulations for each condition; P = 0.002, two-sided t-test, when compared to unbiased simulations; and P = 0.0004 when compared to simulations in which the finger loop is pulled to its active state; see Methods). See Extended Data Fig. 4 for all TMD traces.
Of these elements, the finger loop undergoes by far the largest conformational change upon receptor binding, and this conformational change has therefore been suggested to trigger arrestin activation14,17. Our simulations indicate, however, that the conformation of the finger loop depends almost entirely on whether or not the receptor core is bound, with little connection to the activation state of arrestin (Fig. 2b). Moreover, mimicking the effect of receptor binding by pulling the finger loop into its receptor-bound, helical conformation had little effect on interdomain twisting (Fig. 2c, Extended Data Fig. 4). These results suggest that although the finger loop likely contributes substantially to arrestin–GPCR binding, it plays a limited role in triggering arrestin activation (Extended Data Fig. 5).
By contrast, the conformations of arrestin regions contacted by IL2 and IL3—closer into the ‘body’ of arrestin— are coupled to the global conformational state of arrestin. In simulations, when arrestin shifted from an inactive state to an active state in the absence of a GPCR, the C loop tended to move away from the nearby N domain and the back loop tended to extend away from the arrestin body (Extended Data Fig. 6). Pulling the C-loop and N-domain residues contacted by IL2 into the conformation stabilized by receptor binding caused the interdomain twisting associated with arrestin activation (Fig. 2d, Extended Data Fig. 4). The receptor core thus appears to trigger arrestin activation through interactions of receptor intracellular loops with the arrestin body. These results also suggest a possible explanation for the observation that in certain GPCRs, phosphorylated or acidic residues on IL3 promote arrestin binding and activation18: these negatively charged residues might interact with positively charged residues on the back loop, which are found in all arrestin isoforms.
How does the RP tail favour arrestin activation, and how does the arrestin C tail prevent it? Both bind in the same groove in the N domain of arrestin, adjacent to the gate loop of the C domain. Our simulations suggest that, despite their opposing effects, both the RP tail and the C tail influence arrestin activation by favouring particular conformations of the gate loop. The C tail is coupled to the gate loop through a network of highly conserved ionic interactions known as the polar core19, including residue D296 at the base of the loop (Fig. 3a, b, left). Our simulations indicate that the position of D296 is tightly coupled to interdomain twisting; when D296 moves in the direction of the C domain, the adjoining -strand (residues 292–296) moves with it, pushing against the C domain and causing it to twist (Fig. 3b, c, Extended Data Fig. 7). Removal of the C tail disrupts the polar core and allows the gate loop to flip to an alternative conformation, thus allowing D296 and the entire C domain to fluctuate between their inactive and active positions (Fig. 3c). In simulations in which the RP tail is bound, an interaction between phosphoserine pS338 and K300 stabilizes a particular gate loop conformation that shifts D296 away from the RP-tail-binding groove (Fig. 3a). Indeed, pulling the gate loop into the conformation favoured by RP tail binding in targeted molecular dynamics (TMD) simulations caused the interdomain twisting motion associated with arrestin activation (Fig. 3d, Extended Data Fig. 4).
Fig. 3|. The RP tail induces arrestin activation, and the arrestin C tail prevents activation, by controlling the conformation of the gate loop.
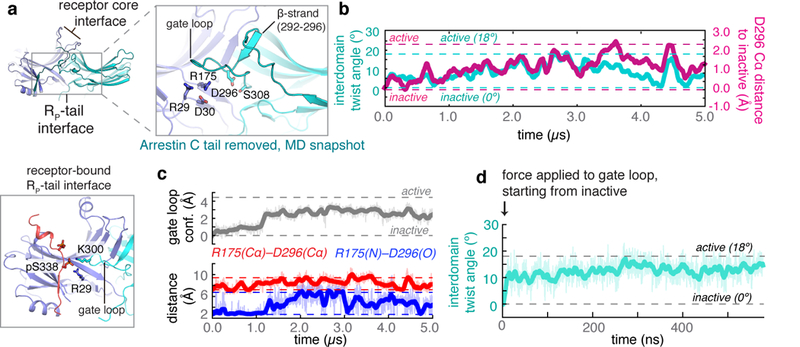
a, Removal of the arrestin C tail from inactive arrestin frees the gate loop to adopt an alternative conformation, allowing the R175–D296 interaction to break and allowing D296 to frequent its active position (simulation snapshot, upper left). In active structures, an RP tail phosphoserine engages the gate loop, stabilizing the position of D296 (bottom left). b, The relative position of D296 correlates with interdomain twist angle (R2 = 0.586 across six simulations), as seen in a simulation starting from the inactive state with the arrestin C tail removed. c, Conformational changes in the gate loop towards more active-like conformations (grey trace; see Methods for description of the metric) correlate with disruption of the polar core. When the gate loop is inactive, the R175–D296 interaction (blue trace) is broken only 3.3% of the time, with the R175–D296 Cα atoms achieving active-like separation distances (red trace) only 4.0% of the time (across six independent simulations initiated from the inactive structure with the C tail removed; see Methods). By contrast, when the gate loop populates intermediate and active conformations, the R175–D296 interaction is broken 44.6% of the time, with the R175–D296 Cα atoms achieving active-like separation distances 74.1% of the time. Dashed lines indicate crystallographic positions for each metric. See Extended Data Fig. 7 for all traces. d, Pulling the gate loop towards the conformation observed in active-state crystal structures favours active interdomain twist angles (six independent simulations initiated from the inactive structure with the C tail removed; P = 4 × 10⁻⁶, two-sided t-test when compared to unbiased simulations; see Methods).
Our computational results imply that the two GPCR-binding interfaces of arrestin are allosterically coupled to one another. In particular, our simulations indicate that both motion of the gate loop (at the RP-tail-binding interface) and motion of the C loop (at the receptor-core-binding interface) are coupled to interdomain twisting. Motion of the C loop leads to interdomain twisting and thus to motion in the gate loop, and vice versa.
To validate this mechanism, we used fluorescently labelled arrestin mutants that report on the position of the C loop and the gate loop of arrestin-1 (Fig. 4a). We examined the individual and combined effects of receptor core binding and RP tail binding on arrestin conformation using light-activated, non-phosphorylated rhodopsin (Rho*); inactive, non-phosphorylated opsin (Ops); and their phosphorylated counterparts (Rho*P and OpsP). Receptor activation is required for tight core binding, and phosphorylation is required for tight tail binding6,9.
Fig. 4|. Fluorescence spectroscopy supports computational predictions.
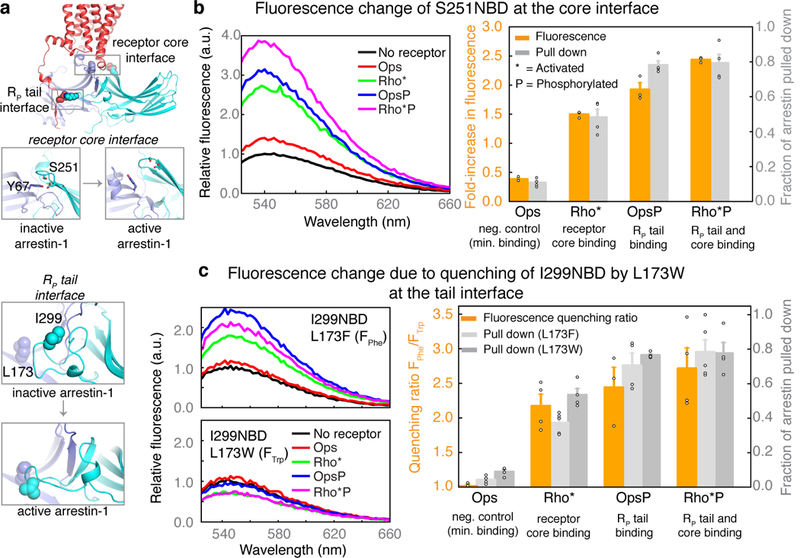
a, Fluorescently labelled arrestin mutants used to monitor conformational changes at the core interface (S251NBD) and RP tail interface (I299NBD/L173F and I299NBD/L173W). b, Interdomain twisting in arrestin mutant S251NBD separates a quenching tyrosine at site 67 from the fluorophore at site 251 (left), resulting in increased fluorescence. Increased fluorescence relative to Ops was observed in the presence of Rho* (P = 2 × 10⁻⁵, two-sided t-test), OpsP (P = 0.005) and Rho*P (P = 1 × 10⁻⁷) (middle and right panels; orange bars show fold-increase relative to unbound condition; n = 3 for each condition). neg., negative; min., minimal. c, Disruption of the polar core is accompanied by a movement of the gate loop (left), which can be detected by quenching of the NBD fluorophore at site 299 by a tryptophan at site 173. As a control, site 173 is also mutated to non-quenching phenylalanine. The quenching ratio (FPhe/FTrp) is calculated from the spectra of I299NBD/L173F and I299NBD/L173W mutants (middle panel). Substantial increases in the quenching ratio over Ops were observed in the presence of the receptor core (P = 0.005), RP tail (P = 0.04) or both (P = 0.01), indicating that all three favoured active-like conformations of the gate loop (Rho*, Rho*P, n = 4; Ops, OpsP, n = 3). Centrifugal pull-down analysis for all mutants (grey bars) indicates that fluorescence quenching corresponded to arrestin activation and receptor binding (Rho* and Rho*P with arrestin (L173F), n = 5; all other mutants, n = 4). Fluorescence and pull-down measurements are plotted in the bar charts as mean ± s.e.m.; representative steady-state fluorescence spectra are shown.
To probe C-loop position, we used an arrestin mutant labelled with the fluorophore NBD at site 251 on the C loop. Upon arrestin activation, site 251 moves away from the nearby quenching residue Y67 in the N domain, which leads to increased fluorescence from a fluorophore placed at site 25120 (Fig. 4b). We observed that both receptor core binding (Rho*) and RP tail binding (OpsP) induced increases in fluorescence (1.5-fold and 1.9-fold, respectively) (Fig. 4b, Extended Data Fig. 8). Engagement of both the receptor core and RP tail (Rho*P) induced an even larger increase in fluorescence (2.4-fold). The change in fluorescence induced by the RP tail of OpsP is particularly notable, considering that the RP tail binds far from the receptor core interface and the C loop.
To probe gate loop position, we used the arrestin mutants I299NBD/L173W and I299NBD/L173F. Upon arrestin activation, the NBD fluorophore at site 299 in the gate loop moves close to site 173 in a nearby β-sheet (Fig. 4c). By comparing the changes in fluorescence with a quenching tryptophan or a non-quenching phenylalanine at site 173, we can calculate a quenching ratio (FPhe/FTrp), which increases as the gate loop moves to the active conformation16. The quenching ratio increased substantially not only upon binding to OpsP (FPhe/FTrp = 2.4) and Rho*P (FPhe/FTrp = 2.7), which include an RP tail, but also upon binding to the receptor core only (Rho*, FPhe/FTrp = 2.2). This observation demonstrates that binding of the receptor core induces movement of the distant gate loop to its active conformation. Our experimental results, taken together, confirm our computational finding that receptor core and RP tail binding can each independently cause the global conformational changes in arrestin required for activation.
Our study focused on arrestin-1, the arrestin isoform for which the most structural data are available. The very high level of structural homology between different arrestins suggests a similar mechanism for β-arrestins5. We performed simulations of arrestin-2 (β-arrestin-1) under several conditions, and the results are consistent with a similar activation mechanism (Extended Data Fig. 9), despite certain functional differences between arrestins21. A wide variety of previously published data also supports the hypothesis that the receptor core and RP tail each independently promote activation of β-arrestins (Extended Data Table 1).
More generally, our results agree with, and shed new light on, a wealth of data spanning at least three decades of research (Extended Data Table 1). Several cellular-level studies reported that even in the absence of an RP tail or other phosphorylated cytoplasmic site, stimulated GPCRs mediate processes associated with arrestin activation; we suggest that this reflects arrestin activation via the receptor core interface22,23. Multiple spectroscopy-based studies identified dynamic sites at both the core and RP tail interfaces that undergo conformational changes upon receptor binding20,24; our simulations now reveal which of these changes drive arrestin activation. Additionally, our observation of allosteric coupling between receptor-binding surfaces on arrestin provides a direct structural explanation for how several well-known arrestin mutations within the core-binding and RP-tail-binding interfaces shift the conformational equilibrium of arrestin towards the active state (Extended Data Table 1, Extended Data Fig. 7).
Our results suggest that GPCRs could stimulate arrestins through at least three different binding modes: through interactions mediated by both the receptor core and the RP tail, by the RP tail only, or by the receptor core only. The first two modes have been observed experimentally in several recent studies12,13,. The third mode may explain how some receptors lacking C-terminal phosphorylation undergo arrestin-mediated internalization23 and how a receptor with the RP tail removed can still stimulate cellular events associated with β-arrestin signalling (described in the Article by Eichel et al.25). These binding modes would differ in affinity, lifetime, and propensity for arrestin activation, leading to distinct cellular effects26,27.
Recent reports have noted a curious persistence of receptor-induced conformational changes and signalling activity of β-arrestins long after receptor dissociation22,28,29. Our findings offer a potential structural explanation for this persistent arrestin-mediated signalling. As seen in our simulations, arrestin with a displaced C tail frequents active conformations even in the absence of a receptor. In β-arrestins, the displaced C tail can bind to AP2 and clathrin30,31, slowing its re-association with the arrestin body once the receptor has dissociated.
Nevertheless, two caveats are in order. First, our simulations do not reveal the order of events during the arrestin activation process, as we have not simulated the full process of GPCR–arrestin association—particularly arrestin C-tail dissociation, which is likely to be the rate-limiting step5,32. Second, we have not explored the structural and functional effects of different phosphorylation patterns; this is a topic for future work.
Our results not only show that the receptor core and RP tail can each drive arrestin activation on their own, but also suggest a key difference between how the receptor core stimulates arrestin activation and how it stimulates G protein activation. Crystal structures show that both the G protein C-terminal helix and the arrestin finger loop bind to the GPCR in a pocket between transmembrane helices 3, 5, 6 and 7, with the GPCR adopting similar conformations. Previous work has indicated that binding to this pocket triggers G protein activation33. Our current study suggests that the key structural changes that give rise to arrestin activation originate less in this pocket than at the interfaces of arrestin with the intracellular loops (IL2 and IL3) of the receptor. Therefore, although the receptor core adopts similar conformations in existing crystal structures of complexes with G proteins and arrestins, certain receptor core conformations might favour arrestin stimulation over G protein stimulation, or vice versa. This provides a possible avenue for the design of biased ligands.
METHODS
System setup for molecular dynamics simulations
We simulated arrestin-1 under six conditions, initiated from the following structures: (1) the inactive-state crystal structure of bovine arrestin-1 bound to the crystallographic fragment of its C tail (PDB entry 1CF1, chain A, residues 10–362 and 374–393)19; (2) the same inactive-state crystal structure with the C tail removed (residues 374–393); (3) the active-state crystal structure of arrestin-1 bound to full-length rhodopsin with residues Thr336 and Ser338 phosphorylated (PDB entry 5W0P)7; (4) the same active-state crystal structure of arrestin-1 bound to the receptor core of rhodopsin only (residues 1–324); (5) the same active-state crystal structure of arrestin-1 bound to the rhodopsin RP tail only (residues 325–344, with Thr336 and Ser338 phosphorylated; these simulations used an earlier refinement of the now-published 5W0P crystal structure, available upon request); and (6) an active-state structure of arrestin that was determined in complex with rhodopsin (PDB entry 4ZWJ)34, but with the entire rhodopsin molecule removed for simulation. For simplicity, we refer to the co-crystallized receptor, a constitutively active mutant of opsin, as ‘rhodopsin’ throughout our manuscript. Residue numbers refer to bovine rhodopsin and arrestin-1.
We also performed simulations of arrestin-2 under four conditions, initiated from the following structures: (1) the inactive-state arrestin-2 crystal structure bound to the crystallographic fragment of its C tail (PDB entry 1G4M, chain A, residues 5–361 and 372–386)35; (2) the same inactive-state crystal structure with the C tail removed; (3) the active-state arrestin-2 crystal structure bound to the V2 vasopressin receptor (V2R) RP tail (PDB entry 4JQI)9; and (4) the active-state arrestin-2 crystal structure with the V2R RP tail removed. For simulations starting from the active state of arrestin-2, we removed the co-crystallized Fab30 antibody. Simulations containing rhodopsin’s receptor core included a lipid bilayer; in these simulations, palmitoyl modifications, which help to anchor helix 8 of rhodopsin in the membrane, were added to residues 322 and 323. In some simulations, we restrained the residues in the finger loop to examine whether maintaining the finger loop in its receptor-bound helical conformation favoured the active state. In other simulations, we used TMD to pull the conformations of various local regions in arrestin, including the finger loop, the gate loop and the C loop, from their inactive crystallographic conformation to their receptor-bound crystallographic conformation. We performed multiple simulations for each condition (Supplementary Table 1). For each simulation, initial atom velocities were assigned randomly and independently.
Simulation coordinates were prepared by removing non-protein molecules from all initial crystal structures. Prime (Schrödinger) was used to model missing side chains and loops, and neutral acetyl and methylamide groups were added to cap protein termini. In arrestin simulations, we retained titratable residues in their dominant protonation state at pH 7. In rhodopsin simulations, Asp83, Glu122 and Glu134 were protonated, in accordance with evidence that these residues become protonated upon activation36. Constitutively activating mutations present in the rhodopsin–arrestin-1 crystal structure, including N2C/N282C and E113Q/M257Y, were retained in these simulations to ensure that rhodopsin retained an active conformation while bound to arrestin. Histidines were represented with hydrogen on the epsilon nitrogen except in cases where addition of hydrogen to the delta nitrogen helped to optimize the local hydrogen bond network.
For simulations performed in the presence of a bilayer, the prepared protein structures were aligned on the transmembrane helices to the Orientation of Proteins in Membranes (OPM) structure for PDB 4ZWJ. The aligned structures were then inserted into either a pre-equilibrated palmitoyl-oleoyl-phosphatidylcholine (POPC) bilayer or a box of water (for simulations of arrestin alone) using in-house simulation preparation software37. Sodium and chloride ions were added to neutralize each system at a concentration of 150 mM. Water-box dimensions were chosen to maintain at least an 18 Å buffer between protein images in all dimensions. Bilayer dimensions were chosen to maintain at least a 35 Å buffer between protein images in the x–y plane and a 20 Å buffer between protein images in the z direction. System dimensions are listed in Supplementary Table 1 for each simulation condition.
Simulation protocols
For all simulations, we used the CHARMM36 force field for proteins, lipids and ions and the TIP3P model for waters38–42. We generated parameters for the custom residue palmitoylcysteine using the Paramchem webserver43–45.
We performed the majority of simulations using the Compute Unified Device Architecture (CUDA) version of Particle-Mesh Ewald Molecular Dynamics (PMEMD) in AMBER on one or two graphical processing units (GPUs)46. Simulations were performed using the AMBER15 and AMBER16 software47. Systems were heated from 0 K to 100 K in the NVT ensemble over 12.5 ps and then from 100 K to 310 K in the NPT ensemble over 125 ps, using 10.0 kcal mol−1 Å−2 harmonic restraints applied to lipid and protein heavy atoms. Systems were then equilibrated at 310 K in the NPT ensemble at 1 bar, with harmonic restraints on all protein heavy atoms tapered off by 1.0 kcal mol−1 Å−2 starting at 5.0 kcal mol−1 Å−2 in a stepwise fashion every 2 ns for 10 ns and then by 0.1 kcal mol−1 Å−2 in a stepwise fashion every 2 ns for 20 ns. Production simulations were performed in the NPT ensemble at 310 K and 1 bar, using a Langevin thermostat for temperature coupling and a Monte Carlo barostat for pressure coupling. These simulations used a 4-fs time step with hydrogen mass repartitioning48. Bond lengths to hydrogen atoms were constrained using SHAKE. Non-bonded interactions were cut off at 9.0 Å, and long-range electrostatic interactions were computed using particle mesh Ewald (PME) with an Ewald coefficient of approximately 0.31 Å and an interpolation order of 4. The FFT grid size was chosen such that the width of a grid cell was approximately 1 Å. Trajectory snapshots were saved every 200 ps.
Prior to performing the extensive set of AMBER simulations described above, we performed three simulations of arrestin-1 on the Anton machine at the Pittsburgh Supercomputing Center (simulations 10, 11 and 39 in Supplementary Table 1)49. Systems first underwent the equilibration protocol described above in AMBER15 with a 2.5-fs time step and no hydrogen mass repartitioning. We then transferred equilibrated systems to Anton and performed production runs of 6–8 μs in length with a RESPA integrator, which employed a time step of 2.3333 fs and calculated long-range electrostatics every three time steps, or once every 7 fs. These simulations employed u-series electrostatics (C. Predescu et al., unpublished). Trajectory snapshots were saved every 240 ps. These initial simulations motivated our further exploration of arrestin-1 conformational dynamics because they established that arrestin exhibits extreme conformational flexibility in the absence of its C tail, starting from either active or inactive conformations.
TMD and restrained molecular dynamics simulations were conducted on GPUs using the OpenMM molecular simulation platform with the Plumed 2.01 plug-in to introduce the additional energy term50–52. In all TMD conditions, the force constant k was increased linearly from 0 to 20 kcal mol–1 Å–2 during the first 10 ns of production and then held constant at 20 kcal mol–1 Å–2 for the remainder of the simulation, as done in a previous study53. Simulations ran for 500–600 ns. For simulations involving the gate loop (residues 295–306) and finger loop (residues 67–80), we applied the pulling force to backbone Cα atoms and aligned the simulated structure to the reference structure on the N domain of arrestin. For the C loop, we aligned simulated structures on only the residues to which we also applied the force—namely, residues within contact of the rhodopsin IL2 on the middle loop (residues 132–143) and C loop (residues 245–257) in the recent rhodopsin–arrestin crystal structure (PDB entry 5W0P). For traces that display interdomain twisting in TMD simulations, we display the 5 ns of equilibration before application of the pulling force.
In order to obtain a conformation of arrestin in an inactive state with the receptor core present, we performed twenty independent TMD simulations to pull the arrestin to the inactive state in the presence of the receptor core (after removing the RP tail). As above, forces were applied to backbone Cα atoms within the β-sheets of the C domain that were not in contact with the receptor core in the rhodopsin–arrestin crystal structure (residues 202–210, 220–228, 234–242, 260–264, 272–280, 328–336 and 344–352) and increased linearly over 100 ns of simulation to 10.0 kcal mol−1 Å−2. We chose a simulation frame that exhibited the minimum root mean square deviation (r.m.s.d.) from the inactive state crystal structure (PDB 1CF1, chain A), calculated on the atoms used for pulling, from 20 independent TMD simulations (r.m.s.d. = 0.856 Å). This initial inactive conformation possessed at least three characteristics of inactive states: in addition to the low interdomain twist angle, the gate loop exists in a configuration it can spontaneously adopt in simulations of arrestin with just the C tail removed, and the polar core interaction between R175 and D296 is reformed.
In order to examine the effect of the receptor core on the inactive state of arrestin-1, we then initiated 20 production simulations with randomized velocities from this snapshot and from the same snapshot but with the receptor core removed in AMBER. For the simulations with receptor core removed, we prepared the system in a water box and performed a shortened equilibration protocol, as described above (with restraints tapered every 1 ns, rather than every 2 ns), before performing the production simulations. Not all production simulations were of the same length owing to limited computing resources.
Analysis protocols for molecular dynamics simulations
The AmberTools15 CPPTRAJ package was used to reimage and centre trajectories54. Simulations were visualized and analysed using Visual Molecular Dynamics (VMD)55. Time traces from simulation were smoothed using a moving average with a window size of 50 ns unless otherwise indicated and visualized with the PyPlot package from Matplotlib. For all analysis in the manuscript that required structural alignment, including calculation of interdomain twist angle and projection metric (described below), we aligned arrestin structures on the N domain of inactive arrestin-1 (residues 11–179, PDB entry 1CF1).
Throughout the manuscript, we report an interdomain twist angle. This corresponds to how much the C domain rotates away from its position in the inactive crystal structure relative to the N domain. In order to capture rotation towards more active-like or inactive-like conformations, we measure rotation about a particular axis: the rotation axis that defines the displacement of the C domain (relative to the N domain) between the inactive and active arrestin-1 crystal structures. Thus the inactive crystal structure has an interdomain twist angle of 0°; positive interdomain twist angles represent motion in the direction seen in the active crystal structure; and negative interdomain twist angles represent motion in the opposite direction. For calculations in Extended Data Fig. 9, we replace the arrestin-1 inactive state structure with the inactive arrestin-2 crystal structure (PDB entry 1G4M). We use the rhodopsin-bound arrestin-1 structure as the active state structure for these calculations, as this is the only available structure of an arrestin bound to a receptor core.
To estimate distributions of interdomain twist angles for each simulation condition (‘histograms’), we used a Gaussian kernel density estimator from Python’s scikit-learn package with a covariance factor of 0.25°.
To quantify the position and conformation of the gate loop, finger loop or back loop in a given simulation frame (Fig. 3, Extended Data Figs 1, 6, 7), we used a metric that specifies how ‘active-like’ or ‘inactive-like’ the loop’s conformation is. In particular, we represent the positions of all gate loop (or back loop) C-alpha atoms as a single vector containing their Cartesian coordinates; this might be thought of as a point in a 3n-dimensional space, where n is the number of gate loop (or back loop) residues. The crystallographic inactive and active conformations of the gate loop (or back loop) can also each be represented as a point in this 3n-dimensional space. We project the vector representing the gate loop (or back loop) in a given simulation frame onto the line connecting the crystallographic active and inactive conformations. We then report the position of the projected point on that line, using the convention that the inactive conformation is at 0 and positive values indicate change in the direction of the active conformation. The result is that more active-like conformations will be assigned larger values than more inactive-like conformations. In particular, the crystallographic inactive conformation will be assigned a value of 0 Å, and the crystallographic active conformation will be assigned a value equal to its r.m.s.d. from the inactive conformation. We performed a similar analysis in which we aligned on the N domain and computed the projection metric on the entire C domain (Extended Data Fig. 1).
For principal component analysis (PCA), we applied the PCA class in scikit-learn to the Cartesian coordinates of Cα atoms for residues 11–360 across all six simulation conditions for arrestin-1 after aligning every simulation on the N domain (residues 11–179) of the inactive-state crystal structure, using simulation trajectories downsampled every 20 ns (for computational efficiency), after removing the first 500 ns in order to reduce the effects of initial transients (that is, achieve better equilibration).
To test the significance of differences in trajectories between simulations performed under different conditions, we used a two-sided Welch’s t-test, treating each independent simulation as a separate data point. We performed six production simulations under each condition (n = 6), excluding the first 500 ns of each from the analysis in order to reduce the effects of initial transients (that is, achieve better equilibration). We compared standard deviations of interdomain twist angle to test claims about differences in ranges of these angles. We compared means of interdomain twist angle to test claims about differences in extent of activation.
In Fig. 1d (top and middle panels), we tested the hypothesis that removing the arrestin C tail increased the range of interdomain twist angles visited in simulation. Removing the arrestin C tail increased the range of interdomain twist angles visited in simulation for simulations starting from the inactive-state structure (green versus grey histograms; P = 0.0007). We also found that simulations starting from arrestin’s active-state structure in the absence of both the receptor and the C tail visited an increased range of interdomain twist angles compared to simulations starting from the inactive-state structure in the presence of arrestin’s C tail (purple versus grey histograms; P = 0.0002).
In Fig. 1d (top and bottom panels), we also found that binding of both the receptor core and RP tail (dark blue histogram) together led to an increase in the average interdomain twist angle sampled in simulation compared to simulations in which only the receptor core was bound (yellow histogram; P = 0.005) or in which only the RP tail was bound (magenta histogram; P = 0.01).
To determine the fraction of the time the polar core exhibited active-like conformations when the gate loop moved towards the active state, we treated the gate loop as inactive if its conformation had deviated less than 1 Å from the inactive state and active-like if its conformation had deviated at least 2 Å from the inactive state, towards the active state. We treated the polar core ionic interaction as active if the side chain polar atoms were separated by at least 4 Å and the polar core Cα distance as active if the Cα atoms came within 0.5 Å of the active-state separation distance (approximately the standard deviation of that metric in simulation of the active-state crystal structure). These calculations refer to the condition in which arrestin was simulated from its inactive state with its C tail removed.
Preparation of opsin and rhodopsin
Bovine retinas were extracted from eyes obtained from a local abattoir under dim red light and frozen in 45% buffered sucrose solution. Rod outer segments (ROS) were isolated from these retinas under dim red light using discontinuous sucrose-gradient centrifugation as previously described56. Briefly, 100 to 200 thawed retinas were shaken to break off outer segments, and the suspension was centrifuged (2,500g, 5 min). The supernatant was filtered through cheesecloth, diluted 1:1 slowly with ROS buffer (70 mM potassium phosphate, 1 mM MgCl2, 0.1 mM EDTA, 1 mM DTT, 0.5 mM PMSF, pH 7), and then centrifuged (6,000g, 10 min). The pellets were gently homogenized in 25.5% sucrose (1.105 g ml–1) and then layered onto four gradients composed of 27.125% (1.115 g ml–1) sucrose underlaid with 32.25% (1.135 g ml–1) sucrose. The gradients were centrifuged in a swinging bucket rotor at 83,000g for 30 min. ROS were collected at the 1.115 g ml–1–1.135 g ml–1 interface and then snap frozen in liquid N2.
For rhodopsin phosphorylation, ROS were thawed and diluted about 1:1 in ROS buffer under dim red light. ATP (8 mM), MgCl2 (1 mM) and 11-cis-retinal (10–20 μM) were added. Note that 11-cis-retinal was purified by HPLC using commercially available all-trans-retinal as the starting reagent57. The ROS suspension was divided between Falcon tubes and placed on a rocking platform under a standard desk lamp at room temperature. After 2 h, 50 mM NH2OH was added to convert all rhodopsin photoproducts to opsin. ROS were then washed several times by pelleting the membranes by centrifugation followed by resuspension in a generous volume of potassium phosphate buffer (100 mM, pH 7). Membranes were then washed once more in 50 mM HEPES pH 7. The collected pellets were resuspended in a small volume of HEPES buffer, aliquoted, and snap frozen in liquid N2. Note that non-phosphorylated membrane preparations were treated in exactly the same way, except that ATP was omitted before light-exposure of the ROS.
Rhodopsin was regenerated by the addition of a threefold molar excess of 11-cis-retinal to opsin membranes (>1-h incubation in the dark, room temperature). Regeneration was terminated by the addition of NH2OH, which was then washed away using the wash protocol described above. Rhodopsin concentration was determined by the loss of 500-nm absorbance (extinction coefficient 0.0408 μM–1cm–1) after bleaching (>495 nm) the membranes diluted 1:20 in 100 mM NH2OH. High levels of phosphorylation in phosphorylated rhodopsin preparations were confirmed using the ‘extra meta II’ assay56,58 and isoelectric focusing59.
Preparation of fluorescently labelled arrestin mutants
Mutations were introduced into a ‘base construct’ consisting of bovine arrestin-1, with an additional glycine inserted after the first methionine, and the following mutations: C63A, C128S, C143A and W194F. This recombinant arrestin gene was cloned into the pET15b vector for bacterial expression60. For this study, the S251C, I299C/L173F and I299C/L173W mutants were used, which were previously created for other studies16,61. Arrestin mutants were expressed and purified by two-step ion-exchange chromatography as described60. Briefly, plasmid DNA was used to transform Escherichia coli BL21 (DE3) competent cells (New England Biolabs) and plated onto LB medium containing ampicillin. A single colony was used to inoculate 5 ml LB containing ampicillin (100 μg ml–1), which was incubated for 8 h with shaking (at 28 °C). This starter culture was used to inoculate 150 ml LB plus ampicillin, which was incubated overnight with shaking (28 °C) and then split between four flasks each containing 2 l LB plus ampicillin. The cells were induced with 30 μM IPTG upon reaching an absorbance (A600 nm) of 0.6 and then allowed to grow for more than 16 h (28 °C) before harvesting by centrifugation. The cells were resuspended in cold lysis buffer (10 mM Tris-HCl, 2 mM EDTA, 100 mM NaCl, 5 mM DTT, pH 7.5) and lysed using a microfluidizer (Microfluidics) in the presence of DNase. The lysate was centrifuged (27,000g, 30 min) and (NH4)2SO4 was added to the supernatant (0.32 g ml–1). The precipitant was collected by centrifugation and then resuspended in 10 mM Tris-HCL, 2 mM EDTA, 5 mM DTT, pH 7. The protein suspension was cleared by centrifugation and filtration and loaded onto three 5-ml HiTrap heparin columns (GE Healthcare), while diluting 1:3 with 10 mM Tris-HCl, 2mM EDTA, 100mM NaCl, 5mM DTT, pH 7. The loaded column was then washed with the same buffer, and a gradient of NaCl (0.1–0.5 M) was applied to elute the arrestin. SDS–PAGE was used to identify arrestin-containing fractions, which were pooled and filtered, and 5mM DTT was added. This protein was loaded onto a 5-ml HiTrap SP column coupled to a HiTrap Q column (GE Healthcare) while diluting 1:10 with 10mM Tris-HCl, 2mM EDTA, 5mM DTT, pH 8.5. After loading, the SP column was removed, and the Q column was washed with buffer. Arrestin was eluted with a two-step NaCl gradient; 0–0.1 M and 0.1–0.5 M. The arrestin-containing fractions were again identified by SDS–PAGE, pooled and concentrated; buffer was exchanged against isotonic buffer (50 mM HEPES, 130 mM NaCl, pH 7), aliquoted, and snap frozen in liquid N2.
Single-cysteine arrestin mutants were labelled with the fluorophore NBD (N,N′-dimethyl-N-(iodoacetyl)-N’-(7-nitrobenz-2-oxa-1,3-diazol-4-yl)ethylenediamine) (ThermoFisher Scientific). Arrestin was diluted to 20–50 μM in isotonic buffer and NBD stock (~20 mM solubilized in DMSO) was added in sequential additions of tenfold molar excess every hour. Total DMSO concentration in the labelling reaction was maintained <5%. After 3 to 5 h, the excess label was removed by multiple concentration–dilution steps using centrifugal microconcentrators (Amicon Ultra-0.5, 10-kDa cutoff) followed by size-exclusion chromatography (Sephadex G15 from Sigma). Concentration and labelling efficiency was determined using the extinction coefficients 0.025 μM–1cm–1 for NBD, 0.02636 μM–1 cm–1 for I299C/L173W and 0.02076 μM–1 cm–1 for S251C and I299C/L173F.
Fluorescence spectroscopy
Steady-state fluorescence was measured using a SPEX Fluorolog (1680) instrument in front-face mode. The samples were excited at 500 nm, and emission was collected at 524–660 nm (2-nm step size, 0.5-s integration per point). Excitation slits were kept <0.2 mm to minimize light-activation of rhodopsin, and emission was collected through 4-mm-wide slits. Samples (100 μl) were placed in a black-jacketed fluorescence cuvette with a small window (2 × 5 mm) and 3-mm path length (Hellma Analytics). Samples generally contained 1 μM fluorescently labelled arrestin with or without ROS membranes containing 10 μM opsin (Ops), phosphorylated opsin (OpsP), rhodopsin (Rho) or phosphorylated rhodopsin (RhoP). Opsin experiments were performed in 50 mM HEPES pH 8.5 to favour the inactive receptor core conformation62 and promote robust arrestin association to OpsP56. Rhodopsin experiments were performed in isotonic buffer (50 mM HEPES, 130 mM NaCl, pH 7). Fluorescence was measured in the dark-state and after light-activation (>495 nm, 10 s). Sigma Plot 13.0 was used for processing fluorescence spectra (for example, subtracting background fluorescence, normalizing spectra, determining integrated fluorescence intensity). Spectra were normalized to the spectrum of the unbound condition. In Fig. 4, we show fluorescence spectra for the unbound condition (black traces) obtained under isotonic conditions. The same spectra obtained under low salt conditions were nearly identical (data not shown). For the arrestin mutant I299NBD/L173W, the quenching ratio was determined by comparison of its steady-state fluorescence intensity to that of the control mutant, I299NBD/L173F. The quenching ratio is defined as FPhe/FTrp, where FPhe is the integrated, normalized fluorescence intensity of the unquenched control, and FTrp is the integrated, normalized fluorescence intensity of the tryptophan-containing mutant63. Each of the fluorescence quenching ratio data points in Fig. 4c is calculated as the ratio of integrated fluorescence in a single I299NBD/L173W experiment and integrated fluorescence in a single I299NBD/L173F experiment, resulting in a larger spread among the data points relative to those reported for S251NBD fluorescence. Note that for the S251NBD mutant, in which Y67 quenches the fluorophore at site 251 in the basal state of arrestin, no unquenched control is available, since replacing site 67 with phenylalanine results in protein precipitation (as previously reported16). Despite this, we have established that the intrinsic fluorescence changes of the labelled S251C mutant indicate loop movements in the region of the C loop relative to the base of the finger loop16,20,61.
Centrifugal pull-down analysis
Identical samples as prepared for fluorescence experiments were subjected to pull-down analysis, to quantify the amount of arrestin bound to ROS membranes for each experiment. Briefly, 50-μl samples of the same composition as described above were centrifuged at 20,800g for 10 min. Rhodopsin-containing samples were light-activated (>495 nm, 15 s) just before centrifugation. Following centrifugation, the supernatant was removed, and the pellets were solubilized in loading buffer containing 2% SDS and subjected to SDS–PAGE. Bands were visualized with Coomassie dye and gels were scanned using an Epson photo scanner. Bands were quantified using the free online program GelQuant.NET (Version 1.8.2). Binding is expressed as a percentage of the total amount of arrestin present in each experiment (2.25 μg).
Extended Data
Extended Data Fig. 1|. Interdomain twist angles and global projection metric values for six arrestin-1 simulation conditions.

Dashed lines indicate the interdomain twist angles in the inactive (0°) and active (18°) state crystal structures and the projection metric values in the inactive (0.0 Å) and active (8.15 Å) state structures. Thick traces indicate the moving average smoothed over a 50-ns window, and thin traces represent unsmoothed data. For each simulation, a pair of plots is shown, one immediately above the other. The top plot (dark colours) shows the interdomain twist angle. The bottom plot shows the projection metric, an alternative means of capturing global conformational change. In one simulation (red box, lower right corner), the RP tail became unbound from arrestin, which resulted in inactive twist angles. All other simulations in that condition maintained stable binding to the RP tail.
Extended Data Fig. 2|. Global conformational behaviour of arrestin-1 in simulation.

a, The r.m.s.d. from the inactive structure for representative simulations of arrestin-1 starting in its inactive state with: the C tail removed (green), arrestin-1 with the C tail present (grey), or arrestin-1 bound to full-length rhodopsin (blue). The simulation of arrestin-1 with its C tail removed transitions to active conformations and achieves r.m.s.d. values that match those of rhodopsin-bound active-state simulations. r.m.s.d. is computed on arrestin C-domain β-strands after alignment on the N domain. b, Mean r.m.s.d. from active and inactive structures across all six independent simulations for each condition, calculated after removing the first 500 ns of each simulation. c, We used PCA to compare the conformational states visited under the various arrestin-1 simulation conditions (see Methods; n = 8100 simulation frames as input). Each principal component corresponds to a mode of motion or variance in Cartesian coordinate space. The star on the left in each plot corresponds to the position of the active-state crystal structure, and the star on the right corresponds to the inactive-state structure. Simulations of the two crystallographic conditions separate clearly along the first principal component (PC1) and along the third principal component (PC3) but not along the second principal component (PC2). Simulations starting from the inactive state or active state with the arrestin C tail removed and no receptor present explore similar ranges of PC1 and PC2 coefficients and have some overlap in the range of PC3 coefficients. Simulations with either the receptor core or RP tail bound closely overlap with simulations performed in the presence of the full-length receptor. The x-axis is shifted to the right in the first plot in each row relative to the second and third plots in order to show the full range of values of PC1 coefficients. d, Images that show the motion of arrestin-1 along each principal component. e, Variance explained by each principal component. The cumulative distribution function (CDF) shows the variance explained by all principal components up to and including a given one.
Extended Data Fig. 3|. Conformation of arrestin favoured by binding of arrestin core.
a, b, In simulations started from an inactive conformation of arrestin bound to the receptor core alone (a, see Methods), arrestin preferred to adopt active interdomain twist angles (cyan histogram) (b). By contrast, simulations of arrestin initiated from the same conformation without the receptor (grey histogram) were less likely to spontaneously adopt interdomain twist angles matching those seen in the active-state structure. c, Traces for all simulations, 20 per condition. The difference between the grey and cyan histograms increases with simulation time and would be likely to increase further with additional simulation time, but the differences in the mean interdomain twist angle achieved between the two conditions are already highly significant (P = 3 × 10⁻⁵).
Extended Data Fig. 4|. Simulation traces from targeted and restrained molecular dynamics simulations.
a, We started simulations of arrestin-1 from the inactive state and pulled the finger loop towards its active, helical conformation (grey trace). The finger loop quickly reached its active state (top), but this failed to induce active interdomain twist angles (bottom) on timescales of hundreds of nanoseconds. b, Similarly, in simulations of arrestin-1 started from the active state (without a receptor present), restraining the finger loop conformation to its active conformation did not prevent arrestin-1 from visiting inactive interdomain twist angles. c, d, By contrast, pulling the gate loop to its active state to mimic RP-tail binding (c), or pulling the IL2-binding crevice apart to mimic receptor core binding (d), consistently induced active interdomain twist angles in arrestin (P = 4 × 10⁻⁶, P = 0.002, respectively, compared to unbiased simulations). All traces are smoothed using an averaging window of 20 ns. In all cases we attempted to apply external forces to mimic binding of various structural elements of the receptor. To mimic the effect of binding at the receptor core interface, we aligned and pulled on the same residues within the C loop and middle loop contacted by the receptor. The broad range of interdomain twist angles may reflect the fact that the restraints do not perfectly mimic the effect of the receptor core. Nonetheless, other simulations, including unbiased simulations starting from the inactive state, suggest that separation of the interdomain crevice or the presence of the receptor core favour active interdomain twist angles (Extended Data Fig. 6), providing independent support for the proposed effect of core binding on arrestin activation. Six independent simulations were performed for each condition.
Extended Data Fig. 5|. Gate loop motion may be restrained in the inactive state by an ionic interaction with the finger loop.

In certain inactive-state crystal structures of arrestin-1 (for example, PDB entry 1CF1, chain D) and arrestin-2 (for example, PDB entry 1G4M, chain A), a lysine in the gate loop (K298 in arrestin-1, K292 or K294 in arrestin-2) forms an ionic interaction with a carboxylic acid in the finger loop (D71 in arrestin-1, E66 in arrestin-2). Simulations initiated from these structures with the C tail removed exhibited less frequent transitions of the gate loop to fully active conformations than simulations initiated from crystal structures in which this ionic interaction between the gate loop and the figure loop was not formed (for example, PDB entry 1CF1, chain A). Thus a particular finger loop conformation might mildly increase the stability of the inactive-state gate loop conformation. In simulations, we observed additional sets of ionic interactions between gate loop lysines and either D67 on the finger loop or D135 on the middle loop (according to arrestin-2 numbering), which also appeared to prevent motion of the gate loop towards the active state. Certain finger loop conformations might also favour the inactive state through interactions with the C tail of arrestin64.
Extended Data Fig. 6|. Conformational changes at IL2 and IL3 interfaces correlate with interdomain twist angle.

a, The C loop contains residues S251 and D253, which interact with Y67 in the N domain in the inactive state of arrestin (cyan, left). In the rhodopsin-bound crystal structure, this network of residues separates when IL2 binds in the central crevice between the N and C domains (purple, right). b, c, We measured separation between the Y67–S251 side-chain hydroxyl oxygens (b) and between the C143–D253 Cα atoms (c). Conformational changes at the IL2 interface correlate with interdomain twist angles. This is particularly noticeable in simulations starting from the inactive state but with the arrestin C tail removed (green), where increased interdomain twist angles correlated with disruption of the Y67–S251 interaction (R2 = 0.35) and with increased separation distance between the two domains, as measured through the C143–D253 Cα distance (R2 = 0.36) (six independent simulations). Plots and correlations refer to trajectories downsampled every 10 ns, with no frames removed at the beginning of simulation. One caveat is that in simulations started from active state without the arrestin C tail, the interdomain crevice frequently collapsed at the beginning of simulation, so that even when arrestin visited more active interdomain twist angles, the crevice did not re-open. It is possible that these simulations reached a local energy minimum not typically visited in the equivalent simulations started from the inactive conformation. d, Conformational changes at the IL3 interface correlate with interdomain twist angles. Compared to the inactive state (blue) of arrestin, in the active state (purple), the back loop, located in the arrestin C domain (residues 311–320), extends away from the arrestin body (motion indicated by the black arrow). In this conformation, the back loop contacts the third intracellular loop in rhodopsin via an ionic interaction between R318 (arrestin) and E239 (rhodopsin). e, The position of the back loop correlates with the interdomain twist angle for simulations of arrestin with its C tail removed, starting from either the inactive (green) or active (purple) state (R2 = 0.50 and R2 = 0.58, respectively; six independent simulations). Back loop position is measured by projecting the coordinates of the back loop onto the vector connecting the crystallographic inactive- and active- gate back structures (see Methods). f Similarly, in simulations of arrestin bound to the receptor core only, movement away from active interdomain twist angles weakly correlated with disruption of the R318–E239 interaction (R2 = −0.14; six independent simulations). Our simulations therefore indicate that interaction between arrestin and receptor at IL3 may control the interdomain twist angle. We speculate that this occurs because the back loop is coupled to the C loop via a set of β-strands. Thus, the receptor is likely to also modulate interdomain twisting by extending the shape of the back loop. When the back loop moves towards its active conformation, its motion appears to couple to the C domain through β-sheet formation with the C loop. Indeed, previous studies have indicated that acidic residues on IL3 might facilitate arrestin engagement. For example, an acidic residue on IL3 of the human luteinizing hormone receptor is critical for binding to arrestin-2 and arrestin-3, albeit to different extents for each65. Our simulations support the idea that binding via the IL3 interface could help to trigger arrestin activation. Arrestins 1 to 4 share a conserved basic residue at position 313 (bovine arrestin-1 numbering). A qualitative examination of GPCR sequences reveals that several receptors, including the M2 muscarinic receptor, melatonin receptors, β2AR, A2AR, NTS1R, apelin receptor and H1R, all contain acidic residues at the 5×73–5×75 positions (GPCRdb numbering66), which extend into ICL3 and may facilitate arrestin activation in the absence of RP-tail phosphorylation.
Extended Data Fig. 7|. Gate loop conformation and behaviour of the R175–D296 polar core interaction across arrestin-1 conditions.

a, Gate loop conformation (grey) is measured by projecting the coordinates of the gate loop onto the vector connecting the crystallographic inactive and active gate loop structures (see Methods). In simulations where arrestin-1 maintains a stable active interdomain twist, such as in simulations performed in the presence of the RP tail (right column), the R175–D296 interaction occasionally reforms transiently (blue traces), although the separation of the R175–D296 Cα atoms (red traces) continues to resemble the distance seen in active-state crystal structures. The CHARMM36 force field used here might slightly overstabilize this ionic interaction, increasing the propensity for R175–D296 to reform in these simulations67. b, Conformations of the polar core and gate loop are tightly coupled. Crystal structures of arrestin-1 bound to its C tail (PDB entry 1CF1) and of arrestin-1 bound to the RP tail (PDB entry 5W0P) reveal distinct arrangements of the residues in the polar core (D30, R175, D296, D303 and R382) and a surrounding polar network. As described in the main text, the position of D296 is tightly coupled to interdomain twist. In the active state (right), binding of the RP tail has two effects: first, a phosphorylated serine, S338, engages the gate loop through a direct interaction with K300. In doing so, D296 shifts away from its inactive-state position towards the C domain. In doing so, the interaction between D296 and R175 breaks, disturbing the ionic network of the polar core. Second, S338 also engages R29, which stabilizes the rearrangement of residues in and around the polar core. D30 now engages R175 through an ionic interaction, and D296 is free to interact with other residues, including S308. c, Our simulations reveal how the position of D296 is coupled to interdomain twisting. After the gate loop undergoes a conformational change from its inactive conformation to an active conformation in simulations started from the inactive state with arrestin C tail removed, D296 can shift between its inactive and active positions. In snapshots such as the one shown (simulation 8, right), shifting of D296 towards its active position moves a small β-strand (G292–D296), which is connected to a large β-strand (N271–L280) in the C domain. These observations explain the fact that the R175E and D296R mutations—which would force D296 towards its active position by ionic repulsion—cause phosphorylation-independent arrestin activity, whereas the combination of the two mutations, which would maintain the polar core salt bridge between positions 175 and 296, does not5,68.
Extended Data Fig. 8|. Centrifugal pull-down analysis of fluorescently labelled arrestin mutants.

a, Arrestin mutants were mixed with rod outer segment membranes containing rhodopsin (Rho), phosphorylated rhodopsin (RhoP), opsin (Ops) or phosphorylated opsin (OpsP). Rhodopsin samples were illuminated (>495 nm, 15 s) to obtain activated rhodopsin (Rho*) and phosphorylated activated rhodopsin (Rho*P), and then all samples were centrifuged at 20,800g for 10 min. The supernatant was removed, and the pellets were solubilized in loading buffer. Samples were subjected to SDS–PAGE, and gels were stained with Coomassie blue. MW, molecular weight marker kDa. Arrestin migrates slower than rhodopsin or opsin (arrestin (A) and receptor (R) bands are indicated by arrows). As controls, samples of arrestin in buffer alone (NS, nonspecific pull-down in isotonic or low salt buffer) or rhodopsin alone (bkd, background) were centrifuged alongside the other samples. The total amount of arrestin present in each assay (2.25 μg) is indicated in the lanes marked ‘Arr’. Arrestin ‘cysless’ corresponds to the background construct for all fluorescently labelled arrestin mutants (C63A, C128S, C143A, W194F) and is functionally equivalent to native wild-type bovine arrestin-161. Representative gels, cropped to show desired lanes, are shown. Experimental conditions: 1 μM arrestin, 10 μM receptor, 50 μl sample volume; 50 mM HEPES, 130 mM NaCl pH 7 (isotonic buffer) for samples containing rhodopsin, 50 mM HEPES pH 8.5 (low-salt buffer) for samples containing opsin, 20 °C. b, Arrestin bands were quantified by densitometry using the program GelQuant.NET v.1.8.2. Each band is expressed as the fraction of total arrestin that was present in each experiment, and bars represent averages from n = 2 (arr cysless), n = 5 (Rho* and Rho*P, L173F), and n = 4 (all other conditions) independent experiments ± s.e.m. Essentially no background density from ROS was present at the molecular-weight range of arrestin. All mutants showed some amount of nonspecific pull-down in the different buffer conditions. Note that this nonspecific pull-down is subtracted from the pull-down data reported in the main text. The fluorescent NBD-labelled arrestin mutants bound to the different receptor variants at similar levels as the cysless arrestin control (Ops < Rho* < OpsP < Rho*P).
Extended Data Fig. 9|. Arrestin-2 undergoes similar fluctuations in simulation as arrestin-1, suggesting a potential common activation mechanism.
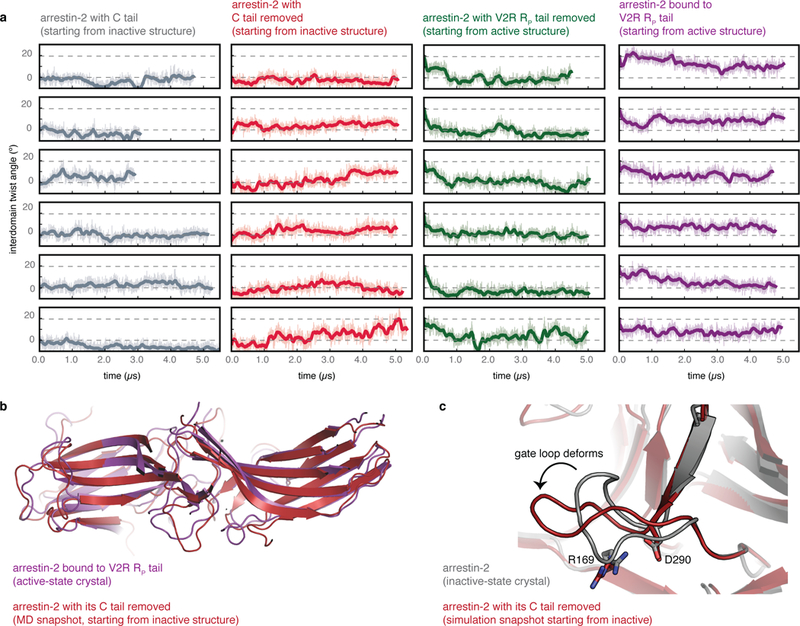
Simulations initiated from the inactive conformation but with the arrestin C tail removed reached active conformations, and simulations initiated from the active conformation but with the co-crystallized RP tail removed reached inactive conformations. a, Interdomain twist angle as a function of time for simulations of arrestin-2 performed under four conditions: active arrestin-2 bound to the V2 vasopressin receptor C-terminal phosphopeptide (PDB entry 4JQI) with the crystallographic Fab30 fragment removed; active arrestin-2 with the V2R RP tail removed; and inactive arrestin-2 with its crystallographic C tail present or absent (PDB entry 1G4M). In these simulations, arrestin-2 appears to favour more inactive-like conformations than those seen in the majority of our arrestin-1 simulations, but this may be due to the specific choice of crystal structure from which the simulations were initiated; see Extended Data Fig. 7. Dashed lines represent the inactive and active state interdomain twist angles for the arrestin-2 crystal structures. b, Snapshot of an active-like rotational state observed in simulations started from an inactive-state structure with the C tail removed (simulation 63, dark red), overlaid on the active-state structure (purple). c, Simulation snapshot from a simulation started from the inactive state with the C tail removed, in which the gate loop moves into an intermediate state (simulation 62, dark red), as seen in simulations of arrestin-1 started from the inactive state with the C tail removed. The absence of a structure of a receptor-bound β-arrestin leaves open the possibility that receptors might bind β-arrestins differently from arrestin-1, and even if the binding mode is similar, the activation mechanism might be different.
Extended Data Table 1|. A non-exhaustive list of experimental studies supporting the hypothesis that arrestin activation depends on receptor engagement of the RP tail and/or receptor core binding interfaces.
Note that the studies supporting a role for the core in arrestin activation do not preclude a role for the RP tail, and those supporting a role for the RP tail in arrestin activation do not preclude a role for the core. Furthermore, not all studies directly distinguish between interactions that favour binding (that is, increase receptor–arrestin affinity) and those that favour arrestin activation (that is, conformational change in arrestin).
| Key literature | Observation | Our structural interpretation | Evidence for role of RP tail, core or both in binding and/or activation |
|---|---|---|---|
| Bouvier et al., Nature 198869 | Removal of phosphorylable residues on 2AR C terminus delayed, but did not ablate, receptor desensitization | Arrestin-2/3 still can bind receptor and block G protein coupling, even if RP tail lacks phosphorylation. | Both (binding) |
| Ohguro et al., Prot. Sci. 199470 | Sites that experienced a change in solvent exposure upon rhodopsin binding included residues at the core and tail interfaces and near membrane anchor | Receptor binds to regions at both the tail and core interfaces | Both (binding) |
| Gurevich and Benovic, Mol. Pharmacol. 199771 | R175E (arrestin-1) mutant exhibited increased affinity for non-phosphorylated rhodopsin over WT arrestin | Mutations at the RP tail interface favor conformational changes that increase binding at the core interface (allostery) | Both (binding) |
| Vishnivetskiy et al., JBC 200072 | Mutation of hydrophobic residues in the arrestin Nterminus, which binds the arrestin C tail, increased binding to Rho* | Displacing the arrestin C tail (bound at the RP tail interface) favors conformational changes that increase binding at core interface | Both (binding) |
| Richardson et al., J. Neurochem. 200373 | Substance P receptor (SPR) with truncated RP tail experienced desensitization and internalization to similar extents as wild type SPR and retained some affinity for arrestin-3 | Receptor without RP tail can still bind arrestin and induce arrestin-mediated processes | Core (activation) |
| Jala et al., JBC 200523 | When phosphorylable residues of leukotriene B4 receptor were eliminated, the receptor still engaged arrestin 2 or 3, enabling arrestin localization to membranes and receptor internalization. These phosphorylation-deficient receptors failed to undergo endosomal localization | While the RP tail appears to favor arrestin interactions with the receptor that promote endocytosis, absence of RP tail does not prevent receptor-dependent arrestin localization to membrane. RP tail binding may increase lifetime of arrestin-receptor complex, enabling endocytosis. | Both (activation) |
| Hanson et al., JBC 200674 | Mutations at the interdomain interface increased binding to both Rho* and inactive RhoP; mutating basic residues in the N domain impaired binding to RhoP more than it impaired binding to Rho*P | Breaking contacts at the interdomain crevice, near the core binding interface, increased binding at the RP tail interface, suggesting that changes at the core interface favor changes at the tail interface | Both (binding) |
| Shukla et al., PNAS 200875 | AT1aR with truncated RP tail induced conformational changes in arrestin-3, as measured with BRET, similar to those induced by full-length AT1aR. | BRET assays likely report on displacement of arrestin’s own C tail. Thus, receptor core alone appears capable of favoring C tail displacement | Core (activation) |
| Gimenez et al., JBC 201276 | Phosphorylation-deficient M2R bound arrestin-2/3, while phosphorylation-deficient 2AR experienced reduced binding, as measured with BRET | Core binding appears to play a role in M2R-mediated arrestin activation, while 2AR appears to depend more upon RP tail–mediated activation | Both–dependent on receptor type (binding) |
| Vishnivetskiy et al., JBC 201377 | Mutation of residues in the arrestin-1 middle loop (Q133–S142) increased arrestin-1 binding to OpsP as well as to Rho* | Breaking interdomain contacts (through mutation) near the core interface increases binding at the RP tail interface | RP tail (binding) |
| Yang et al., Nat. Comm. 201524 | Binding of V2R- and 2AR-derived phosphopeptides induced conformational changes in arrestin detected by 19 F-NMR | RP tails with distinct phosphorylation patterns can induce different arrestin conformations and favor distinct downstream effects associated with arrestin activation | RP tail (binding and activation) |
| Kumari et al., Nat. Comms. 201610 | An RP tail–engaged form of -arrestin 1 experienced endocytosis and mediated ERK signaling | Binding to a highly phosphorylated RP tail stimulates arrestin activation | RP tail (activation) |
| Thomsen et al., Cell 201612 | EM images of a GPCR supercomplex revealed that arrestin and G protein can simultaneously bind a single GPCR in vitro; also, arrestin-3 and Gs colocalized with GPCRs in endosomes | Since the G protein engages the receptor core, arrestin likely simultaneously engages the GPCR by binding at the RP tail interface | RP tail (binding) |
| Lee et al., Nature 201625 | Swapping RP tails of certain receptors altered intracellular arrestin-3 BRET signals and resulted in different cellular trafficking | Binding of RP tails with different extents of phosphorylation may favor distinct cellular outcomes by altering the lifetime and conformational signature of arrestin | RP tail (activation and binding) |
| Cahill et al., PNAS 201713 | Mutation of the finger loop, a core-binding element in arrestin, in a chimeric 2V2R did not prevent receptor internalization or signaling | Ablating binding via the core interaction does not prevent arrestin-related processes (internalization, eg.), implying a role for RP tail in promoting arrestinmediated signaling | RP tail (activation and binding) |
| Kumari et al., Mol. Biol. Cell. 201711 | A V2R mutant lacking ICL3 could still engage clathrin and other components of the ERK signaling module | Ablating another portion of the core interface did not prevent arrestin activation, implying a role for RP tail | RP tail (activation and binding) |
| Jung et al., PNAS 201722 | Phosphorylation independent, transient binding between M1R and arrestin-3; arrestin-3 conformation detected by FRET | Weaker of two binding modes is phosphorylation independent; the more stable mode may involve IL3 phosphorylation at S228, leading to further engagement at the core interface | Core (activation and binding) |
| Eichel et al., Nature 201825 | Agonist-stimulated receptors with C-terminal truncations still experienced arrestin-mediated membrane localization and receptor internalization | Receptor core alone can trigger certain changes in arrestin, but RP tail required for receptor endocytosis | Both (activation) |
Supplementary Material
Acknowledgements
We thank P. Eastman, M. Sultan, R. Betz and C. Brinton for assistance with simulation setup and analysis, and K. Eichel, M. Masureel, A. Venkatakrishnan, B. Kobilka and M. von Zastrow for valuable discussions. This work was supported by National Institutes of Health (NIH) grant R01GM127359 to R.O.D., the Deutsche Forschungsgemeinschaft (SO1037/1–2 to M.E.S.), the Berlin Institute of Health (Delbrück Fellowship BIH_PRO_314 to M.E.S.), an NIH postdoctoral fellowship to S.A.H. (T15-LM007033–33), a Stanford Terman Faculty Fellowship to R.O.D., and NSF Graduate Research Fellowships to N.R.L. and R.J.L.T. Several preliminary simulations were performed on an Anton machine at the Pittsburgh Supercomputing Center, donated by D.E. Shaw Research and supported by NIH grant R01GM116961.
Footnotes
Additional information
Extended data is available for this paper at
Supplementary information is available for this paper at
Data and code availability
All simulation trajectories (Supplementary Table 1) and analysis code are available upon reasonable request to the authors, and summary statistics for all simulations are reported throughout this Letter and in its Extended Data figures.
Competing interests: The authors declare no competing interests.
References
- 1.Violin JD, Crombie AL, Soergel DG & Lark MW Biased ligands at G-protein-coupled receptors: promise and progress. Trends Pharmacol. Sci. 35, 308–316 (2014). [DOI] [PubMed] [Google Scholar]
- 2.DeWire SM & Violin JD Biased ligands for better cardiovascular drugs: dissecting G-protein-coupled receptor pharmacology. Circ. Res. 109, 205–216 (2011). [DOI] [PubMed] [Google Scholar]
- 3.Palczewski K, Buczyłko J, Imami NR, McDowell JH & Hargrave PA Role of the carboxyl-terminal region of arrestin in binding to phosphorylated rhodopsin. J. Biol. Chem. 266, 15334–15339 (1991). [PubMed] [Google Scholar]
- 4.Gurevich VV & Benovic JL Visual arrestin interaction with rhodopsin. Sequential multisite binding ensures strict selectivity toward light-activated phosphorylated rhodopsin. J. Biol. Chem. 268, 11628–11638 (1993). [PubMed] [Google Scholar]
- 5.Gurevich VV & Gurevich EV The structural basis of arrestin-mediated regulation of G-protein-coupled receptors. Pharmacol. Ther. 110, 465–502 (2006). [DOI] [PMC free article] [PubMed] [Google Scholar]
- 6.Kang Y et al. Crystal structure of rhodopsin bound to arrestin by femtosecond X-ray laser. Nature 523, 561–567 (2015). [DOI] [PMC free article] [PubMed] [Google Scholar]
- 7.Zhou XE et al. Identification of phosphorylation codes for arrestin recruitment by G protein-coupled receptors. Cell 170, 457–469 (2017). [DOI] [PMC free article] [PubMed] [Google Scholar]
- 8.Nobles KN, Guan Z, Xiao K, Oas TG & Lefkowitz RJ The active conformation of beta-arrestin1: direct evidence for the phosphate sensor in the N-domain and conformational differences in the active states of beta-arrestins1 and −2. J. Biol. Chem. 282, 21370–21381 (2007). [DOI] [PubMed] [Google Scholar]
- 9.Shukla AK et al. Structure of active -arrestin-1 bound to a G-protein-coupled receptor phosphopeptide. Nature 497, 137–141 (2013). [DOI] [PMC free article] [PubMed] [Google Scholar]
- 10.Kumari P et al. Functional competence of a partially engaged GPCR--arrestin complex. Nat. Commun. 7, 13416 (2016). [DOI] [PMC free article] [PubMed] [Google Scholar]
- 11.Kumari P et al. Core engagement with -arrestin is dispensable for agonist-induced vasopressin receptor endocytosis and ERK activation. Mol. Biol. Cell 28, 1003–1010 (2017). [DOI] [PMC free article] [PubMed] [Google Scholar]
- 12.Thomsen ARB et al. GPCR–G protein–-arrestin super-complex mediates sustained G protein signaling. Cell 166, 907–919 (2016). [DOI] [PMC free article] [PubMed] [Google Scholar]
- 13.Cahill TJ III et al. Distinct conformations of GPCR–-arrestin complexes mediate desensitization, signaling, and endocytosis. Proc. Natl Acad. Sci. USA 114, 2562–2567 (2017). [DOI] [PMC free article] [PubMed] [Google Scholar]
- 14.Chen Q et al. Structural basis of arrestin-3 activation and signaling. Nat. Commun. 8, 1427 (2017). [DOI] [PMC free article] [PubMed] [Google Scholar]
- 15.Granzin J et al. Crystal structure of p44, a constitutively active splice variant of visual arrestin. J. Mol. Biol. 416, 611–618 (2012). [DOI] [PubMed] [Google Scholar]
- 16.Kim YJ et al. Crystal structure of pre-activated arrestin p44. Nature 497, 142–146 (2013). [DOI] [PubMed] [Google Scholar]
- 17.Sommer ME, Farrens DL, McDowell JH, Weber LA & Smith WC Dynamics of arrestin-rhodopsin interactions: loop movement is involved in arrestin activation and receptor binding. J. Biol. Chem. 282, 25560–25568 (2007). [DOI] [PubMed] [Google Scholar]
- 18.Tobin AB G-protein-coupled receptor phosphorylation: where, when and by whom. Br. J. Pharmacol. 153 (Suppl. 1), S167–S176 (2008). [DOI] [PMC free article] [PubMed] [Google Scholar]
- 19.Hirsch JA, Schubert C, Gurevich VV & Sigler PB The 2.8 Å crystal structure of visual arrestin: a model for arrestin’s regulation. Cell 97, 257–269 (1999). [DOI] [PubMed] [Google Scholar]
- 20.Sommer ME, Smith WC & Farrens DL Dynamics of arrestin–rhodopsin interactions: arrestin and retinal release are directly linked events. J. Biol. Chem. 280, 6861–6871 (2005). [DOI] [PubMed] [Google Scholar]
- 21.Sensoy O, Moreira IS & Morra G Understanding the differential selectivity of arrestins toward the phosphorylation state of the receptor. ACS Chem. Neurosci. 7, 1212–1224 (2016). [DOI] [PubMed] [Google Scholar]
- 22.Jung SR, Kushmerick C, Seo JB, Koh DS & Hille B Muscarinic receptor regulates extracellular signal regulated kinase by two modes of arrestin binding. Proc. Natl Acad. Sci. USA 114, E5579–E5588 (2017). [DOI] [PMC free article] [PubMed] [Google Scholar]
- 23.Jala VR, Shao WH & Haribabu B Phosphorylation-independent -arrestin translocation and internalization of leukotriene B4 receptors. J. Biol. Chem. 280, 4880–4887 (2005). [DOI] [PubMed] [Google Scholar]
- 24.Yang F et al. Phospho-selective mechanisms of arrestin conformations and functions revealed by unnatural amino acid incorporation and (19)F-NMR. Nat. Commun. 6, 8202 (2015). [DOI] [PMC free article] [PubMed] [Google Scholar]
- 25.Eichel K et al. Catalytic activation of -arrestin by GPCRs. Nature (2018). [DOI] [PMC free article] [PubMed] [Google Scholar]
- 26.Lee MH et al. The conformational signature of -arrestin2 predicts its trafficking and signalling functions. Nature 531, 665–668 (2016). [DOI] [PMC free article] [PubMed] [Google Scholar]
- 27.Tohgo A et al. The stability of the G protein-coupled receptor-beta-arrestin interaction determines the mechanism and functional consequence of ERK activation. J. Biol. Chem. 278, 6258–6267 (2003). [DOI] [PubMed] [Google Scholar]
- 28.Eichel K, Jullié D & von Zastrow M -Arrestin drives MAP kinase signalling from clathrin-coated structures after GPCR dissociation. Nat. Cell Biol. 18, 303–310 (2016). [DOI] [PMC free article] [PubMed] [Google Scholar]
- 29.Nuber S et al. -Arrestin biosensors reveal a rapid, receptor-dependent activation/deactivation cycle. Nature 531, 661–664 (2016). [DOI] [PMC free article] [PubMed] [Google Scholar]
- 30.Goodman OB Jr et al. -arrestin acts as a clathrin adaptor in endocytosis of the 2-adrenergic receptor. Nature 383, 447–450 (1996). [DOI] [PubMed] [Google Scholar]
- 31.Laporte SA, Miller WE, Kim KM & Caron MG -Arrestin/AP-2 interaction in G protein-coupled receptor internalization: identification of a -arrestin binging site in 2-adaptin. J. Biol. Chem. 277, 9247–9254 (2002). [DOI] [PubMed] [Google Scholar]
- 32.Pulvermüller A et al. Functional differences in the interaction of arrestin and its splice variant, p44, with rhodopsin. Biochemistry 36, 9253–9260 (1997). [DOI] [PubMed] [Google Scholar]
- 33.Dror RO et al. Signal transduction. Structural basis for nucleotide exchange in heterotrimeric G proteins. Science 348, 1361–1365 (2015). [DOI] [PMC free article] [PubMed] [Google Scholar]
- 34.Kang DS, Tian X & Benovic JL -Arrestins and G protein-coupled receptor trafficking. Methods Enzymol. 521, 91–108 (2013). [DOI] [PubMed] [Google Scholar]
- 35.Han M, Gurevich VV, Vishnivetskiy SA, Sigler PB & Schubert C Crystal structure of -arrestin at 1.9 Å: possible mechanism of receptor binding and membrane translocation. Structure 9, 869–880 (2001). [DOI] [PubMed] [Google Scholar]
- 36.Mahalingam M, Martínez-Mayorga K, Brown MF & Vogel R Two protonation switches control rhodopsin activation in membranes. Proc. Natl Acad. Sci. USA 105, 17795–17800 (2008). [DOI] [PMC free article] [PubMed] [Google Scholar]
- 37.Betz RM Dabble. https://doi.org/10.5281/zenodo.836914 (2018).
- 38.MacKerell AD et al. All-atom empirical potential for molecular modeling and dynamics studies of proteins. J. Phys. Chem. B 102, 3586–3616 (1998). [DOI] [PubMed] [Google Scholar]
- 39.Best RB, Mittal J, Feig M & MacKerell AD Jr. Inclusion of many-body effects in the additive CHARMM protein CMAP potential results in enhanced cooperativity of-helix and -hairpin formation. Biophys. J. 103, 1045–1051 (2012). [DOI] [PMC free article] [PubMed] [Google Scholar]
- 40.Best RB et al. Optimization of the additive CHARMM all-atom protein force field targeting improved sampling of the backbone, and side-chain 1and 2 dihedral angles. J. Chem. Theory Comput. 8, 3257–3273 (2012). [DOI] [PMC free article] [PubMed] [Google Scholar]
- 41.Huang J & MacKerell AD Jr. CHARMM36 all-atom additive protein force field: validation based on comparison to NMR data. J. Comput. Chem. 34, 2135–2145 (2013). [DOI] [PMC free article] [PubMed] [Google Scholar]
- 42.Klauda JB et al. Update of the CHARMM all-atom additive force field for lipids: validation on six lipid types. J. Phys. Chem. B 114, 7830–7843 (2010). [DOI] [PMC free article] [PubMed] [Google Scholar]
- 43.Vanommeslaeghe K et al. CHARMM general force field: a force field for drug-like molecules compatible with the CHARMM all-atom additive biological force fields. J. Comput. Chem. 31, 671–690 (2010). [DOI] [PMC free article] [PubMed] [Google Scholar]
- 44.Vanommeslaeghe K, Raman EP & MacKerell AD Jr. Automation of the CHARMM General Force Field (CGenFF) II: assignment of bonded parameters and partial atomic charges. J. Chem. Inf. Model. 52, 3155–3168 (2012). [DOI] [PMC free article] [PubMed] [Google Scholar]
- 45.Vanommeslaeghe K & MacKerell AD Jr. Automation of the CHARMM General Force Field (CGenFF) I: bond perception and atom typing. J. Chem. Inf. Model. 52, 3144–3154 (2012). [DOI] [PMC free article] [PubMed] [Google Scholar]
- 46.Salomon-Ferrer R, Götz AW, Poole D, Le Grand S & Walker RC Routine microsecond molecular dynamics simulations with AMBER on GPUs. 2. Explicit solvent particle mesh Ewald. J. Chem. Theory Comput. 9, 3878–3888 (2013). [DOI] [PubMed] [Google Scholar]
- 47.Case DA et al. AMBER 2017 (University of California, San Francisco, 2017). [Google Scholar]
- 48.Hopkins CW, Le Grand S, Walker RC & Roitberg AE Long-time-step molecular dynamics through hydrogen mass repartitioning. J. Chem. Theory Comput. 11, 1864–1874 (2015). [DOI] [PubMed] [Google Scholar]
- 49.Shaw DE et al. Millisecond-scale molecular dynamics simulations on Anton. Proc. ACM/IEEE Conf. Supercomputing (SC09) (2009). [Google Scholar]
- 50.Eastman P et al. OpenMM 4: A reusable, extensible, hardware independent library for high performance molecular simulation. J. Chem. Theory Comput. 9, 461–469 (2013). [DOI] [PMC free article] [PubMed] [Google Scholar]
- 51.Eastman P & Pande VS Efficient nonbonded interactions for molecular dynamics on a graphics processing unit. J. Comput. Chem. 31, 1268–1272 (2010). 10.1002/jcc.21413 [DOI] [PMC free article] [PubMed] [Google Scholar]
- 52.Tribello GA, Bonomi M, Branduardi D, Camilloni C, Bussi G. PLUMED2: New feathers for an old bird. Comp. Phys. Comm. 186, 604–613 (2014). [Google Scholar]
- 53.Cheng X, Wang H, Grant B, Sine SM & McCammon JA Targeted molecular dynamics study of C-loop closure and channel gating in nicotinic receptors. PLOS Comput. Biol. 2, e134 (2006). [DOI] [PMC free article] [PubMed] [Google Scholar]
- 54.Roe DR & Cheatham TE III . PTRAJ and CPPTRAJ: software for processing and analysis of molecular dynamics trajectory data. J. Chem. Theory Comput. 9, 3084–3095 (2013). [DOI] [PubMed] [Google Scholar]
- 55.Humphrey W, Dalke A & Schulten K VMD: visual molecular dynamics. J. Mol. Graph. 14, 27–38 (1996). [DOI] [PubMed] [Google Scholar]
- 56.Sommer ME, Hofmann KP & Heck M Distinct loops in arrestin differentially regulate ligand binding within the GPCR opsin. Nat. Commun. 3, 995 (2012). [DOI] [PMC free article] [PubMed] [Google Scholar]
- 57.Garwin GG & Saari JC High-performance liquid chromatography analysis of visual cycle retinoids. Methods Enzymol. 316, 313–324 (2000). [DOI] [PubMed] [Google Scholar]
- 58.Schleicher A, Kühn H & Hofmann KP Kinetics, binding constant, and activation energy of the 48-kDa protein-rhodopsin complex by extra-metarhodopsin II. Biochemistry 28, 1770–1775 (1989). [DOI] [PubMed] [Google Scholar]
- 59.McDowell JH, Nawrocki JP & Hargrave PA Isolation of isoelectric species of phosphorylated rhodopsin. Methods Enzymol. 315, 70–76 (2000). [DOI] [PubMed] [Google Scholar]
- 60.Lally CC, Bauer B, Selent J & Sommer ME C-edge loops of arrestin function as a membrane anchor. Nat. Commun. 8, 14258 (2017). [DOI] [PMC free article] [PubMed] [Google Scholar]
- 61.Sommer ME, Hofmann KP & Heck M Arrestin-rhodopsin binding stoichiometry in isolated rod outer segment membranes depends on the percentage of activated receptors. J. Biol. Chem. 286, 7359–7369 (2011). [DOI] [PMC free article] [PubMed] [Google Scholar]
- 62.Vogel R & Siebert F Conformations of the active and inactive states of opsin. J. Biol. Chem. 276, 38487–38493 (2001). [DOI] [PubMed] [Google Scholar]
- 63.Mansoor SE, McHaourab HS & Farrens DL Mapping proximity within proteins using fluorescence spectroscopy. A study of T4 lysozyme showing that tryptophan residues quench bimane fluorescence. Biochemistry 41, 2475–2484 (2002). [DOI] [PubMed] [Google Scholar]
- 64.Hanson SM et al. A model for the solution structure of the rod arrestin tetramer. Structure 16, 924–934 (2008). [DOI] [PMC free article] [PubMed] [Google Scholar]
- 65.Mukherjee S et al. Aspartic acid 564 in the third cytoplasmic loop of the luteinizing hormone/choriogonadotropin receptor is crucial for phosphorylation-independent interaction with arrestin2. J. Biol. Chem. 277, 17916–17927 (2002). [DOI] [PubMed] [Google Scholar]
- 66.Isberg V et al. Generic GPCR residue numbers—aligning topology maps while minding the gaps. Trends Pharmacol. Sci. 36, 22–31 (2015). [DOI] [PMC free article] [PubMed] [Google Scholar]
- 67.Piana S, Lindorff-Larsen K & Shaw DE How robust are protein folding simulations with respect to force field parameterization? Biophys. J. 100, L47–L49 (2011). [DOI] [PMC free article] [PubMed] [Google Scholar]
- 68.Vishnivetskiy SA et al. How does arrestin respond to the phosphorylated state of rhodopsin? J. Biol. Chem. 274, 11451–11454 (1999). [DOI] [PubMed] [Google Scholar]
- 69.Bouvier M et al. Removal of phosphorylation sites from the 2-adrenergic receptor delays onset of agonist-promoted desensitization. Nature 333, 370–373 (1988). [DOI] [PubMed] [Google Scholar]
- 70.Ohguro H, Palczewski K, Walsh KA & Johnson RS Topographic study of arrestin using differential chemical modifications and hydrogen/deuterium exchange. Protein Sci. 3, 2428–2434 (1994). [DOI] [PMC free article] [PubMed] [Google Scholar]
- 71.Gurevich VV & Benovic JL Mechanism of phosphorylation-recognition by visual arrestin and the transition of arrestin into a high affinity binding state. Mol. Pharmacol. 51, 161–169 (1997). [DOI] [PubMed] [Google Scholar]
- 72.Vishnivetskiy SA et al. An additional phosphate-binding element in arrestin molecule. Implications for the mechanism of arrestin activation. J. Biol. Chem. 275, 41049–41057 (2000). [DOI] [PubMed] [Google Scholar]
- 73.Richardson MD et al. Human substance P receptor lacking the C-terminal domain remains competent to desensitize and internalize. J. Neurochem. 84, 854–863 (2003). [DOI] [PubMed] [Google Scholar]
- 74.Hanson SM & Gurevich VV The differential engagement of arrestin surface charges by the various functional forms of the receptor. J. Biol. Chem. 281, 3458–3462 (2006). [DOI] [PMC free article] [PubMed] [Google Scholar]
- 75.Shukla AK et al. Distinct conformational changes in -arrestin report biased agonism at seven-transmembrane receptors. Proc. Natl Acad. Sci. USA 105, 9988–9993 (2008). [DOI] [PMC free article] [PubMed] [Google Scholar]
- 76.Gimenez LE et al. Role of receptor-attached phosphates in binding of visual and non-visual arrestins to G protein-coupled receptors. J. Biol. Chem. 287, 9028–9040 (2012). [DOI] [PMC free article] [PubMed] [Google Scholar]
- 77.Vishnivetskiy SA, Baameur F, Findley KR & Gurevich VV Critical role of the central 139-loop in stability and binding selectivity of arrestin-1. J. Biol. Chem. 288, 11741–11750 (2013). [DOI] [PMC free article] [PubMed] [Google Scholar]
Associated Data
This section collects any data citations, data availability statements, or supplementary materials included in this article.