. 2018 Nov 30;7:e41301. doi: 10.7554/eLife.41301

Figure 3. Components of the medial, trans-Golgi and TGN transport machinery mainly localize to the periphery of the Golgi mini-stack.

(A–H) Medial and trans-Golgi proteins (0.25 ≤ LQ < 1.0), except Arf1, localize to the cisternal rim. En face and side view images are shown. Corresponding en face averaged images and radial mean intensity profiles are shown in (B, D, F and H). n, the number of averaged Golgi mini-stack images. (I–L) trans-Golgi and TGN proteins (LQ ≥1.0) appear compact or scattered at one end of the mini-stack. Arrows in (I) indicate colocalization between CLCB and Vamp4-GFP. Scale bar, 500 nm.

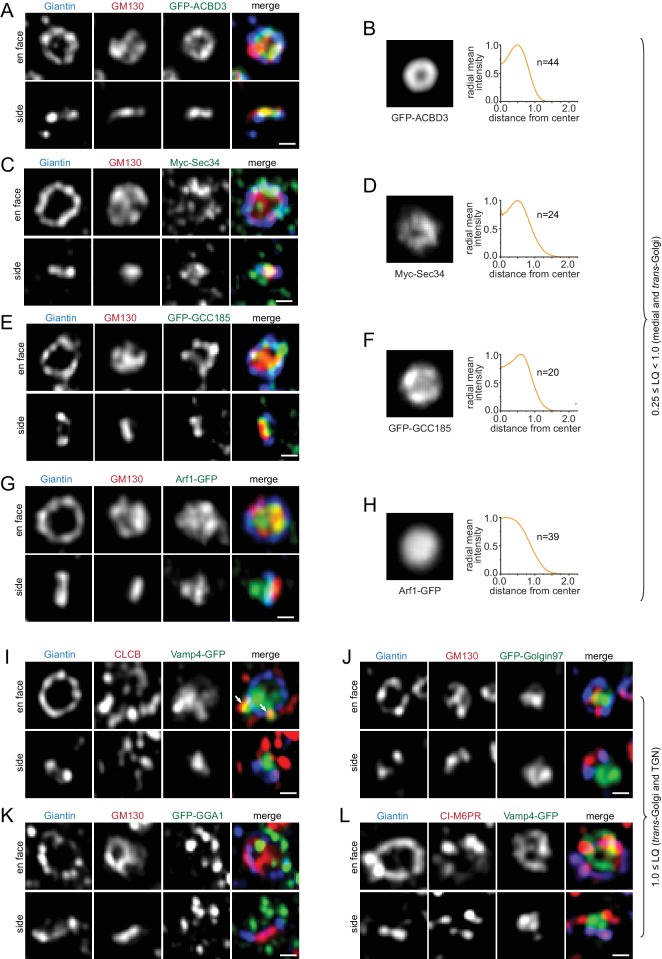
Figure 3.

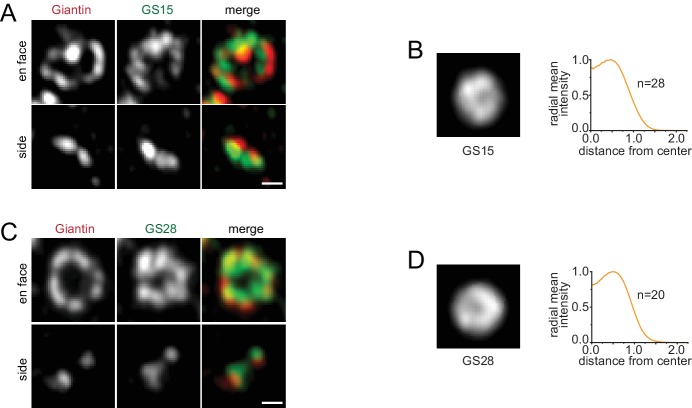
Figure 3—figure supplement 1. En face and side view images of the medial and trans-Golgi SNAREs, including GS15 and GS28, showed their rim localization (A and C).

Figure 3—figure supplement 1.

(B and D) Corresponding en face averaged images and radial mean intensity profiles. n, the number of averaged mini-stack images. Scale bar, 500 nm.
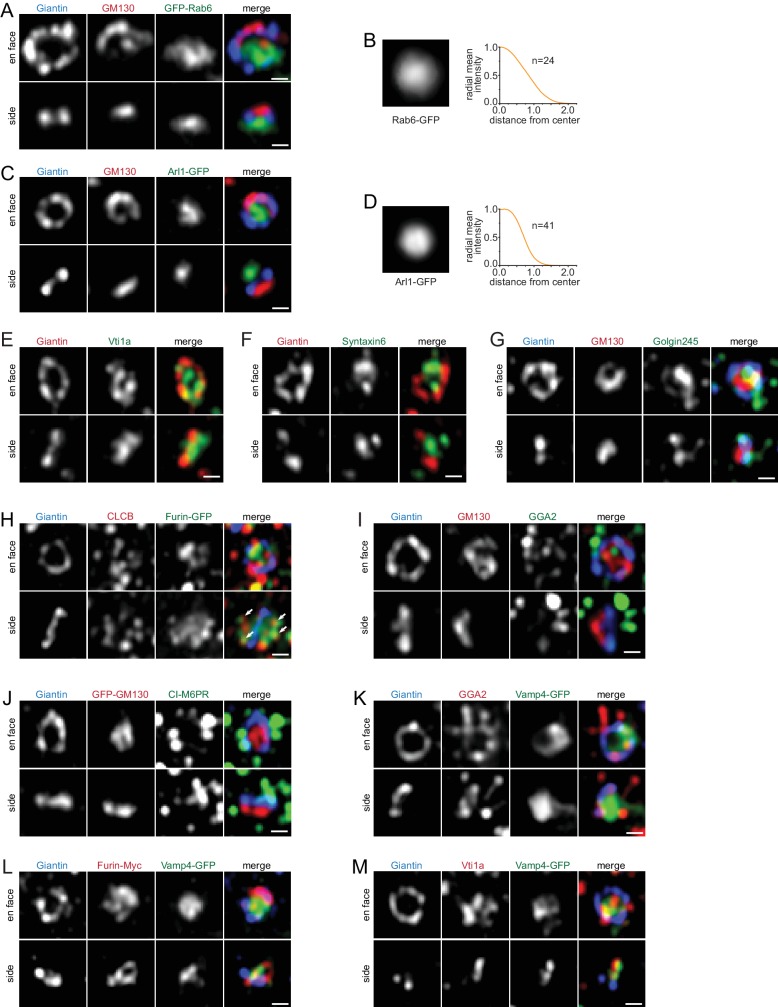
Figure 3—figure supplement 2. The lateral localization of components of the trans-Golgi and TGN transport machinery in the Golgi mini-stack.

Figure 3—figure supplement 2.

(A, C and E–M) En face and side view images of trans-Golgi and TGN transport machinery components (LQ ≥1.0). (B and D) En face averaged images and radial mean intensity profiles corresponding to (A) and (C). n, the number of averaged mini-stack images. Arrows in (H) indicate colocalization between CLCB and Furin-GFP. Scale bar, 500 nm.