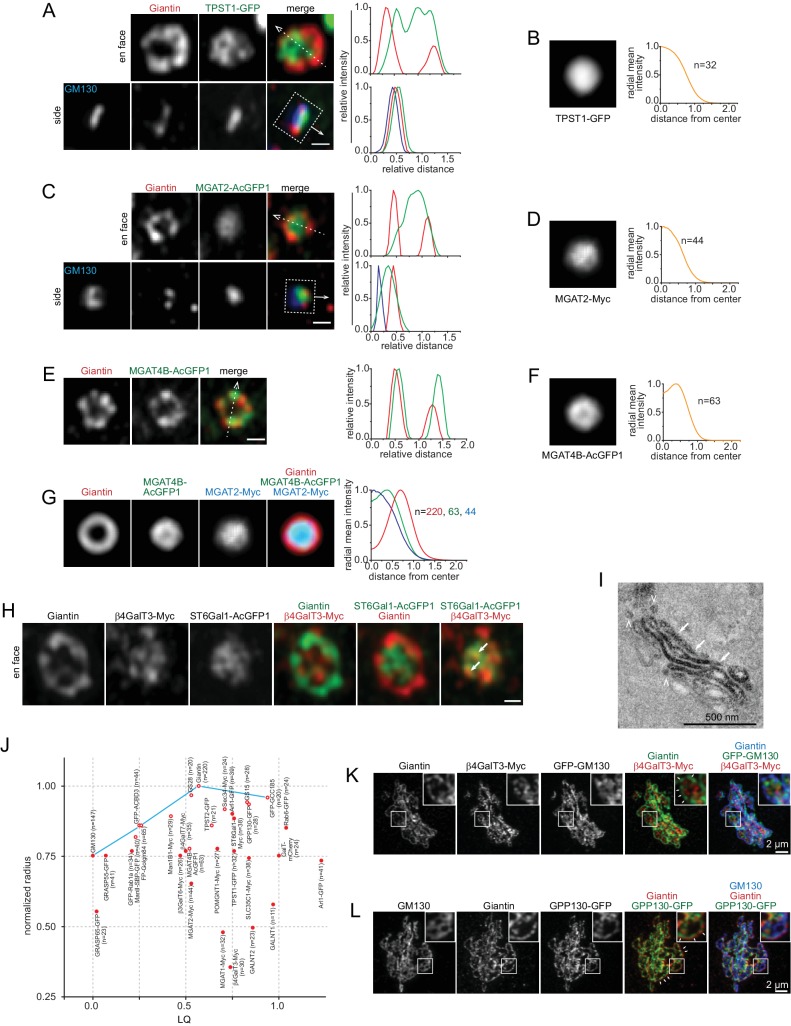
Figure 4. Golgi enzymes primarily localize to the interior of medial and trans-Golgi cisternae.
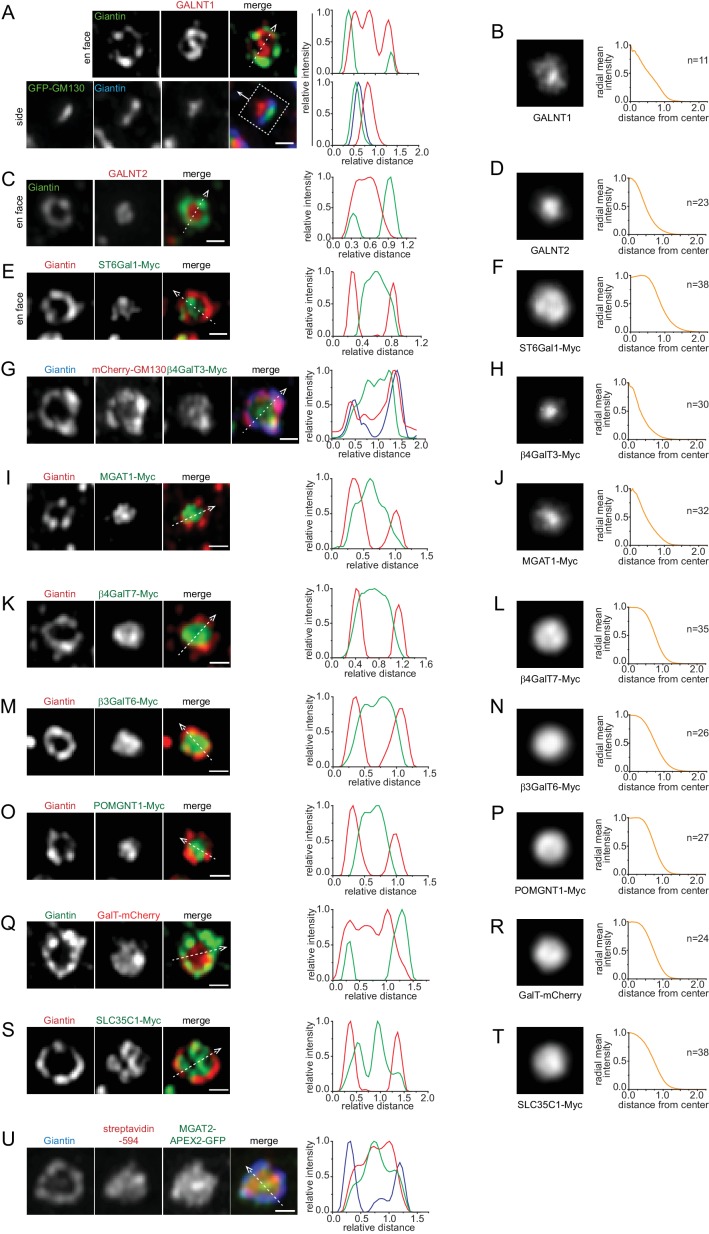
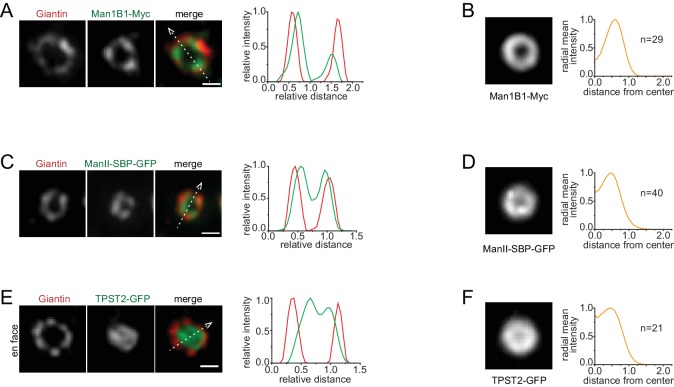
(A, C and E) En face view images of Golgi enzymes. Side view images are also shown in (A) and (C). Dotted arrows and boxes and line intensity profiles are used or acquired as in Figure 1K. (B, D and F) Corresponding en face averaged images and radial mean intensity profiles. n, the number of averaged Golgi mini-stack images. (G) The merge of en face averaged images of Giantin, MGAT4B and MGAT2 and the corresponding radial mean intensity profile. n, the number of averaged Golgi mini-stack images. (H) β4GalT3 and ST6Gal1 can localize to shared (arrows) and distinct domains within the cisternal interior. (I) MGAT2 localizes to the cisternal interior of the native Golgi by EM. NRK cells transiently expressing MGAT2-APEX2-GFP were subjected to APEX2-catalyzed reaction followed by EM. Note that cells were not subjected to nocodazole treatment. The thin section EM image displays the side view of a Golgi stack. MGAT2-APEX2 positive cisternal interior and budding profiles are indicated by arrows and arrow heads, respectively. (J) A quantitative molecular map of the Golgi mini-stack. The normalized radius of a Golgi protein is plotted against its corresponding LQ (Table 1). Red open and closed circle denote ring and disk lateral localization pattern, respectively. n, the number of Golgi mini-stacks used to calculate normalized radius. (K,L) Identifying the rim and interior of native Golgi cisternae. Cells were not treated with nocodazole. In (K), the cisternal rim (arrows) and interior are labeled by Giantin and β4GalT3, respectively. In (L), Giantin and GPP130 positive curvy lines (arrows) represent cisternal rim and do not correspond to side views or cross sections of Golgi stacks. The boxed region in each image is enlarged in the upper right corner. Scale bars represent 500 nm unless specified otherwise.


