Abstract
Asarum spp. are important medicinal plants that have the potential for use in treating various types of fevers. Aristolochic acid is one of the main toxic compounds present in these plants. To improve our understanding of the biosynthetic pathway of aristolochic acid, we sequenced the transcriptome of the root and leaf tissues of Asarum heterotropoides and performed de novo sequence assembly. The data were stitched together to produce 468,357 transcripts with an N50 of 611 bp. The data were annotated with various databases (RefSeq non-redundant proteins [Nr], Swiss-Prot, Kyoto Encyclopaedia of Genes and Genomes [KEGG], Clusters of Orthologous Groups/EuKaryotic Orthologous Groups [COG/KOG], and Gene Ontology [GO]) and were annotated. There were 205,165 transcripts (43.81%) of differentially expressed genes in the roots and leaves, which were shown to be involved in biosynthesis, transport, and catabolism, and 100 genes in defence mechanisms. Three candidate transcripts (TyrDC1, TyrDC2, and TyrDC3) were discovered in these differential genes. TyrDC may be a key enzyme in the biosynthesis pathway of aristolochic acid identified using quantitative reverse transcription-polymerase chain reaction (qRT-PCR) and high-performance liquid chromatography (HPLC). The transcriptome data and analysis presented here lay the foundation for further research into these important medicinal plants.
Introduction
Asarum heterotropoides Fr. Schmidt var. mandshuricum (Maxim.) Kitag. is a medicinal plant that dispels chills associated with exposure of the body to cold produced in vivo, and it has analgesic and antitussive effects. It is an important medicine for treating wind chill, headache, and cough. Liu et al.1 and Zeng et al.2 identified various components from the volatile oils of Asarum heterotropoides Fr. Schmidt var. mandshuricum (Maxim.) Kitag. and Asarum siedboldii Miq. var. seoulense Nakai., including methyleugenol, safrole, elemicin, and demethylcoclaurine. L-sesamin and aristolochic acids A, B, C, and D were identified in non-volatile oils3. The current edition of the Chinese Pharmacopoeia4 lists medicinal Asarum-based plant materials as the dried roots and rhizomes of A. heterotropoides Fr. Schmidt var. mandshuricum (Maxim.) Kitag., A. siedboldii Miq. var. seoulense Nakai., and A. siedboldii Miq. Asarum has a wide geographical distribution; A. heterotropoides Fr. Schmidt var. mandshuricum (Maxim.) Kitag., and A. siedboldii Miq. var. seoulense Nakai. grow as undergrowth or on mountainous wetland4. The main producing areas are Jilin, Liaoning, and Heilongjiang in China. A. siedboldii Miq. grows in damp places near creeks or rocky areas of Shanxi, Gansu, Zhejiang and other places in China5.
Many Chinese herbal medicine formulations containing aristolochic acid I are banned or restricted6–8. To effectively use A. heterotropoides and other aristolochic acid-containing medicinal herbs, various traditional Chinese medicine formulation have been studied, mostly with a focus on reducing their toxicity by preparing slices from the medicinal plant parts. Traditional breeding can also remove plant toxicity. The traditional Chinese medicine involves the use of concoctions (Paozhi) and solvents or diluents such as wine, vinegar, salt, and honey are used to treat slices of traditional Chinese medicine formulations. Only slices of traditional Chinese medicine preparations can be used to treat diseases. Traditional Chinese medicine methods such as concocting and cooking show reasonable compatibility and can remove aristolochic acid, but completely eliminating its toxicity is difficult. Genetically removing or reducing the aristolochic acid content in A. heterotropoides is the most effective method. Although this has not been previously performed, it is possible to elucidate the synthesis pathway of aristolochic acid in plants. Therefore, in this study, we identified genes with a strong correlation in the synthesis pathway of aristolochic acid using high-throughput sequencing and transcriptome data analysis. Reduction or blockade of the gene expression using gene silencing could reduce the toxicity of aristolochic acid-containing plants to facilitate their safe use and breeding of new plant varieties with high efficacy and low toxicity.
Among the plants of Aristolochiaceae, there are reports in the literature that Aristolochia L. plants Aristolochia fimbriata and Aristolochia tagala have available expressed sequence tags (ESTs) and transcriptome data, respectively9,10, while Saruma henryi Oliv. has transcriptome information11. The chloroplast genome of A. heterotropoides was sequenced in Asarum L. in 201712. Presently, there is no literature report of the sequencing of whole genomes or transcriptomes of A. heterotropoides. In this experiment, the roots and leaves of A. heterotropoides were collected on 3 September, 2016, and a cDNA library was established. Transcriptome data were obtained using high-throughput sequencing. An analysis of the transcriptome data determined that the tyrosine decarboxylase (TyrDC) family of enzymes is involved in the biosynthesis pathway of aristolochic acid in A. heterotropoides, and the full-length gene sequences of three enzymes were identified.
Results and Discussion
Illumina sequencing and read assembly
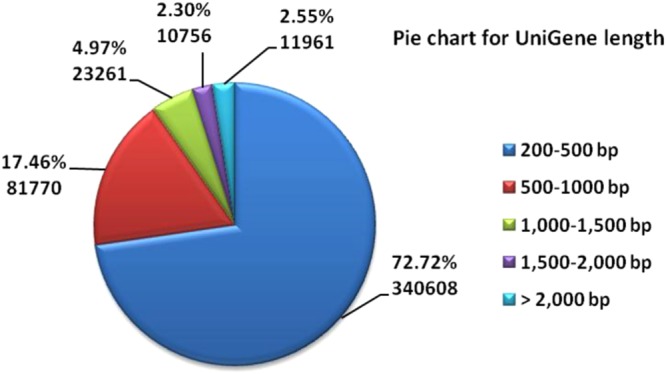
The transcriptome data for A. heterotropoides were obtained, and 268,492,920 raw readings were generated with a read length of 100 bp. After trimming to remove adaptors, primer sequences, polyA tails, and short and low-mass sequences, 265,808,030 (99.0%) high-quality reads were recovered (Table 1). Trinity assembly data were used to assemble sample data from the beginning, and the assembly result was passed through the sequence. Clustering was used for further sequence splicing and de-redundancy processing to obtain long non-redundant UniGene sequences. After data processing, 468,357 UniGene sequences were included, and the N50 was 611 bp. The UniGene sequence had a size range of 201–15,756 bp and an average size of 507.36 bp. In the 200–500, 500–1,000, 1,000–1,500, 1,500–2,000, and >2,000 bp size ranges there were 340,608 (72.72%), 81,770 (17.46%), 23,261 (4.97%), and 10,756 (2.30%), and 11,961 (2.55%), respectively, as shown in Fig. 1.
Table 1.
Sequencing raw Data and Filtered data quality statistics.
| Sample | length | Reads | Bases | Q20 (%) | Q30 (%) | GC (%) | N (ppm) |
|---|---|---|---|---|---|---|---|
| Sequencing raw Data quality statistics | |||||||
| Leaf-1 | 150 | 44162550 | 6624382500 | 95.45 | 89.71 | 43.44 | 630.62 |
| Leaf-2 | 150 | 43709506 | 6556425900 | 96.29 | 91.41 | 44.39 | 718.62 |
| Leaf-3 | 150 | 44445702 | 6666855300 | 95.69 | 90.29 | 43.25 | 637.75 |
| Root-1 | 150 | 50545156 | 7581773400 | 96.52 | 91.81 | 45.28 | 773.45 |
| Root-2 | 150 | 41393484 | 6209022600 | 96.24 | 91.24 | 45.28 | 768.23 |
| Root-3 | 150 | 44836522 | 6725478300 | 95.69 | 89.99 | 45.18 | 634.39 |
| Filtered data quality statistics | |||||||
| Leaf-1 | 147.35 | 43557996 | 6418359982 | 96.35 | 90.87 | 43.46 | 16.68 |
| Leaf-2 | 147.5 | 43192306 | 6370737693 | 97.06 | 92.38 | 44.42 | 12.15 |
| Leaf-3 | 147.11 | 43795384 | 6442723147 | 96.64 | 91.48 | 43.24 | 16.42 |
| Root-1 | 147.93 | 50018222 | 7398987367 | 97.18 | 92.63 | 45.31 | 8.03 |
| Root-2 | 147.94 | 40926052 | 6054787512 | 96.98 | 92.15 | 45.3 | 7.74 |
| Root-3 | 147.91 | 44318070 | 6555110250 | 96.43 | 90.94 | 45.2 | 16.11 |
Figure 1.
Overview of transcriptome assembly data showing the size distribution of transcripts.
Functional annotation
Functional annotation of assembled transcripts provides an insight into their molecular functions and biological processes in an organism. We compared the transcript data with the Gene Ontology (GO) database and used the Basic Local Alignment Search Tool (BLAST) to search data in several public databases.
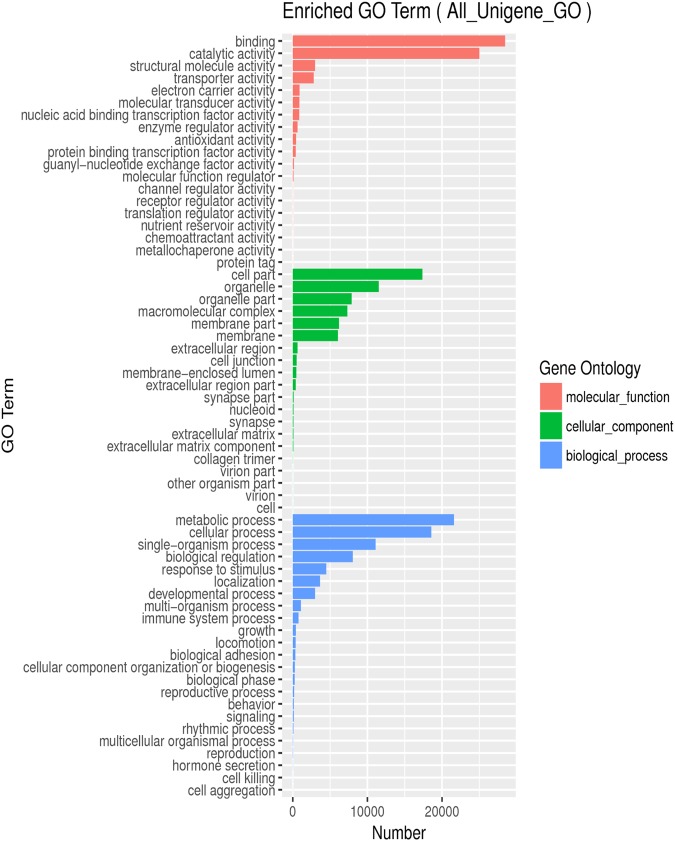
GO is a biological information network initiative with a three-tier system that defines and describes the function of genes and proteins as well as other gene products. The GO database consists of three major categories: molecular functions, cell components, and biological processes. Based on the differential transcript annotations to GO, we focused on the three categories that matched the molecular functional domain the most: “binding”, “catalytic activity”, and “structural molecule activity” (approximately 28,000, 25,000, and 2,600, respectively). The three most abundant categories under cellular components were “cell part”, “organelle”, and “organelle part” (approximately 17,000, 11,500, and 7,500, respectively). The three most common categories of biological processes were “metabolic process”, “cellular process”, and “single-organism process” (approximately 22,000, 18,500, and 11,000, respectively). After comparison and analysis, we mapped the GO functional classification annotation (Fig. 2).
Figure 2.
Gene numbers of frequencies and mean of transcripts matching GO terms.
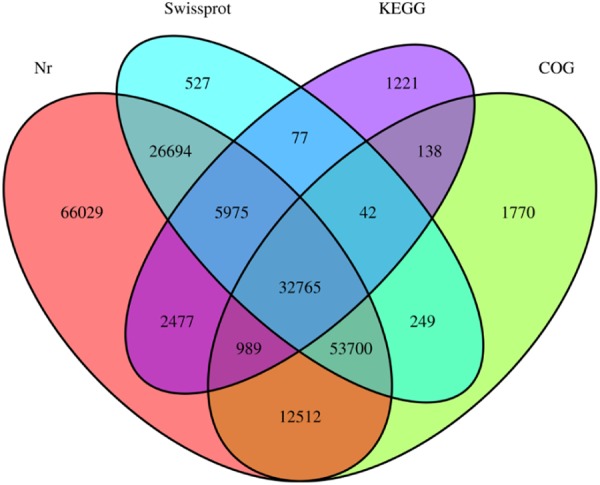
The transcriptome data of A. heterotropoides were tagged using the BLAST search data in the public database (Table 2) and Venn diagrams of the UniGene database annotation results were constructed (Fig. 3).
Table 2.
UniGene database commentary statistics.
| Total_UniGenes | Total_annotated_UniGenes | Nr | COG | Swissprot | KEGG |
|---|---|---|---|---|---|
| 468357 | 205165 | 201141 | 102165 | 120029 | 43684 |
Figure 3.
Venn diagram representing the number of DETs among A. heterotropoides.
Of the 468,357 transcripts, 205,165 (43.81%) UniGene sequences were annotated. They consisted of 201,141 (42.95%), 120,029 (25.63%), 102,165 (21.81%), and 43,684 (9.33%) in Nr, Swiss-Prot, COG, and Kyoto Encyclopedia of Genes and Genomes (KEGG) in the total UniGenes list, respectively. The remaining 56.19% of transcripts were not annotated, indicating that there was no significant protein match in the database. Furthermore, there were unreported or multifunctional proteins in the A. heterotropoides transcript or genes derived from conserved untranslated regions and long-chain non-coding RNA.
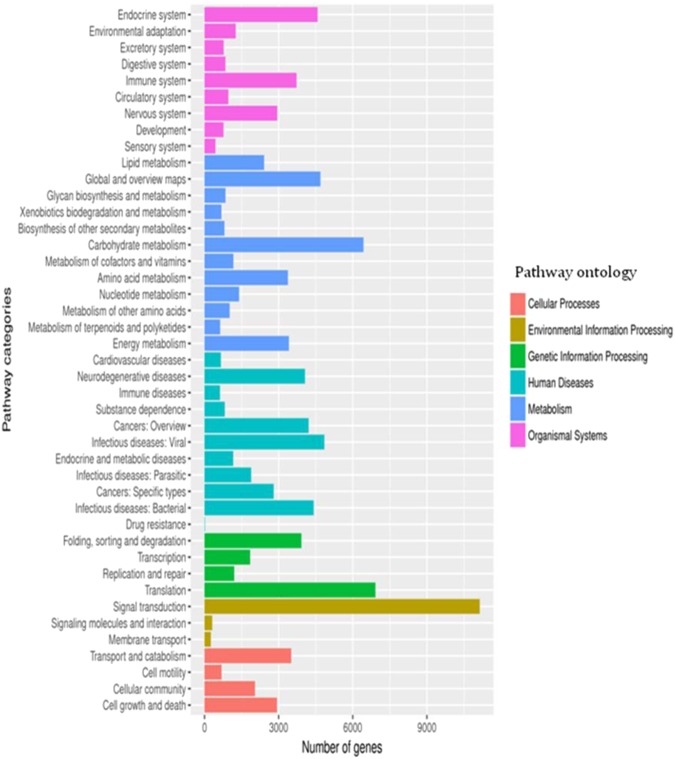
The KEGG database simulates biological reactions through computational analysis and calculates and predicts metabolic pathways and functions of cellular gene products. It can provide integrated metabolic pathways and relationships between pathways, and comprehensively annotate enzymes that catalyse each step of the reaction. From this analysis, we found that 43,684 transcripts could be assigned to 311 pathways in six major categories. The six main categories were “organismal systems” “metabolism,” “genetic information processing”, “human diseases”, “environmental information processing”, and “cellular process”. The highest numbers of UniGene sequence transcripts included in each category were as follows: “endocrine system”, 4,575 (10.47%); “carbohydrate metabolism”, 6,433 (14.73%); “translation”, 6,915 (15.83%); “infectious diseases: viral”, 4,848 (11.10%); “signal transduction”, 11,136 (25.49%); and “transport and catabolism”, 3,510 (8.03%), as shown in Fig. 4. In addition, we also noted some enzymes that were enriched in the KEGG pathway for common secondary metabolites (Table 3). These included three KEGG pathways associated with alkaloid synthesis, which included 200 UniGene sequences. There were two KEGG pathways associated with tyrosine anabolism containing 431 UniGene sequences, which may be related to the aristolochic acid synthesis pathway.
Figure 4.
KEGG pathway classifcation map. Genes were divided into fve branches according to the biological pathways they participated in: (Red), Cellular Processes; (Yellow), Environmental Information Processing; (Green), Genetic Information Processing; (Blue), Human Diseases; (Deep Blue), Metabolism; (purple), Organismal Systems.
Table 3.
Secondary metabolism pathways in A. heterotropoides.
| Pathway | Gene_num |
|---|---|
| ko00950 Isoquinoline alkaloid biosynthesis | 97 |
| ko00901 Indole alkaloid biosynthesis | 3 |
| ko00400 Phenylalanine, tyrosine and tryptophan biosynthesis | 209 |
| ko00350 Tyrosine metabolism | 222 |
| ko00960 Tropane, piperidine and pyridine alkaloid biosynthesis | 100 |
| ko00940 Phenylpropanoid biosynthesis | 286 |
| ko00900 Terpenoid backbone biosynthesis | 253 |
| ko00902 Monoterpenoid biosynthesis | 10 |
| ko00904 Diterpenoid biosynthesis | 28 |
| ko00909 Sesquiterpenoid and triterpenoid biosynthesis | 36 |
| ko00944 Flavone and flavonol biosynthesis | 2 |
| ko00941 Flavonoid biosynthesis | 51 |
| ko00130 Ubiquinone and other terpenoid-quinone biosynthesis | 144 |
| ko00942 Anthocyanin biosynthesis | 3 |
| ko00860 Porphyrin and chlorophyll metabolism | 217 |
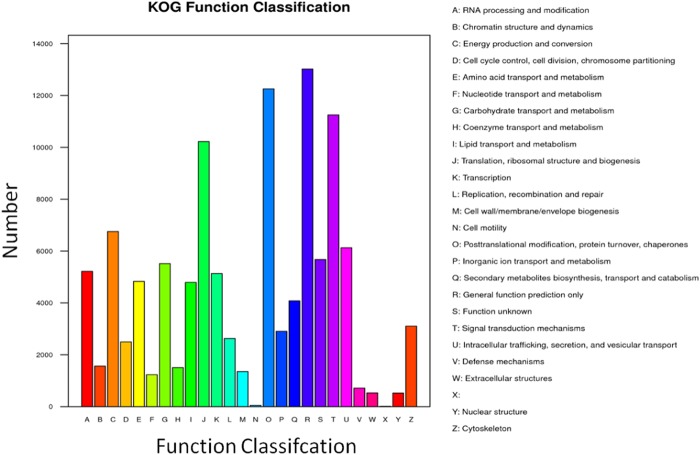
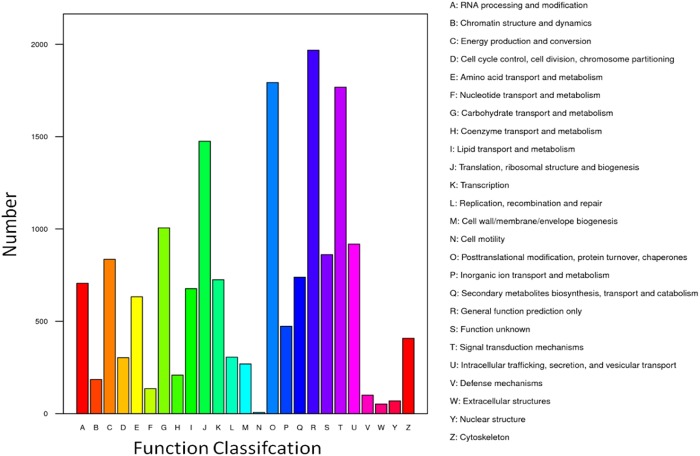
The COG/EuKaryotic Orthologous Groups (KOG) database is based on the phylogenetic relationship of encoded proteins of the complete genomes of bacteria, algae, and eukaryotes. The alignment could annotate a specific protein sequence to a specific COG, and each cluster of the COG is composed of orthologous sequences, which enables the identification of sequence functions. This analysis identified 102,165 UniGene sequences that were annotated (Fig. 5). The most common was the general function prediction, which consisted of 13,020 sequences, accounting for 12.74% of the total annotation. The second and third were adopted from the UniProtKB entry post-translational modification, protein turnover, chaperones, and signal transduction mechanisms, and they had 12,254 and 11,251 UniGene sequences, accounting for 11.99% and 11.01%, respectively of the total annotation ratio. Among these notes, we were more concerned with amino acid transport and metabolism (4,831 and 4.73%), secondary metabolite biosynthesis, transport, and catabolism (4,080 and 3.99%), and defence mechanisms (715 and 0.70%).
Figure 5.
KOG Function classifcation map.
Differential gene expression analysis
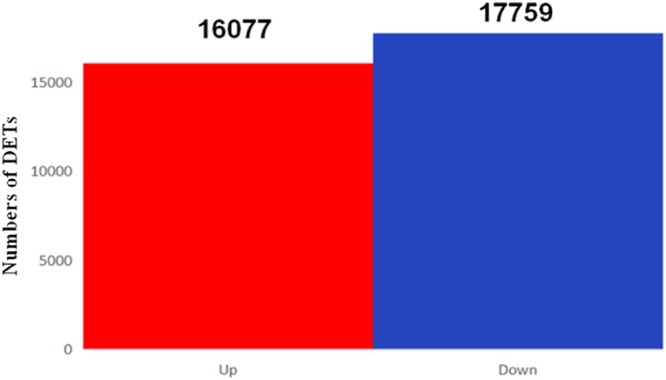
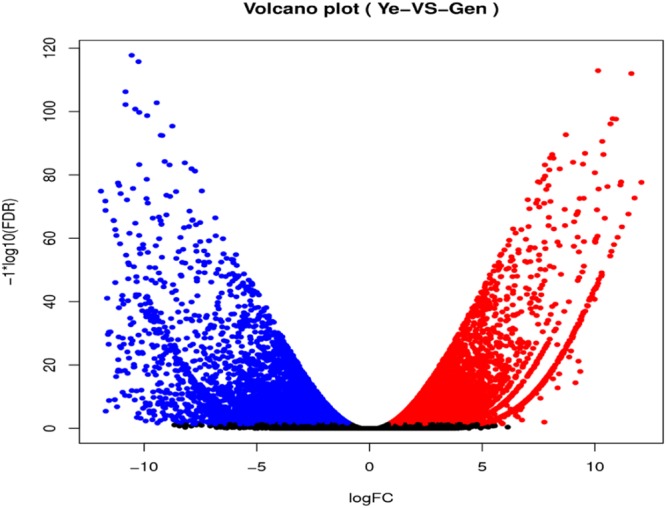
To study differential gene expression in different tissues, we used bowtie2 (2.1.0) to map high-quality reads from individual samples onto the A. heterotropoides transcriptome. Approximately 67.97–76.14% of the total reads were successfully located in the transcriptome (Table 4). Differentially expressed transcripts were screened for more than 2-fold changes in differential gene expression and false discovery rate (FDR) ≤0.05. Substantial transcriptional differences were observed in pairwise comparisons between different tissues. We used the A. heterotropoides UniGene of leaves as the control compared to UniGene of roots, and a comparison of the data for the leaves and roots showed that 16,077, 17,759, and 33,836 genes were up-regulated, down-regulated, and differentially expressed, respectively (Figs 6 and 7).
Table 4.
Comparison Table.
| Samples | Total_reads | Total_mapped | Unique_mapped | Multi_mapped | Mapped (%) | Unique (%) |
|---|---|---|---|---|---|---|
| Leaf -1 | 43557996 | 30994358 | 24074268 | 6920090 | 71.16 | 55.27 |
| Leaf -2 | 43192306 | 31780440 | 24724786 | 7055654 | 73.58 | 57.24 |
| Leaf -3 | 43795384 | 29768932 | 23201770 | 6567162 | 67.97 | 52.98 |
| Root -1 | 50018222 | 38084954 | 30253176 | 7831778 | 76.14 | 60.48 |
| Root -2 | 40926052 | 30801496 | 24492586 | 6308910 | 75.26 | 59.85 |
| Root -3 | 44318070 | 33477706 | 26489654 | 6988052 | 75.54 | 59.77 |
Figure 6.
Significantly Differentially Expressed Transcripts between Leaves and Roots in A. heterotropoides.
Figure 7.
Volcano of Significantly Differentially Expressed Transcripts between Leaf and Root in A. heterotropoides.
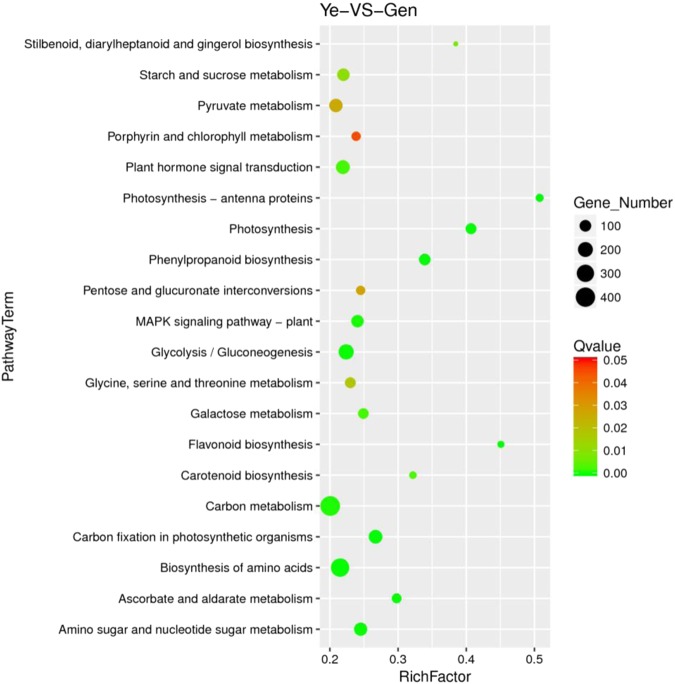
The KEGG enrichment scatter plot is a graphical representation of the KEGG enrichment analysis results and as shown in Fig. 8, the degree of KEGG enrichment was measured using the Richfactor, Q-value, and the number of genes enriched in this plant metabolic network. The Richfactor refers to the ratio of the number of differentially expressed to the total number of annotated genes in the plant metabolic network entry. The larger the Richfactor value, the greater the degree of enrichment. The Q-value, which is the P-value after multi-hypothesis test correction has a range of 0–0.05, and the closer the value is to zero, the more significant the enrichment. Based on an analysis of this graph, we concluded that carbon metabolism accounted for the largest proportion of enriched genes (365, 7.33%), followed by biosynthesis of amino acids (345, 6.92%), starch and sucrose metabolism (173, 3.47%), plant hormone signal transduction (165, 3.31%), phenylalanine metabolism (83, 1.67%), phenylpropanoid biosynthesis (95, 1.91%), and flavonoid biosynthesis (23, 0.46%). These plant metabolic networks are related to the secondary metabolic plant metabolic networks.
Figure 8.
The KEGG enrichment scatter plot.
In the COG/KOG annotation analysis of differentially expressed genes, we focused on the biosynthesis, transport, and catabolism of secondary metabolites (739); amino acid transport and metabolism (633); and defence mechanisms (100) as shown in Fig. 9.
Figure 9.
KOG Function classifcation map in differentially expressed genes.
Putative genes involved in the aristolochic acid I biosynthesis plant metabolic network
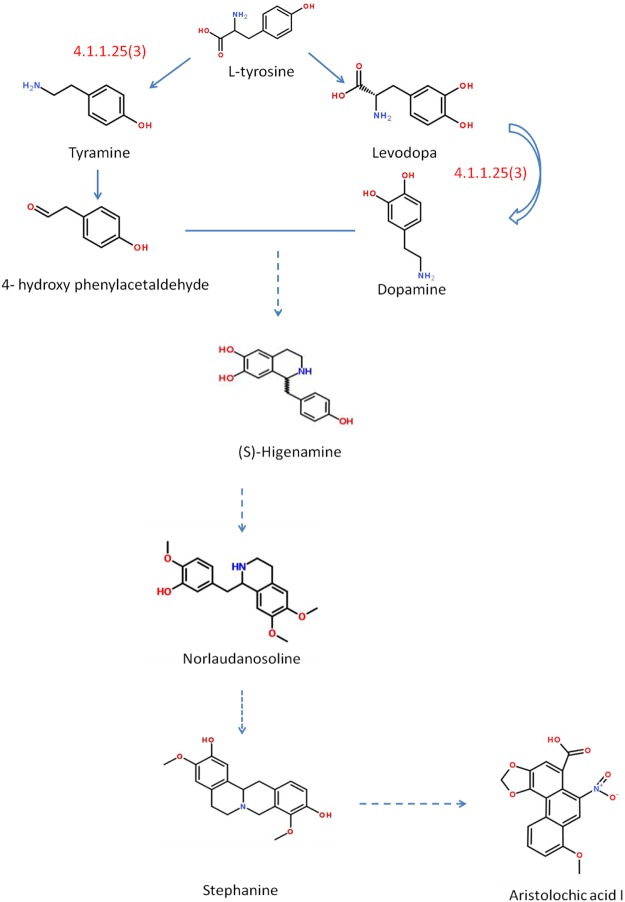
Comer et al.13 reported the formation of radioactive aristolochic acid I when [β-14C,15N]-tyrosine was added to Aristolochia sipho. The synthesis pathway of aristolochic acid I is speculated to be tyrosine → tyramine → 4-hydroxy-phenyl-acetaldehyde → (s)-nor-amethoxine → (S)-Nor Laudanine → orientaliue → stephanine → aristolochic acid I, adapted from the literature published by Comer (1969)14 (Fig. 10). Schutte et al.14 applied DL-[4-14C]-allo-labardine hydrochloride and DL-[4-14C]-tetrahydropapamine hydrochloride to the stem of A. sipho, and radioactive aristolochic acid I was only obtained where allotropone was smeared, but at a low concentration. Therefore, stephanine has not been proven to be an intermediate product of aristolochic acidI biosynthesis.
Figure 10.
Proposed plant metabolic network of aristolochic acidIbiosynthesis. 4.1.1.25 represents tyrosine decarboxylase. Adapted from the literature published by Comer F (1969)14.
Combining the results of the analysis of the putative aristolochic acid synthesis plant metabolic network and transcriptome data, it was determined that possible precursor compounds for the synthesis of aristolochic acid were in KEGG00950 and 00350. Differentially expressed genes from these plant metabolic networks in the transcriptome data were screened, and 34 genes with strong correlation were obtained (Supplemental Tables 1 and 2). Among these candidate genes, there were 30 enzymes prior to tyrosine decarboxylase and 4 tyrosine decarboxylases. We first analysed and cloned two predicted enzymes that were enriched near stephanine, but the cloning was unsuccessful because the size of the predicted gene fragment was too small (approximately 200 bp) or the copy number of the gene itself was low. A. heterotropoides has a high content of active ingredients and a small amount of aristolochic acid I in the three basic plant species, as stipulated by the Chinese Pharmacopoeia, which may be why it is difficult to enrich the terminal enzyme gene in the entire plant metabolic network in transcripts.
Aristolochic acid is the first phenanthrene-containing acid found in nature and its biosynthetic pathway involves multiple enzyme gene. The details of the plant metabolic network remain unclear. Tyrosine deaminase is involved in nitrogen metabolism and important nodes generated by nitrogen compounds. Therefore, we chose to study its correlation with aristolochic acid synthesis. In previous studies, we preliminarily determined that there may be a correlation between TyrDC enzyme activity and aristolochic acid Icontent using various experiments, and speculated that TyrDC might be related to the biosynthesis pathway of aristolochic acidI.
Based on the above analysis, we chose to further study the TyrDC gene.
Bioactive compound biosynthesis and accumulation
To detect possible associations between TyrDC gene expression and metabolite production, we determined the content of aristolochic acidI in roots and leaves (Supplemental Fig. 1). The aristolochic acid I content in the roots was higher than that in the fresh leaves, whereas it was higher in the leaves after drying than it was in the roots (Table 5). We also included the content of aristolochic acid I in the stems and flowers as a reference15 (Table 6). However, since the stems and flowers are not used as medicine, we did not use them as samples for transcriptome sequencing. Aristolochic acid I is toxic to humans and other species and, therefore, its high content could be a defensive mechanism of plants against predators. The expression profile of metabolite biosynthetic genes in different tissues correlated with the metabolite content.
Table 5.
Aristolochic acid I content in roots and leaves of A. heterotropoides.
| Weight | Root μg·g−1 | Leaf μg·g−1 | |
|---|---|---|---|
| Aristolochic acidI | Fresh weight | 89.4955 ± 2.4526 | 46.1213 ± 1.4298 |
| Dry weight | 122.5328 ± 4.3668 | 1939.3629 ± 9.2510 |
Table 6.
Aristolochic acid I content in stems and flowers of A. heterotropoides.
| Stem μg·g−1 | Flower μg·g−1 | |
|---|---|---|
| Aristolochic acid I | 1710.6289 ± 7.5628 | 3243.1121 ± 8.0294 |
Quantitative reverse transcription-polymerase chain reaction (qRT-PCR) validation of different expression patterns
To validate the transcriptome analysis data and better understand the molecular basis of the metabolic plant metabolic networks involved in aristolochic acid biosynthesis, we selected three transcripts of TyrDCs and determined their expression patterns using quantitative reverse transcription-polymerase chain reaction (qRT-PCR). The results of the qRT-PCR in the transcriptome data were compared to verify that the transcriptome results were authentic and reliable. Based on the analysis of the expression of tyrosine decarboxylase in A. heterotropoides and leaves and the content of aristolochic acid I, the results confirmed that tyrosine decarboxylase had a strong positive relationship with the biosynthesis of aristolochic acid I (Fig. 11 and Supplemental Table 3).
Figure 11.
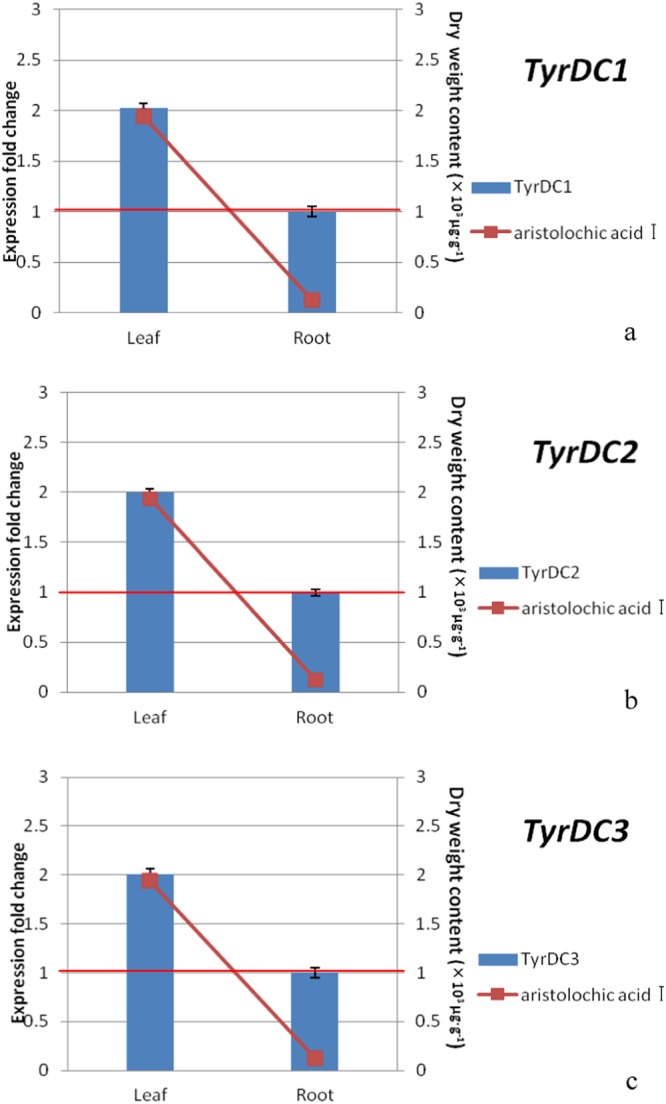
The expression pattern of TyrDCs across different tissues. a, b, and c represent the content of aristolochic acidIand the relative expression levels of TyrDC1, TyrDC2, and TyrDC3 in A. heterotropoides, respectively. The expression levels of TyrDCs in leaves relative to the values of roots (control), which were given an arbitrary value of 1.
Full-length clones of TyrDC family
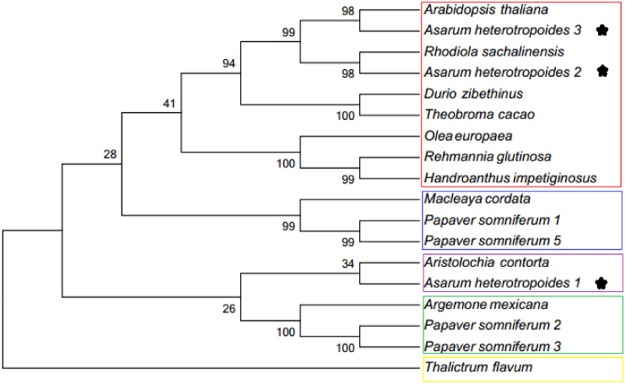
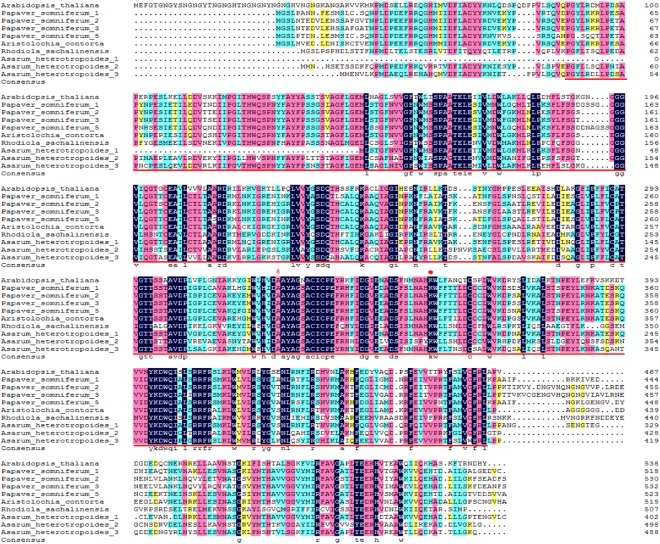
We cloned the full-length gene of the TyrDC family found in the plant metabolic network and obtained the complete coding sequences (CDS) of three genes based on predicted genes in the transcriptome data. This finding demonstrated the existence of the gene in A. heterotropoides. Furthermore, information on these three genes was submitted to GenBank (TyrDC1 ID: MH119138, TyrDC2 ID: MH119139, and TyrDC3 ID: MH119140). The phylogenetic tree was based on TyrDC sequences of 13 species (Fig. 12). Phylogenetic trees are divided into five categories. TyrDC2 and TyrDC3 are highly homologous with the TyrDC of nine species. TyrDC2 has high homology with Rhodiola sachalinensis, which is cold-tolerant and rich in alkaloids. Similarly, A. heterotropoides also has such physiological characteristics. Therefore, TyrDC2 may be involved in the accumulation of alkaloids and plant stress tolerance. TyrDC1 has high homology with Aristolochia contorta. Both are the Aristolochia plants, which contain aristolochic acid. Therefore, TyrDC1 may be a relatively unique TyrDC in Aristolochia plants. Comparison of the amino acid sequences of TyrDC1, TyrDC2, and TyrDC3 revealed that their functional domains were identical to those of seven TyrDCs from four other plant species (Fig. 13).
Figure 12.
Phylogenetic tree of TyrDCs included Asarum heterotropoides TyrDCs (1, 2, 3) (in this article). The phylogenetic tree was constructed using MEGA software (version7.0) based on the Maximum Likelihood (ML) method. Values above the branches are bootstrap percentages (1000 replicates). Abbreviations and access codes are as follows: Asarum heterotropoides (1, 2, 3), Asarum heterotropoides Tyrosine decarboxylase 1, 2, 3 (in this article); Aristolochia contorta (ABJ16446.1), Aristolochia contorta tyrosine decarboxylase; Papaver somniferum 1 (P54768.1), Papaver somniferum Tyrosine/DOPA decarboxylase 1; Papaver somniferum 2 (P54769.1), Papaver somniferum Tyrosine/DOPA decarboxylase 2; Papaver somniferum 3 (P54770.2), Papaver somniferum Tyrosine/DOPA decarboxylase 3; Papaver somniferum 5(P54771.1), Papaver somniferum Tyrosine/DOPA decarboxylase 5; Rhodiola sachalinensis (ABF06560.1), Rhodiola sachalinensis Tyrosine/DOPA decarboxylase; Macleaya cordat (OUZ99264.1), Macleaya cordata Pyridoxal phosphate-dependent decarboxylase; Thalictrum flavum (AAG60665.1), Thalictrum flavum tyrosine/dopa decarboxylase; Argemone mexicana (ACJ76782.1), Argemone mexicana tyrosine/DOPA decarboxylase; Olea europaea (ALG62777.1), Olea europaea putative tyrosine decarboxylase; Theobroma cacao (EOX96928.1), Theobroma cacao Tyrosine/DOPA decarboxylase; Handroanthus impetiginosus (PIN03085.1), Handroanthus impetiginosus Aromatic-L-amino-acid/L-histidine decarboxylase; Durio zibethinus (ALG62777.1), Durio zibethinus tyrosine/DOPA decarboxylase 1-like; Rehmannia glutinosa (AOC38014.1), Rehmannia glutinosa tyrosine decarboxylase; Arabidopsis thaliana (AEE85525.1), Arabidopsis thaliana L-tyrosine decarboxylase; The Asarum heterotropoides TyrDC1, 2, and 3 as labeled after taxon marker.
Figure 13.
Multi-alignment of TyrDCs included Asarum heterotropoides TyrDCs (1, 2, 3) (in this article). The Pyridoxal-deC domain is underlined, the arrow shows the aspartate D residue that interacts with the activation site, and the asterisk shows a conserved activation site lysine K residue. Abbreviations and access codes are as follows: Asarum heterotropoides (1, 2, 3), Asarum heterotropoides Tyrosine decarboxylase1, 2, 3 (in this article); Arabidopsis thaliana (AEE85525.1) Arabidopsis thaliana L-tyrosine decarboxylase; Aristolochia contorta (ABJ16446.1), Aristolochia contorta tyrosine decarboxylase; Rhodiola sachalinensis (ABF06560.1), Rhodiola sachalinensis Tyrosine/DOPA decarboxylase; Papaver somniferum 1 (P54768.1), Papaver somniferum Tyrosine/DOPA decarboxylase 1; Papaver somniferum 2 (P54769.1), Papaver somniferum Tyrosine/DOPA decarboxylase 2; Papaver somniferum 3 (P54770.2), Papaver somniferum Tyrosine/DOPA decarboxylase 3; Papaver somniferum 5 (P54771.1), Papaver somniferum Tyrosine/DOPA decarboxylase 5; Single, fully conserved residues are indicated by an asterisk.
Conclusion
In this study, transcriptomic high-throughput sequencing of A. heterotropoides was performed for the first time. In-depth transcriptome sequence data allowed us to identify the expression levels of key enzymes involved in the aristolochic acid biosynthetic pathway. To gain insights into the biosynthesis of biologically active compounds in A. heterotropoides, expression levels of genes associated with bioactive compound content in different tissues were evaluated, which revealed the complexity of gene expression and metabolite accumulation in the biosynthetic pathway. These findings need to be confirmed through further molecular, biochemical, enzymological, and physiological studies to better understand the underlying regulatory mechanisms involved. Nevertheless, our transcriptome data represent the first genomics resource of A. heterotropoides and lay the foundation for further research into A. heterotropoides using genetics, genomics, and biotechnology methods.
Materials and Methods
Plant material
We collected 6-year-old Asarum [A. heterotropoides Fr. Schmidt var. mandshuricum (Maxim.) Kitag.] seedlings from the Jilin Agricultural University of China Medicinal Materials College at the on 3 September 2016. The growth conditions were as follows: in the early stage of cultivation, we built an awning shed and manually weeded around the plants regularly during the growing process, and the rest were untreated. The seedlings had underground roots and leaves, and the dark green leaves that were free from worms were stored at −80 °C.
RNA isolation and transcriptome sequencing
Total RNA from the roots and leaves of three plants was extracted and triplicate samples were processed separately. The quality of the RNA samples was evaluated using a bioanalyzer (Agilent, USA). The mRNA was captured using the NEBNext Poly(A) mRNA Magnetic Isolation Module, and the cDNA libraries were constructed using the NEBNext Ultra RNA Library Prep kit for Illumina and purified using Beckman Agencourt AMPure XP beads, followed by detection and quantification using the Agilent bioanalyzer 2100 and Qubit. cBOT auto-clustering was performed using the TruSeq PE cluster kit v4. The clustered library was processed using the TruSeq SBS kit v4-HS and then sequenced using the Illumina HiSeq 2000 platform using the two-terminal sequencing method.
De novo assembly and sequence processing
The bcl2fastq16 (v2.17.1.14) software and FastQC (v0.10.1) were used to analyse the initial sequence data quality to obtain the pass filter data. The raw data read from six RNA-sequences (RNA-seqs) were subjected to quality trimming using the second-generation sequencing data quality statistics software, Cutadapt17 (version 1.9.1), to sequence the pass filter data to remove the linker and low-quality sequences to obtain clean data for subsequent information analysis. With the UniGene sequence file as a reference gene file, RSEM18 (v1.2.6) estimated gene and isoform expression levels from the pair-end clean data. Paired-end sequencing used 2 × 150 bp sequenced arm. The Cutadapt procedure was as follows: the adaptor sequence and bases whose masses at the 5′ or 3′ end were lower than 20 were removed, the reads containing more than 10% of N were removed, and reads less than 75 bp long were removed after trim removal.
Because there is no report on the genome or transcriptome data of A. heterotropoides, it was necessary to splice the clean data. Trinity19 (v2.2.0) was used to assemble the sample data from scratch. The assembly results were further sequenced and de-redundantly processed using sequence clustering to obtain long non-redundant UniGene sequences.
Assembly was performed by Trinity, which represents a novel method for the efficient and robust de novo reconstruction of transcriptomes from RNA-seq data. Trinity combines three independent software modules: Inchworm, Chrysalis, and Butterfly, applied sequentially to process large volumes of RNA-seq reads. Duplicated contigs were removed by cd-hit to obtain the UniGene sequence file.
Gene function annotation
Open reading frames were predicted using the TransDecoder, and the data were annotated using the Nr, PFAM, and Swiss-Prot databases using the BLASTX program. The KEGG automatic annotation server 63 was used to map the transcript pathways in the non-redundant UniGene collection.
Differential gene expression analysis
In the absence of a reference genome, UniGene was used to concatenate the Trinity data, the clean and UniGene data were compared, and then Bowtie220 (2.1.0) software with default parameters was used to compare short reads to quantify the genes.
Differential expression analysis used the DESeq221 (v1.18.0) Bioconductor package, a model based on the negative binomial distribution. After adjustments using Benjamini and Hochberg’s approach for controlling the false discovery rate, P-values of the genes were set at <0.05 to detect differentially expressed genes (changes in differential gene expression >2-fold and FDR ≤0.05). The entire FPKM22–26 density distribution reflected the UniGene expression data of the roots and leaves of A. heterotropoides.
qRT-PCR analysis
The qRT-PCR was performed using the ABI StepOne system and the Brilliant II SYBR Green qRT-PCR Master Mix kit One-Step. β-Actin was used as the reference gene, and the specific primer sequences are shown in Table 7. Fluorescence qRT-PCR was performed on each gene using three biological and technical replicates each. Relative gene expression levels were calculated using the 2−ΔΔCT method27–30.
Table 7.
Specific primer sequences.
| Name | Primer |
|---|---|
| TyrDC1 F-1 | 5′-GCTGGTCTGGGTAACACG-3′ |
| TyrDC1 R-1 | 5′-AAGAAAGAGCGGGATCAGC-3′ |
| TyrDC1 F-2 | 5′-AGTCGGAGTTGCGGGTGT-3′ |
| TyrDC1 R-2 | 5′-GCCAGTCTTTGTAATCCACCAC-3′ |
| TyrDC2 F-1 | 5′-GAAGGCTGTTCAAGGTCG-3′ |
| TyrDC2 R-1 | 5′-ATCTCGTAACACCGCCTC-3′ |
| TyrDC2 F-2 | 5′-ACCGCTCGTTGATATGGC-3′ |
| TyrDC2 R-2 | 5′-ACGCAGCAACAGTCCAGAT-3′ |
| TyrDC3 F-1 | 5′-CGAACATAGACGGGACTC-3′ |
| TyrDC3 R-1 | 5′-GCTTGTGATGCCTTATTT-3′ |
| TyrDC3 F-2 | 5′-TCGACGTGCTCTATTTCA-3′ |
| TyrDC3 R-2 | 5′-CAGGAGATAGGGCAAAGT-3′ |
| β-Actin -F | 5′-AGCAGCTTCCATTCCGATCA-3′ |
| β-Actin -R | 5′-GGTTACATGTTCACCACCAC-3′ |
Extraction and estimation of aristolochic acid I
The roots and leaves of the A. heterotropoides plant material were pulverised with liquid nitrogen, and 0.5 g of the powdered mixture was placed in a labelled 10 mL centrifuge tube, which was vortexed with 5 mL fresh 70% methanol (chromatography grade) for 30 s, kept aside for 1 h, and then weighed. After ultrasonication for 1 h, the tube was removed and then weighed again after cooling. The weight loss was compensated by adding 70% methanol, and 1.5 mL of the extract was centrifuged at 12,000 rpm for 1 min. The supernatant was filtered through a 0.22 μm organic membrane into a vial and stored airtight at 4 °C in the refrigerator.
The fresh leaves and roots were placed in a 40 °C oven and dried to a constant weight. The extraction was performed using the extraction step described above.
High-performance liquid chromatography (HPLC) detection was performed using a Shimadzu LC-10ATvp system with a ZORBAX SB-C18 column (250 × 4.6 mm, 5 μm; Agilent Technologies). Chromatographic conditions for determining aristolochic acid I (Cas:313-67-7, purity ≥98%, Shanghaishifeng, China) content were as follows: mobile phase, methanol–0.1% aqueous acetic acid (72:28); column temperature, 27 °C; flow rate, 1.0 mL/min; detection wavelength, 315 nm; and injection volume, 20 μL. The retention time was determined using standard samples, and the aristolochic acid I content of each tissue sample was determined using a linear regression equation. Each sample was analysed in triplicate31,32.
Cloning of TyrDC genes and identification of gene sequences
SnapGene Viewer (http://www.snapgene.com/) was used to detect the cleavage sites and positions of TyrDC1, TyrDC2, and TyrDC3 gene sequences. Primer 5 (Premier Biosoft International, Palo Alto, CA, USA) was used to determine the CG content and Tm value of the primers, according to the predicted gene screening of restriction sites and the principles of primer design. An OMEGA gel extraction kit (Norcross, GA, USA) was used to recover the PCR products from the gel, which were then examined using the NanoDrop 2000 instrument (Thermo Fisher Scientific)33.
TyrDC1, TyrDC2, and TyrDC3 were ligated using the pMD18-T vector and then transformed into Trans5α competent Escherichia coli cells for identification and sequencing33.
The obtained TyrDC amino acid sequences were compared with the amino acid sequences of TyrDC of other species using MUSCLE34,35 (http://www.drive5.com/muscle/) to generate the FASTA format, and the data were analysed using DNAman8 (https://www.lynnon.com/index.html). Phylogenetic trees (ML) were constructed using MEGA7 (https://www.megasoftware.net/)36,37.
Accession Codes
Te datasets of raw read sequences from each tissue were deposited in the NCBI Short Read Archive (SRA, SRA accession: SRP151557) database under the BioProject accession number PRJNA477885.
Electronic supplementary material
Acknowledgements
This research was supported by the Chinese Medicine Standardization Project: Standardization Construction of Seven Kinds of Chinese Medicinal Pieces such as Licorice (ZYBZH-Y-JL-25). We are thankful to GENEWIZ (Suzhou, China) for technical support with transcriptome sequencing. Furthermore, we also thank Editage [www.editage.cn] for English language editing.
Author Contributions
W.X.H. conceived and designed the experiments. W.X.H. and H.F. collected the materials. W.X.H., H.F. and Y.Y.C. performed the experiments. W.X.H. and H.F. compiled and interpreted the data. W.X.H. wrote the manuscript. Prof. Yang revised the manuscript.
Competing Interests
The authors declare no competing interests.
Footnotes
Publisher’s note: Springer Nature remains neutral with regard to jurisdictional claims in published maps and institutional affiliations.
Contributor Information
Xiaohan Wang, Email: xiaohanw@163.com.
Shihai Yang, Email: jlyangs@163.com.
Electronic supplementary material
Supplementary information accompanies this paper at 10.1038/s41598-018-36316-0.
References
- 1.Liu DJ, Liu CS. Chemical components of volatile oil chemical of cultivated Asarum produced in different places. Chinese Journal of Experimental Traditional Medical Formulae. 2010;16:79–82. [Google Scholar]
- 2.Zeng HY, Jin YZ, Bao LT, Wang P. Analysis on fingerprint chromatogram of the volatile oils obtained from Asarum heterotropoides with different methods. J. Test Meas. Techn. 2004;18:232–236. [Google Scholar]
- 3.Lv S, et al. Chemical composition of the underground part of Asarum (II) J. Shenyang Pharm. Univ. 2015;27:707–710. [Google Scholar]
- 4.Chinese Pharmacopoeia Commission. Pharmacopoeia of the people’s republic of China (Volume I)[S], 230–231 (2015).
- 5.Nanjing University of Traditional Chinese Medicine. Dictionary of Chinese Medicine [M], 2085–2088 (2006).
- 6.Medicine Control Agency of United Kingdom (UK MCA). UK MCA to ban certain herbals. Scrip. 2509, 4 (2001).
- 7.Rao XR, Li S, Li XY, Yao NL. Analysis of two notices on U.S. FDA kidney damage of Aristolochia herbal medicine. Chinese Journal of Information on Traditional Chinese Medicine. 2001;8:82. [Google Scholar]
- 8.Wang BG, et al. Requirements of FDA for preclinical toxicological studies on preparation of phytomedicine in US. Chinese Traditional and Herbal Drugs. 2013;44:116–119. [Google Scholar]
- 9.Bliss BJ, et al. Characterization of the basal angiosperm Aristolochia fimbriata: a potential experimental system for genetic studies. BMC. Plant Biol. 2013;13:1–25. doi: 10.1186/1471-2229-13-13. [DOI] [PMC free article] [PubMed] [Google Scholar]
- 10.Zeng LP, et al. Resolution of deep angiosperm phylogeny using conserved nuclear genes and estimates of early divergence times. Nat. Commun. 2014;5:4956. doi: 10.1038/ncomms5956. [DOI] [PMC free article] [PubMed] [Google Scholar]
- 11.Matasci N, et al. Data access for the 1,000 Plants (1KP) project. Gigascience. 2014;3:17. doi: 10.1186/2047-217X-3-17). [DOI] [PMC free article] [PubMed] [Google Scholar]
- 12.Lim CE, et al. The complete chloroplast genome sequence of Asarum sieboldii Miq. (Aristolochiaceae), a medicinal plant in Korea. Mitochondrial DNA B. Resour. 2017;3:118–119. doi: 10.1080/23802359.2018.1424577. [DOI] [PMC free article] [PubMed] [Google Scholar]
- 13.Comer F, Tiwari HP, Spenser ID. Biosynthesis of aristolochic acid. Can. J. Chem. 1969;47:481–487. doi: 10.1139/v69-070. [DOI] [Google Scholar]
- 14.Schutte HR, Orban U, Mothes K. Biosynthesis of aristolochic acid. Eur. J. Biochem. 1967;1:70–72. doi: 10.1111/j.1432-1033.1967.tb00045.x. [DOI] [PubMed] [Google Scholar]
- 15.Gao J, Sun S, Li DK, Li W, Wei F. Quantitative analysis of aristolochic acid A in different parts of Asarum sieboldii Maq. by HPLC. Chinese Journal of Pharmaceutical Analysis. 2006;26(3):401–403. [Google Scholar]
- 16.Bolger AM, Lohse M, Usadel B. Trimmomatic: a flexible trimmer for Illumina sequence data. Bioinformatics. 2014;30:2114–2120. doi: 10.1093/bioinformatics/btu170. [DOI] [PMC free article] [PubMed] [Google Scholar]
- 17.Martin M. Cut adaptively removes adaptor sequences from high-throughput sequencing reads. EMBnet. 2011;17:10–12. doi: 10.14806/ej.17.1.200. [DOI] [Google Scholar]
- 18.Fu L, Niu BF, Zhu ZW, Wu ST, Li WZ. CD-HIT: accelerated for clustering the next generation sequencing data. Bioinformatics. 2012;28(23):3150–3152. doi: 10.1093/bioinformatics/bts565. [DOI] [PMC free article] [PubMed] [Google Scholar]
- 19.Haas BJ, et al. De novo transcript sequence reconstruction from RNA-seq using the Trinity platform for reference generation and analysis. Nat. Protoc. 2013;8:1494–512. doi: 10.1038/nprot.2013.084. [DOI] [PMC free article] [PubMed] [Google Scholar]
- 20.Langmead B, Salzberg SL. Fast gapped-read alignment with Bowtie 2. Nat. Methods. 2012;9:357–359. doi: 10.1038/nmeth.1923. [DOI] [PMC free article] [PubMed] [Google Scholar]
- 21.Robinson MD, McCarthy DJ, Smyth GK. edgeR: a Bioconductor package for differential expression analysis of digital gene expression data. Bioinformatics. 2010;26:139–140. doi: 10.1093/bioinformatics/btp616. [DOI] [PMC free article] [PubMed] [Google Scholar]
- 22.Li B, Dewey CN. RSEM: accurate transcript quantification from RNA-Seq data with or without a reference genome. BMC Bioinformatics. 2011;12:323. doi: 10.1186/1471-2105-12-323. [DOI] [PMC free article] [PubMed] [Google Scholar]
- 23.Robinson MD, Smyth GK. Moderated statistical tests for assessing differences in tag abundance. Bioinformatics. 2007;21:2881–2887. doi: 10.1093/bioinformatics/btm453. [DOI] [PubMed] [Google Scholar]
- 24.Robinson MD, Smyth GK. Small-sample estimation of negative binomial dispersion, with applications to SAGE data. Biostatistics. 2008;9:321–332. doi: 10.1093/biostatistics/kxm030. [DOI] [PubMed] [Google Scholar]
- 25.McCarthy DJ, Chen YS, Smyth GK. Differential expression analysis of multifactor RNA-Seq experiments with respect to biological variation. Nucleic Acids Res. 2012;40:4288–4297. doi: 10.1093/nar/gks042. [DOI] [PMC free article] [PubMed] [Google Scholar]
- 26.Liscombe DK, Macleod BP, Loukanina N, Nandi OI, Facchini PJ. Evidence for the monophyletic evolution of benzylisoquinoline alkaloid biosynthesis in angiosperms. Phytochemistry. 2005;66:1374–1393. doi: 10.1016/j.phytochem.2005.04.029. [DOI] [PubMed] [Google Scholar]
- 27.Wu ZG, et al. Cloning and sequence analysis of apomixis related gene MSI1 (Multicopy Suppressor of Ira1) in Taraxacum antungense. Int. J. Agric. Biol. 2015;17:1013–1018. doi: 10.17957/IJAB/15.0009. [DOI] [Google Scholar]
- 28.Yuan Y, Wang Z, Jiang C, Wang X, Huang L. Exploiting genes and functional diversity of chlorogenic acid and luteolin biosyntheses in Lonicera japonica and their substitutes. Gene. 2014;534:408–416. doi: 10.1016/j.gene.2012.09.051. [DOI] [PMC free article] [PubMed] [Google Scholar]
- 29.Pfaffl MW. A new mathematical model for relative quantification real-time PCR. Nucleic Acids Res. 2001;29:2002–2007. doi: 10.1093/nar/29.9.e45. [DOI] [PMC free article] [PubMed] [Google Scholar]
- 30.Livak KJ, Schmittgen TD. Analysis of relative gene expression data using real-time quantitative PCR and the 2−[Delta][Delta]CT method. Methods. 2001;25:402–408. doi: 10.1006/meth.2001.1262. [DOI] [PubMed] [Google Scholar]
- 31.Wang, X. H. Biosynthetic related enzymes of aristolochic acid in Asarum. Jilin Agricultural University (2014).
- 32.Ma, L. Effects of amino acids, PGRs and E0 gene on accumulations of secondary metabolisms in Asarum heterotropoides Fr. Schmidt var. mandshuricum (Maxim.) Kitag. Jilin Agricultural University (2016).
- 33.Wang, X. H. Exploration and functional identification of key enzyme genes of aristolochic acid synthetic pathway in Asarum. Jilin Agricultural University (2018).
- 34.Edgar RC. MUSCLE: multiple sequence alignment with high accuracy and high throughput. Nucleic Acids Res. 2004;32:1792–1797. doi: 10.1093/nar/gkh340. [DOI] [PMC free article] [PubMed] [Google Scholar]
- 35.Edgar RC. MUSCLE: a multiple sequence alignment method with reduced time and space complexity. BMC Bioinformatics. 2004;5:113. doi: 10.1186/1471-2105-5-113. [DOI] [PMC free article] [PubMed] [Google Scholar]
- 36.Kumar S, Stecher G, Tamura K. MEGA7: Molecular evolutionary genetics analysis version 7.0 for bigger datasets. Mol. Biol. Evol. 2016;33:1870–1874. doi: 10.1093/molbev/msw054. [DOI] [PMC free article] [PubMed] [Google Scholar]
- 37.Wang FQ, et al. Cloning and expression analysis of a tyrosine decarboxylase gene from Rehmannia glutinosa. China Journal of Chinese Materia Medica. 2016;41:2981–2986. doi: 10.4268/cjcmm20161606. [DOI] [PubMed] [Google Scholar]
Associated Data
This section collects any data citations, data availability statements, or supplementary materials included in this article.


