

Abstract
The initial steps of membrane disruption by antimicrobial peptides (AMPs) involve binding to bacterial membranes in a surface-bound (S) orientation. To evaluate the effects of lipid composition on the S state, molecular dynamics simulations of the AMPs piscidin 1 (p1) and piscidin 3 (p3) were carried out in 4 different bilayers: 3:1 DMPC/DMPG, 3:1 POPC/POPG, 1:1 POPE/POPG, and 4:1 POPC/cholesterol. In all cases, the addition of 1:40 piscidin caused thinning of the bilayer, though thinning was least for DMPC/DMPG. The peptides also insert most deeply into DMPC/DMPG, spanning the region from the bilayer midplane to the head groups, and thereby only mildly disrupting the acyl chains. In contrast, the peptides insert less deeply in the palmitoyl-oleoyl containing membranes, do not reach the midplane, and substantially disrupt the chains; i.e., the neighboring acyl chains bend under the peptide, forming a basket-like conformation. Curvature free energy derivatives calculated from the simulation pressure profiles reveal that the peptides generate positive curvature in membranes with palmitoyl and oleoyl chains but negative curvature in those with myristoyl chains. Curvature inductions predicted with a continuum elastic model follow the same trends, though the effect is weaker and a small negative curvature induction is obtained in POPC/POPG. These results do not directly speak to the relative stability of the inserted (I) states or ease of pore formation, which requires the free energy pathway between the S and I states. Nevertheless, they do highlight the importance of lipid composition and acyl chain packing.
Keywords: spontaneous curvature, pressure profiles, molecular dynamics simulation, continuum elastic modeling
Introduction
The activities of antimicrobial peptides (AMPs) are associated with accumulation on bacterial membrane surfaces, conversion of a subpopulation of AMPs to an inserted state, and membrane disruption via pore formation or micellization (Brogden 2005; Wiesner and Vilcinskas 2010; Wimley 2010). The conversion between the surface-bound (S) and inserted (I) states is dependent on the lipid composi tion of the target membrane (Salnikov and Bechinger 2011). Recent solid-state NMR studies on the orientation of PGLa in the presence of Magainin 2 suggest that membranes composed of lipids with high negative spontaneous curvature (c0) stabilize the S state (Strandberg et al. 2013). More generally, lipids with smaller head groups and larger acyl chains (a motif common in bilayers with negative c0) appear to stabilize the S state, while lipids with similarly sized heads and tails (a hallmark of low curvature bilayers) allow for the I state (Strandberg et al. 2012). Competing theories attribute preference of the S state over the I state to hydrophobic mismatch between the bilayer thickness and lengths of the peptide that prevent peptide insertion (Salnikov and Bechinger 2011), although such local1 effects can be also related to spontaneous curvature. However, caution must be applied when generating hypotheses based on lipid shape and spontaneous curvature in pure bilayers for a number of reasons. Among them, experimental determinations of spontaneous curvatures are only available for a small number of lipids in the inverse hexagonal (HII) phase (Chen and Rand 1998; Fuller and Rand 2001; Gruner et al. 1986; Rand et al. 1990). Lipids that do not readily form pure Hn phases are mixed with 1,2 dioleoylphosphatidyl- ethanolamine (DOPE) and the curvatures for each lipid are assumed to be additive; computer simulations indicate that this assumption is incorrect for mixtures with sphingomyelin (Sodt, Venable, and Pastor, unpublished results). Measurements of spontaneous curvatures of peptide/lipid single-leaflet mixtures are difficult to carry out in the HII phase (Szule and Rand 2003), and the relation to curvature generation by peptides in planar bilayers (where the perturbation may influence the opposite leaflet) is uncertain. Finally, the relation of lipid shape and spontaneous curvature is an oversimplification. Two- chained charged lipids have been experimentally shown to have positive curvature (Fuller et al. 2003), but do not easily conform to the shape-based notion of “large head/small tail”. Similarly, recent simulations of pure sphingomyelin bilayers show positive curvature (Venable et al. 2014). More generally, the curvature a lipid prefers is a complicated balance involving intermolecular forces and acyl chain entropy. Even if it were a valid model, the “shape” of a lipid is difficult to determine from lipid molecular structure as space is filled throughout the bilayer when head-group hydration is considered.
In contrast to experiment, determination of spontaneous curvature of pure and mixed bilayers from simulation is relatively straightforward. Recent simulations have shown excellent agreement with experiment for the spontaneous curvature of DOPE in both the HII and lamellar phase (Sodt and Pastor 2013), and positive curvature generation by the amphipathic helix from ArfGAP1 was readily quantifiable (Sodt and Pastor 2014). The present study considers curvature generation and related bilayer perturbations (thinning and chain disruption) by the surface bound AMPs piscidin 1 (p1) and piscidin 3 (p3) in 4 different bilayers: 3:1 DMPC/DMPG, 3:1 POPC/POPG, 1:1 POPE/POPG, and 4:1 POPC/chol. (DMPC is 1,2-dimyristoyl-sn-glycero-3-phosphocholine; DMPG is 1,2-dimyristoyl-sn- glycero-3-phosphoglycerol; POPC is 1-palmitoyl,2-oleoyl-sn-glycero-3-phosphocholine; POPG is 1- palmitoyl,2-oleoyl-sn-glycero-3-phosphoglycerol; POPE is 1:1 1-palmitoyl,2-oleoyl-sn-glycero-3- phosphoethanol; and chol is cholesterol.) Previous simulations of p1 and p3 in 3:1 DMPC/DMPG and 1:1 POPE/POPG (Perrin Jr et al. 2014) showed excellent agreement with NMR experiments. While the two bilayers contain different head-groups, ionic content, acyl chain length, and acyl chain saturation, the peptide secondary structures and orientations did not change significantly with bilayer composition. Both p1 and p3 remained surface bound with τ (the angle with respect to the bilayer normal) ~90° and root mean fluctuations of ~10° in both bilayers. The major difference between the two bilayers is a 1–2 Å increase in peptide insertion in DMPC/DMPG compared to POPE/POPG. It was not determined if the difference in depth of insertion is a result of the dimyristoyl (DM) vs. 1-palmitoyl,2-oleoyl (PO) acyl chains, the smaller head group of PE vs. PC, or the 50% anionic character of 1:1 POPE/POPG vs. 25% in 3:1 DMPC/DMPG. The two additional systems, 3:1 POPC/POPG, and 4:1 POPC/chol, were added to this study partly to resolve these questions. Notably, the PC/PG and PE/PG mixtures are good mimics of bacterial membranes while the PC/chol system is often used to model mammalian cell membranes.
By way of outline, the relevant theory for computing spontaneous curvature from simulations of planar bilayers is briefly reviewed. This is followed by a description of the simulation methods, analysis justifying that 100 ns trajectories are adequate for the present study, and presentation of the continuum elastic model (CEM) used to compare with the MD simulations. The Results first describes the position and orientation of each peptide in the assorted bilayers. Electron density and pressure profiles are computed for each system. All profiles show thinning with the addition of peptide. Changes in lipid density at the midplane and deuterium order parameters are associated with acyl chain packing around peptide in PO-lipids. Curvature frustration changes upon peptide insertion from both the simulations and the CEM are then described. The Discussion and Conclusions compares the results across the different bilayers and with previous work, and considers the implications for understanding membrane disruption by AMPs.
Theory
The formalism applied here is for a lipid leaflet. When the leaflet is in the inverse hexagonal phase HII it is explicitly curved, and the radius of curvature R at the free energy minimum is called the spontaneous radius of curvature, R0. The curvature c = R−1, and the spontaneous curvature c0 = R0-1. By convention, negative curvature is defined to be concave with respect to the lipid head groups; e.g., a lipid leaflet in the HII has negative curvature, while a micelle has positive curvature. As the leaflet curvature c bends away from c0, the free energy of curvature F(c) is described by the Helfrich and Canham (Canham 1970; Helfrich 1973) model as
| (1) |
where is the bending modulus of the monolayer. Experimental values of Ro and for a limited number of lipids have been obtained by measurement of the radius of the water pore versus osmotic pressure within the context of Eq. (1) (Chen and Rand 1998; Fuller and Rand 2001; Gruner et al. 1986; Rand et al. 1990). These quantities can also be obtained by direct simulation of the HII phase, where the pressure difference in the middle of the water pore and the acyl chain region is equated to the osmotic pressure difference that is measured experimentally (Sodt and Pastor 2013).
The same formalism can be extended to a flat lipid bilayer, where the curvature is zero; i.e., the radius of curvature is infinite. The spontaneous curvature of each leaflet is not necessarily zero, and this quantity can be obtained starting from the following equation (Goetz and Lipowsky 1998; Szleifer et al. 1990):
| (2) |
where pT(z) pN(z) and are the tangential and normal local pressures along the bilayer normal z, and z=0 is the bilayer midplane. The bar over F’ indicates that the free energy is expressed per unit lipid area. Eq. (2) does not assume a model for F(c). The spontaneous curvature of a flat bilayer can be obtained by assuming that F(c) = FH(c), and differentiating Eq. (1):
| (3) |
The value of complicates the determination of c0 from Eq. (3). Experimental values for this quantity or the bilayer bending constant kc are not available for the lipid/peptide mixtures simulated here. Furthermore, bending constants for even pure bilayers vary substantially among experimental methods. For example, kc for DMPC at 30°C is 31.1 kbTas measured from shape fluctuations of vesicles (Méléard et al. 1997), 15.8 kbT from x-ray of multilamellar stacks (Nagle 2013), and 13.4 kbT by pipette aspiration (Rawicz et al. 2000), where kB is Boltzmann’s constant, and T is temperature. The differences in kc between these methods are somewhat smaller for lipids with unsaturated chains, but are still statistically different (Nagle 2013).
Calculation of kc from all atom MD simulations, which are typically limited to 100–200 lipids, is presently not routine. This is because the most direct method, relating the power spectrum of height fluctuations to where q is the wave vector (Safran 1994), requires system sizes of well over 1000 lipids. Brown and coworkers (Watson et al. 2012) have developed a formalism based on longitudinal lipid orientation that requires only ~400 lipids, but it is restricted to single component systems. As a practical matter, polymer brush (PB) theory developed by Evans and coworkers (Rawicz et al. 2000) is a plausible alternative to more rigorous methods. In PB theory:
| (4) |
where KA is the area expansion modulus and h is the hydrophobic chain thickness. For this study, kc is calculated using PB theory since it can be readily applied to the simulations. KA is obtained from
| (5) |
where is equilibrium area of the entire bilayer, and is the mean squared fluctuation of the area. Lastly, the monolayer bending constant is set to . The PB model predicts values of kc similar to those obtained with pipette aspiration, so are expected to be on the lower side of the experimental range. It should at least be a reasonable predictor of trends among similar lipids.
Methods
Simulations.
Table 1 lists all of the simulations presented in this paper. Simulations of pi and p3 in 3:1 DMPC/DMPG or 1:1 POPE/POPG from Perrin Jr et al. (2014) were used for further analysis, with p1 in 3:1 DMPC/DMPG extended to 500 ns (see Table 1 for trajectory lengths) to confirm that the peptide orientation remained stable with longer simulation times and study convergence. Trajectories of p1 and p3 in 1:1 POPE/POPG and 4:1 POPC/chol, and of each lipid system without peptide were generated using the same protocol. Simulations were performed using CHARMM 37b2 (Brooks et al. 2009) with CHARMM 22 protein parameters (MacKerell et al. 1998) and CHARMM 36 lipid parameters (Klauda et al. 2010) with modified Lennard-Jones pairwise distances for sodium ions interacting with select lipid oxygens (Venable et al. 2013). Each system was composed of 80 lipids, two peptides (1 per leaflet), a water layer ~16Å thick above and below the bilayer, 16 sodium ions, and sufficient chloride ions to neutralize the system. The 1:40 peptide:lipid ratio (half that of the NMR experiments presented in Perrin Jr et al. (2014) was chosen to study the peptides at low concentration, before they interact with each other along the bilayer plane.
Table 1.
Membrane elasticity and bending properties. All simulations were run at 313K, where kbT is 4.32×10⁻²¹ J.
| System | Time (ns) |
h (P-P) (Å) |
h (C2-C2) (Å) |
A (Å2) |
Fluctuations (Å4) |
KA (dyn/cm) |
(10−19 J) |
|---|---|---|---|---|---|---|---|
| 3:1 DMPC/DMPG | 100 | 35.8 ± 1.1 | 25.6 ± 0.7 | 2490 ± 11 | 4838 ± 548 | 245 ± 22 | 0.7 ± 0.1 |
| + p1 | 500 | 35.8 ± 1.3 | 25.1 ± 0.8 | 2711 ± 8 | 4006 ± 372 | 316 ± 26 | 0.8 ± 0.1 |
| + p3 | 100 | 36.2 ± 1.2 | 25.2 ± 0.9 | 2710 ± 13 | 5422 ± 769 | 263 ± 38 | 0.7 ± 0.1 |
| 3:1 POPC/POPG | 100 | 39.0 ± 1.0 | 28.9 ± 0.7 | 2632 ± 11 | 4618 ± 682 | 287 ± 32 | 1.0 ± 0.1 |
| + p1 | 100 | 37.4 ± 1.2 | 28.0 ± 1.2 | 2870 ± 9 | 4551 ± 674 | 332 ± 42 | 1.0 ± 0.2 |
| + p3 | 100 | 37.0 ± 1.1 | 27.5 ± 1.1 | 2894 ± 11 | 5462 ± 488 | 248 ± 22 | 1.1 ± 0.4 |
| 1:1 POPE/POPG | 100 | 39.8 ± 1.0 | 30.0 ± 0.7 | 2502 ± 12 | 4646 ± 727 | 287 ± 39 | 1.1 ± 0.1 |
| + p1 | 100 | 38.2 ± 1.2 | 28.3 ± 0.7 | 2807 ± 11 | 4025 ± 561 | 362 ± 48 | 1.2 ± 0.2 |
| + p3 | 100 | 37.8 ± 1.1 | 28.4 ± 0.8 | 2818 ± 7 | 3781 ± 490 | 419 ± 91 | 1.4 ± 0.3 |
| 4:1 POPC/Chol | 200 | 41.8 ± 0.9 | 32.4 ± 0.6 | 2184 ± 8 | 2753 ± 188 | 361 ± 27 | 1.6 ± 0.1 |
| + p1 | 200 | 39.8 ± 1.7 | 30.1 ± 0.6 | 2490 ± 8 | 2772 ± 321 | 438 ± 47 | 1.7 ± 0.2 |
| + P3 | 200 | 39.8 ± 1.1 | 30.6 ± 0.5 | 2468 ± 8 | 2661 ± 279 | 438 ± 38 | 1.7 ± 0.2 |
Initial structures of p1 and p3 were generated with angles of −61° and −45°, respectively, and extended side chains. One peptide was aligned with its center of mass 14 Å above the center of the bilayer, while the second peptide was 14 Å below the bilayer. This initial position yields a bilayer location of the peptide that is no deeper than the C2 atoms of the lipids. To minimize interaction across the bilayer, the peptides were rotated to be perpendicular to each other with respect to the bilayer normal. Each peptide was rotated around its helical axis to ensure that hydrophobic residues were facing the bilayer core. Systems were assembled using the CHARMM-GUI interface (Jo et al. 2008), where the different lipid types are packed randomly around the peptide.
Specific Lennard-Jones cutoffs and particle-mesh Ewald (Darden et al. 1993) electrostatics were required for the preceding force fields (Klauda et al. 2010). The Lennard-Jones potential terminated at 12 Å, with a smoothing function operating between 8 and 12 Å. Simulations were run with constant pressure and temperature (NPT) at 1 atm (zero surface tension) and 313 K. Tetragonal boundary conditions were imposed and the masses of the pressure pistons were set to 1000 amu. The Nosé-Hoover algorithm with thermal piston value of 10,000 kcal/mol•ps was used to maintain the temperature (Hoover 1985; Nose 1984). Trajectories were generated with a leap-frog Verlet algorithm with a time step of 1 fs. All bonds to hydrogen atoms were constrained using the SHAKE algorithm (Ryckaert et al. 1977). The initial 10 ns of each trajectory were removed to allow for equilibration and the remainder was used for analysis. The standard errors on averages were obtained from 10 ns blocks. The adequacy of this block size was confirmed by showing that standard errors from 10, 20, 50 and 100 ns blocks from the 500 ns trajectory are comparable.
Orientation from MD Structures.
The tilt of each peptide (τ) is equal to zero when the helical axis is parallel to the z-axis (N-terminus is lower than the C-terminus on the z-axis) and 90° when parallel with the bilayer surface. The orientation for the simulated piscidin at each time step was calculated relative to a piscidin structure with known orientation ( angles of −61°/−45° and all Euler angles set to zero). The depth of insertion of a peptide was calculated as the distance between the center of mass for heavy backbone atoms and the C2 atom for the sn-2 chain of each lipid molecule in the same leaflet. Separate centers of mass for residues 3–10 and 14–20 were used to avoid artifacts due to fraying of terminal residues and kinking previously revealed at G13 (Perrin Jr et al. 2014). The average of these two segments is reported.
Pressure profiles and .
Pressure profiles were calculated from the above simulations using the Harasima contour as described in Lindahl and Edholm (2000) and Sonne et al. (2005). At 0.5 ns intervals, pressure profiles were computed every 100 fs for 50 ps using one hundred equally spaced bins. This resampling protocol was validated in Venable et al. (2014). was calculated from Eq. (2).
Simulation Time Scale Considerations.
To address concerns of slower motions, such as lipid rearrangement around the peptide, the simulation of p1 in DMPC/DMPG was extended to 500 ns. The C2 of first shell lipids were within 9 Å of the peptide, while that of the second shell lipids was within 18Å. Fig. 1 (left) plots the paths of the 13 lipids in the first shell for the first 100 ns of the simulation: 12 of the 13 exited this shell, and 8 left the second shell. By 500 ns, all lipids initially in the first shell exchanged positioned with those outside of the second shell. As evidenced in the top right panel of Fig. 1, the composition of the first shell remains relatively constant over the 500 ns trajectory, maintaining an approximately 3:1 ratio of DMPC/DMPG (the same as the bulk). Therefore, there is no indication that anionic (DMPG) lipids accumulate around the cationic peptide in the 500 ns simulation. The 10 ns block averages for and KA show similar stability (middle and lower right panels of Fig. 1, respectively). The fluctuations in appear to increase after 100 ns, but the larger fluctuations are similar to those calculated by Sodt and Pastor (Sodt and Pastor 2013; Sodt and Pastor 2014). The fluctuations in KA are more constant over the trajectory. These results lend considerable support to the assertion that the 100 ns trajectories used to generate averages for the other systems presented here are adequate for evaluation of spontaneous curvature.
Fig. 1.
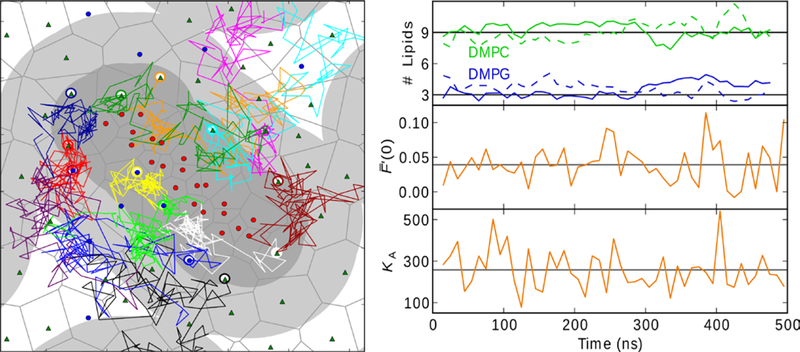
Left: diffusion of first-shell lipids of the top leaflet over the first 100 ns of the 500 ns MD simulation of piscidin 1 in DMPC/DMPG. The starting positions of peptide Cα atoms (red circles), DMPC C2 (green triangles), and DMPG (blue circles) are shown in their Voronoi cells (gray lines). The areas containing first-shell and second-shell lipids are designated as 9Å (dark gray) and 18Å (light gray) from the peptide Cα atoms. Right: 10 ns block averages over the length of the trajectory for first-shell lipid composition with top leaflet solid and bottom dashed (top), (middle), and KA (bottom).
Continuum Model.
The continuum model, based on the work of Campelo et al. (2008), is described in Sodt and Pastor (2014). Briefly, the bilayer is discretized by a grid of points with accompanying local elastic moduli that determine the energetics of deformations. Any change in the spacing between grid points (representing a local deformation) results in an energy penalty. The continuum model does not explicitly include any specific interactions - rather, the inclusion produces a local lateral deformation in the material that can be relaxed by curvature. The parameters in the model, which are derived from experimental quantities, can be effectively considered local lateral compressibilities, with the stiffest region being near the headgroups. The inclusion of a peptide (modeled as a cylinder with a radius of 5 Å and arbitrary length) at a specific depth of insertion (determined from the MD simulation) deforms the bilayer model and results in a static pressure profile (the negative of the stress). A change in c0 (denoted Δc0) is computed from this profile. The compressibility profile determines the natural pivot of bending. Deformations below this plane can be relaxed by negative curvature, while those above the plane can be relaxed by positive curvature.
Results
Table 1 lists bilayer thicknesses determined from both the average P-P distance and the average C2-C2 distance. Again, C2 values are from the sn-2 chain. The P-P distance is nearly identical in value to the peak-to-peak distance in electron density plots, while C2-C2 distance is a good surrogate for the hydrocarbon distance. Fig. 2 includes the electron density for phosphates (green), while the C2 density is included in the acyl chain profile (gray). The C2 peak alone overlaps with the peptide density and is omitted for clarity. The difference between the P-P and hydrocarbon thickness is roughly 10Å and in agreement with values from Nagle and Evans (Nagle and Tristram-Nagle 2000; Rawicz et al. 2000). Bilayer thickness for the pure bilayers follows the trend 3:1 DMPC/DMPG < 3:1 POPC/POPG < 1:1 POPE/POPG < 4:1 POPC/chol. This is expected as cholesterol thickens the membrane by extending acyl chains of POPC. To a lesser extent, the small head-group of POPE reduces the bilayer surface area and thereby extends the acyl chains.
Fig. 2.
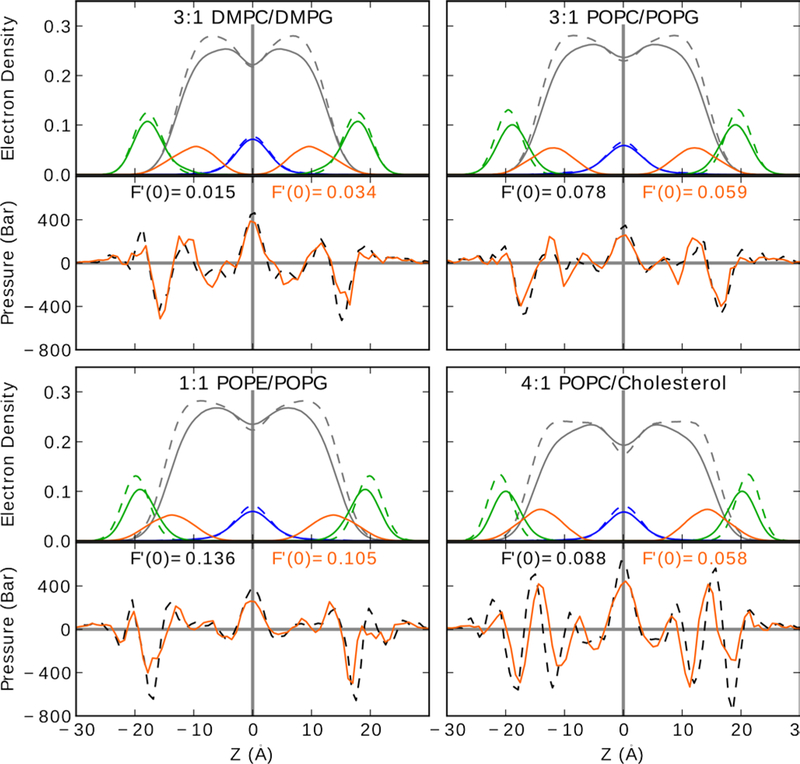
Electron density (top-half) and pressure (bottom-half) profiles for each system. Profiles for systems containing membrane and peptide are in solid lines, while systems with only the membrane are in dashed. Electron density profiles are shown for the peptides (orange), phosphates (green), acyl chains (grey), and terminal CH3 (blue). Lateral pressure profiles for pure bilayer (black) and bilayer + p1 (orange) are shown. Errors in are between 0.004 and 0.012 kcal/Å and are listed in Table 2. See Fig. S1 of Supplemental Material for p3 profiles, and Fig. S3 for the methyl densities for each leaflet
The peptide structures and orientations are similar to previous piscidin simulations (Perrin Jr et al. 2014). All peptides remain surface-bound with τ ~90°. No significant deviation from a-helical structures occurred. The similarity in orientation and internal peptide structure simplifies the direct comparison of the bilayer response. The depths of peptide insertion are listed in Table 2. Here, the depths of insertion are reported relative to the sn-2 chain of all lipids in the same monolayer as the peptide. This differs from earlier work (Perrin Jr et al. 2014), where only lipids >10Å from the peptide were considered. Consequently, the depths of insertion reported here are smaller in magnitude than those in our previous work, because they include first shell lipids that are most perturbed by the peptide and generally below the average lipid height. As in the earlier work, the peptides are 1–2 Å more inserted in 3:1 DMPC/DMPG than 1:1 POPE/POPG. In simulations of pi or p3 in 3:1 POPC/POPG and 4:1 POPC/chol, the depths of insertion are similar to that of 1:1 POPE/POPG. This supports the assertion that the deeper insertion in 3:1 DMPC/DMPG is predominantly determined by the shorter and saturated DM acyl-chains. Insertion of the peptide thins the lipid bilayer. With exception of DMPC/DMPG, thinning is reflected in the change in the phosphate peak of the electron density profiles (Fig. 2, green). In DMPC/DMPG, the change in the phosphate peak is negligible for p1 and thickens the bilayer for p3 (Fig. S1). In contrast, the hydrocarbon thickness decreases by ~0.5 Å for DMPC/DMPG in the presence of p1 and p3. In all PO systems, the electron density profile has a decrease in peak height and an increase in peak width. This peak widening is asymmetric; the wing density inside the bilayer thickens while the wing outside the bilayer does not change significantly. This is because lipid head groups near the peptide are pulled into the bilayer by the peptide, while head groups further from the peptide maintain bulk-like heights. Thinning of C2-C2 in PO-lipids is 1–2 Å (Table 2) and comparable to the change in P-P distance. In the remainder of this paper, thinning will be discussed as the change in hydrocarbon thickness.
Table 2.
Peptide insertion (Depth), membrane thinning (Δh), and curvature properties of simulated systems.
| System | Depth (Å) |
Δh (C2-C2) (Å) |
(kcal/mol/A−1) |
(kcal/mol) |
c0 (10−3 Å−1) |
R0 (Å) |
|---|---|---|---|---|---|---|
| 3:1 DMPC/DMPG | - | - | 0.014 ± 0.009 | 4.8 ± 0.5 | −2.9 ± 0.3 | −345 ± 5 |
| + p1 | 2.7 ± 0.3 | −0.5 ± 1.1 | 0.039 ± 0.004 | 6.0 ± 0.6 | −6.5 ± 0.6 | −154 ± 6 |
| + p3 | 2.9 ± 0.3 | −0.4 ± 1.1 | 0.037 ± 0.012 | 5.0 ± 0.8 | −7.4 ± 1.1 | −136 ± 5 |
| 3:1 POPC/POPG | - | - | 0.076 ± 0.014 | 7.2 ± 0.9 | −7.6 ± 0.9 | −94 ± 7 |
| + p1 | 1.7 ± 0.3 | −1.0 ± 1.4 | 0.056 ± 0.013 | 6.9 ± 1.3 | −5.8 ± 1.1 | −124 ± 7 |
| + p3 | 1.2 ± 0.3 | −1.4 ± 1.3 | 0.066 ± 0.004 | 7.6 ± 2.6 | −6.3 ± 2.2 | −115 ± 8 |
| 1:1 POPE/POPG | - | - | 0.139 ± 0.007 | 7.7 ± 1.1 | −10.6 ± 1.3 | −56 ± 8 |
| + p1 | 0.6 ± 0.3 | −1.7 ± 1.0 | 0.105 ± 0.011 | 8.7 ± 1.2 | −8.1 ± 1.5 | −83 ± 9 |
| + p3 | 1.8 ± 0.2 | −1.6 ± 1.1 | 0.120 ± 0.009 | 10.1 ± 2.3 | −8.7 ± 3.0 | −84 ± 10 |
| 4:1 POPC/Chol | - | - | 0.088 ± 0.011 | 11.3 ± 0.9 | −7.8 ± 0.6 | −129 ± 11 |
| + p1 | 1.0 ± 0.2 | −2.2 ± 0.8 | 0.055 ± 0.010 | 11.9 ± 1.3 | −4.6 ± 0.5 | −217 ± 12 |
| + p3 | 1.7 ± 0.1 | −1.7 ± 0.8 | 0.068 ± 0.008 | 12.3 ± 1.1 | −5.5 ± 0.5 | −181 ± 12 |
The addition of peptide increases the membrane area by ~300 Å2 and reduces the thickness (Table 1). Fluctuations in the bilayer area are large, and differences in the fluctuations with and without peptides are statistically insignificant for each lipid composition. Similarly, the differences among the DMPC/DMPG, POPC/POPG, and POPE/POPG systems are statistically insignificant. However, the average fluctuation for the POPC/chol systems is statistically different from the preceding three Specifically, p=0.0004, as determined from a 2-tailed t-test with one data set including the three POPC/chol systems (pure, lipids + p1, and lipids + p3) and the other data set including all other systems. The same conclusions hold for KA, although the statistical significance of the difference between POPC/chol and the other systems is smaller (p=0.016) because of compensating changes in A0. The KA for DM-lipids are close to experimental values of single component bilayers (Evans et al. 2013), while those for POPC/POPG and POPE/POPG are ~50 dyn/cm larger than those with c18:0/1. This difference is likely due to the c16:0 chain in PO-lipids. The addition of cholesterol greatly increases KA above that of PO bilayers free of cholesterol.
Peptide insertion into a lipid bilayer is typically accompanied by a change in the deuterium order parameters, SCD, of the carbons in the lipid acyl chains (Lagüe et al. 2005; Salnikov et al. 2009). Fig. 3 plots the ratio of SCD of the system with peptide to that of the bilayer alone. Both chains of 3:1 DMPC/DMPG have slightly and uniformly higher SCD, indicating overall increased order in the presence of the peptide; as shown in Fig. S2, however, this result is a balance of decreased order in the first shell and increased order further from the peptide. In PO-lipids, the sn-1 chain shows little or no increase in the SCD of carbons near the head groups, and a gradual decrease with lower carbons. The SCD for the sn-1 chain of POPE/POPG and POPC/chol are most perturbed by the peptide. The peptide is least inserted in POPE/POPG, so the SCD reflects the greater degree of disorder in packing beneath the peptide; i.e., the lipids in the first shell are especially perturbed (Fig S2). The change in SCD is also large for POPC/chol because this bilayer has the greatest thinning. The sn-2 chain of PO-lipids shows a dramatic decrease in SCD for all carbons after the double bond, while carbons closer to the head group show very little change in the presence of peptide. These differences in the SCD ratio between the sn-1 and sn-2 chains indicate that each chain responds differently to the peptide. In the unsaturated sn-2 chains, perturbation of the CD bond order is localized to bonds after the 9th carbon, while the increased disorder in the sn-1 chain is distributed further up the acyl chain.
Fig. 3.
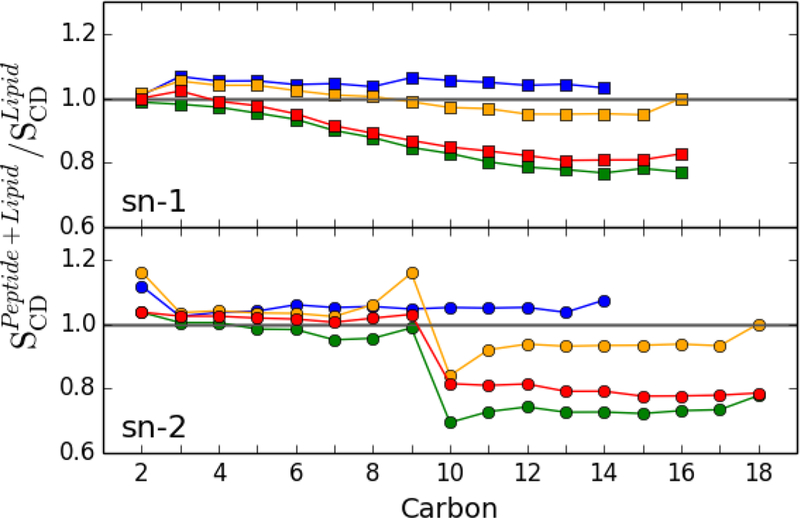
SCD (Peptide + Bilayer) / SCD (Bilayer Alone) for the sn-1 (top) and sn-2 (bottom) lipid acyl chains in the presence of p1. Marker color indicates membrane composition; 3:1 DMPC/DMPG (blue), 3:1 POPC/POPG (orange), 1:1 POPE/POPG (red), and 4:1 POPC/chol (green). All lipids are included in the average; see Fig. S2 for a breakdown into shells around the peptide
Snapshots of the first shell lipids (Fig. 4) illustrate packing of the acyl-chains around the peptide. In DMPC/DMPG, the peptide spans nearly the width of the leaflet. The lipid head groups and acyl chains in the same leaflet pack around the peptide, but do not have a significant volume below the peptide. This is also clear from the electron density plots, where acyl chain density (Fig. 2, gray) and CH3 density (Fig. 2, blue) at the midplane are similar for the peptide and pure bilayer. In contrast, PO- acyl chains wrap around the peptide to fill space between the peptide and midplane as reported previously (Lagüe et al. 2005) for the Influenza Hemagglutinin fusion peptide in POPC. In the electron density profiles of PO-containing lipids, the CH3 peak at the midplane broadens, and the general acyl chain peak increases as expected when the acyl chains wrap around the peptide. The methyl densities are shown for each leaflet in Fig. S3. The addition of peptide is accompanied by symmetric broadening of the methyl peaks and increased overlap between peaks from opposing leaflets. This indicates that wrapping acyl chains around the peptide is accompanied by increased interdigitation. Both actions contribute to the increased acyl chain disorder. There is no significant preference for either saturated or unsaturated chains to pack this space. Movies of this packing for the first 100 ns of all simulations are included in the SM. These movies include snapshots from the perspective of the midplane to head groups.
Fig. 4.
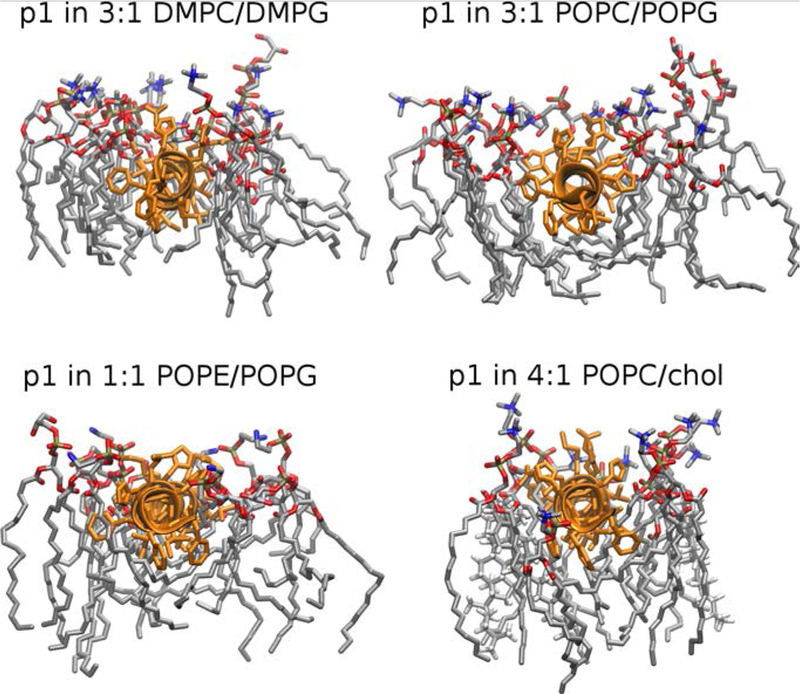
Snapshots of piscidin 1 in 3:1 DMPC/DMPG, 3:1 POPC/POPG 1:1 POPE/POPG, and 4:1 POPC/chol. Each snapshot is at 100 ns and includes all lipids within 10Å of residues 4 to 22 of the peptide. Lipids surrounding residues 1–3 were excluded for clarity.
Fig. 5 plots the depth of insertion versus bilayer thickness. The vertical lines represent the thickness of an unperturbed bilayer, while the markers represent the systems containing peptides. The horizontal shift from the line to the marker is the bilayer thinning (illustrated with arrows for p1). The thicker bilayers have the greatest thinning as indicated by the magnitude of the arrows. The depth of peptide insertion (y-axis) is greatest in 3:1 DMPC/DMPG, and similar among the other three membranes. This indicates that the depth of peptide insertion is dependent on acyl chain composition and not lipid head groups, for these systems.
Fig. 5.
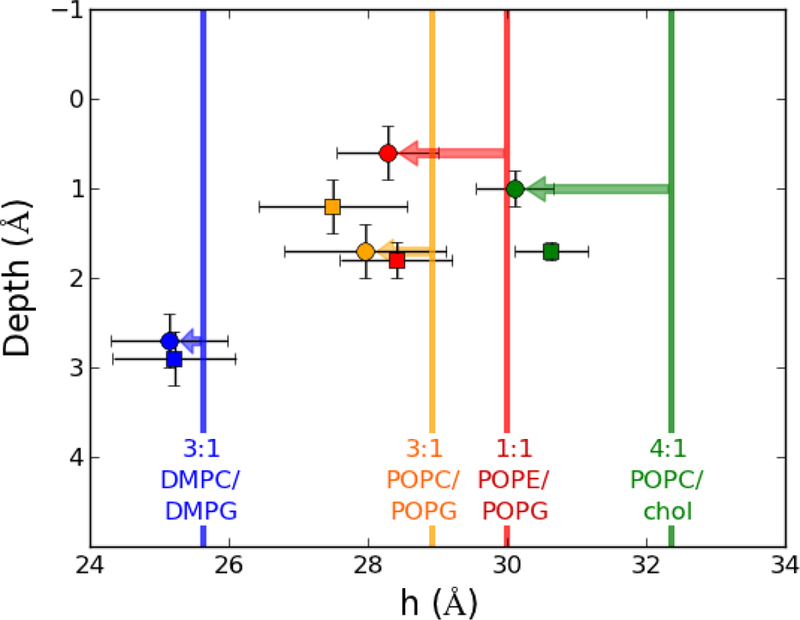
Peptide insertion (Depth) versus bilayer thickness. The thickness of bilayers without peptide (vertical lines), bilayers with p1 (squares), and bilayer with p3 (circles) are shown. Thinning of the bilayers is the distance between the marker and vertical line for the same membrane.
Pressure profiles of all systems contain three or four positive peaks and three to four troughs per leaflet (Fig. 2). The difference in pressure profiles between leaflets of the same system is a useful measure of the statistical error in the calculation because the leaflet pressures are relatively independent and equal. There are two notable changes to the pressure profiles of the pure bilayers upon addition of peptide. The first is a shift in peak positions along z, presumably due to thinning of the bilayer. This thinning roughly follows the inward change in the phosphate peaks in the electron density profiles. The second change is a decrease in the peak magnitudes (the tangential pressure). This second change is more complicated and dependent on packing of the lipids around the peptide. In particular, the decrease in lateral pressure at the midplane is proportional to the decrease in the CH3 density. There is also a decrease in the outer-most trough that may compensate for the decrease in the midplane peak, since the integral of the leaflet pressure must be zero. The values of derived from the pressure profiles are listed in Table 2 and plotted in the top panel of Fig. 6. Since each of the bilayers thinned with the addition of peptide, the symbols for pure bilayers are furthest to the right for each color. is lowest for DMPC/DMPG, and increases for the PO-membranes with POPC/POPG < POPC/chol < POPE/POPG. The preceding observations set the stage for the central result of this study: addition of peptide increases in DMPC/DOPG, and decreases in the PO-bilayers. The slopes in all PO- containing lipids are similar as are the changes for both p1 and p3. The results for the bending constant must be described before relating this observation to the induction of spontaneous curvature.
Fig. 6.
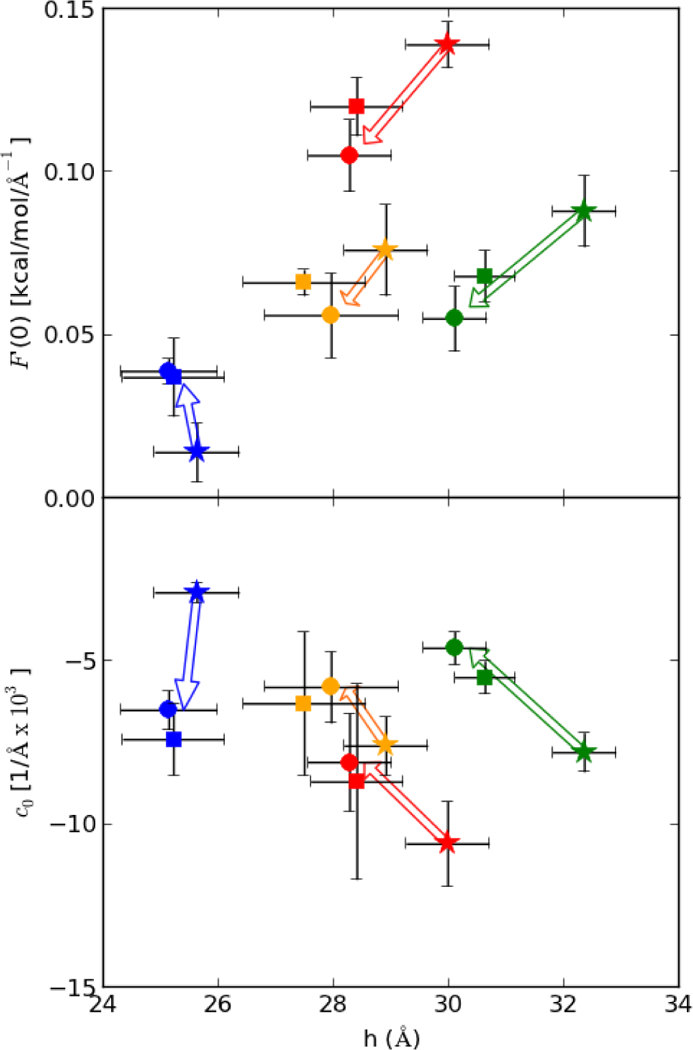
, the derivative of the free energy with respect to bending (top), and c0, spontaneous curvature versus bilayer thickness (bottom). Marker color indicates membrane composition; 3:1 DMPC/DMPG (blue), 3:1 POPC/POPG (orange), 1:1 POPE/POPG (red), and 4:1 POPC/chol (green). Marker shape indicates pure bilayers (star) and bilayer with the addition of the antimicrobial peptides piscidin 1 (circle) or piscidin 3 (square). Arrows indicate direction of properties with the addition of peptide.
Table 1 lists in joules for ease in comparing to the experimental literature. In DMPC/DMPG, agrees well with those by Evans and coworkers (Rawicz et al. 2000); however these values are about half those predicted by the shape analysis (Méléard et al. 1997). Experimentally derived values for PO- containing lipids are ~0.9 × 10⁻¹⁹ J (Rawicz et al. 2000), while the calculated values for POPC/POPG and POPE/POPG are 1.0 to 1.4 ×10⁻¹⁹ J. As discussed in the Theory section, kc may vary with experimental or computational method. The values calculated here are likely in the lower range of bilayer bending constants. In general, there is a small (statistically marginal) increase in when the peptide is bound. As the relationship in Eq. (4) indicates, the increase KA with peptide is balanced by a decrease in bilayer thickness. The monolayer bending moduli are listed in Table 2. Units are in kcal/mol for easy conversion of to c0. As evident in Table 2 and Fig. 6, the peptides induce negative curvature in DMPC/DMPG and positive curvature in the PO-containing bilayers. This trend would still hold if the kc values for DMPC/DMPG were closer to values from the shape analysis or if the same kc were used for all systems.
Curvature induction by a peptide was also calculated using the continuum elastic model (CEM) described in the Methods. Note that the result from the CEM is the change in the pressure profile upon addition an inclusion (modeled to represent p1) at a given depth from the surface (set equal to that from the simulation). Fig. 7 compares the CEM pressure profile (blue) and the difference profiles from the bilayer with and without p1 from the MD simulations (orange, solid). The MD profiles are complicated due to a combination of membrane thinning and long-range perturbations from the peptide, while the CEM profiles average over these differences. To demonstrate this, the dashed orange lines are the averages of the MD profiles over the z-range of the CEM peaks. This smoothed MD profile closely tracks that from the CEM, though the magnitudes are different. In both models, the main peaks have the smallest z-values for 3:1 DMPC/DMPG, while the main peak in 1:1 POPE/POPG and 4:1 POPC/chol have larger z-values. The change in curvature by the peptide Δc0 for the CEM can be calculated from these profiles using Eqs. (2) and (3).
Fig. 7.
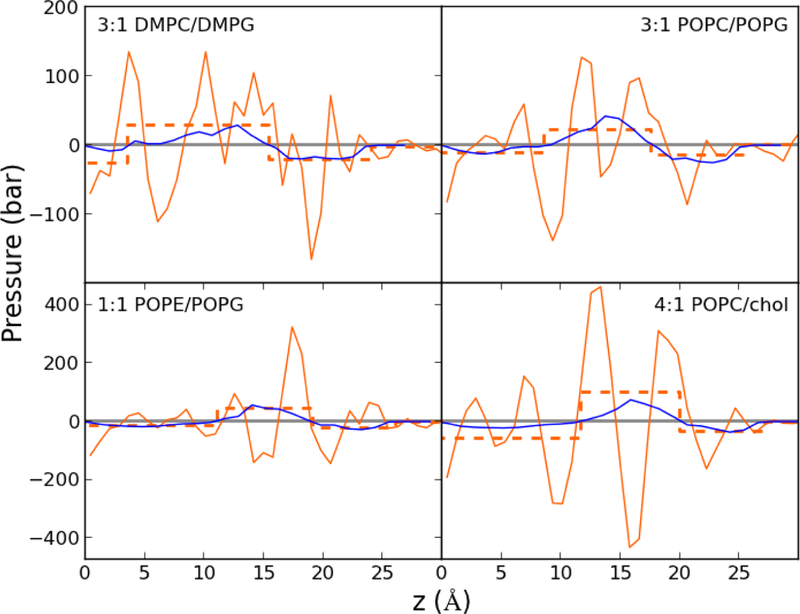
Change in pressure profiles from the continuum elastic model (blue) and MD simulation (orange); solid orange lines are the pointwise profiles, dashed are averages over the z-ranges of the peaks in the continuum elastic model profile
Fig. 8 compares the Δc0 from the CEM and from the MD. The MD values are calculated from for the peptide alone as,
| (6) |
where and indicate the pure bilayer and bilayer with peptide, respectively, and f is the fractional composition of the peptide, which is 13% for 4:1 POPC/chol and 11% for the other bilayers. Assuming that kc is independent of peptide (at concentrations of 1:40), for the pure systems are used in Eq. (6). is therefore independent of the peptide concentration, but is dependent of membrane composition. The trend in curvature induction by the CEM roughly follows that of the all-atom model. Both models yield negative curvature induction in the DMPC/DMPG bilayer, and positive curvature induction for POPE/POPG and POPC/chol, indicating that the peptide lies below the pivotal plane in DMPC/DMPG and above in the latter two. However, the CEM values are consistently smaller (~0.02 Å−1) than those from MD, and for DMPC/DMPG only half that of MD. Additionally, the CEM predicts a negative curvature induction for piscidin in 3:1 POPC/POPG, while that from MD is twice the magnitude and positive.
Fig. 8.
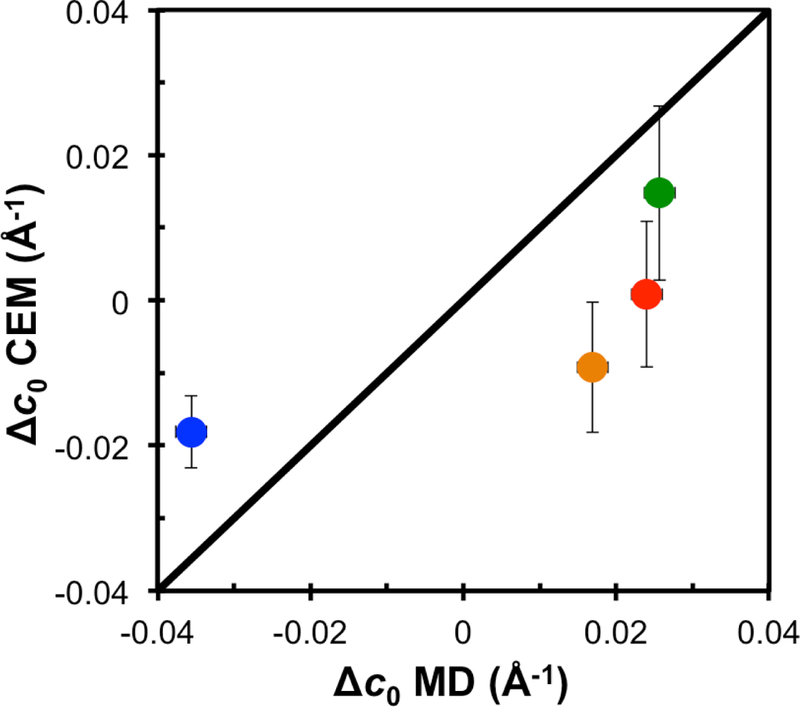
The change in curvature (Δc0) of the peptide in the membrane calculated from the all atom simulations versus curvature from the continuum elastic model (CEM). Marker color indicates membrane composition; 3:1 DMPC/DMPG (blue), 3:1 POPC/POPG (orange), 1:1 POPE/POPG (red), and 4:1 POPC/chol (green). Error in the MD values are ~0.002 Å−1, roughly the radius of the circle.
Discussion and Conclusions
The spontaneous curvature c0 for a monolayer is the curvature at which the free energy of curvature is zero according to Eq. (1). Therefore, it may be clearer to denote c0 as the intrinsic or preferred curvature and c-c0 as the curvature frustration. It is important to stress that all bilayers simulated here remain approximately flat and have zero total curvature. Simulating the bilayer alone, or inducing curvature by adding inclusions (peptides) frustrates the leaflets, but does not change the overall shape, which is enforced by periodic boundary conditions. Periodic boundary conditions also enforce a low effective concentration in each leaflet (though not a vanishingly small concentration in the bilayer because there is a peptide in the opposing leaflet). As shown in Fig 1, there is sufficient averaging in the 100–500 ns simulations to confidently evaluate relevant averages. However, it is possible that simulations of larger systems with more than one peptide per leaflet might show differences with those presented here if interactions among peptides are significant.
The induction of positive curvature with the addition of peptide to lipid membranes is well established (Hallock et al. 2003; Pujals et al. 2013; Sodt and Pastor 2014). Negatively-induced curvature is not as well known, although the effect was previously predicted with chain packing theory (Zemel et al. 2008) and the continuum modeling of Campelo et al. (2008). The induced-negative curvature occurs with both p1 and p3 in 3:1 DMPC/DMPG and is reproduced with the continuum model in this work. The latter indicates that the depth of peptide insertion relates to the curvature, as the peptides lie below the pivotal plane. Movies from the atomistic simulations of piscidin in DMPC/DMPG show very little acyl chain packing below the peptide. Conversely, a basket-like formation of acyl chains below the peptide is associated with induced positive curvature. The basket formation is characterized by an increase in hydrocarbon density at the midplane due to -CH2- replacing -CH3. Additionally, a decrease in the pressure peak at z=0 occurs for presumably the same reasons. Interpreting the decrease in lateral pressure as a beneficial enhancement in acyl chain entropy, this basket conformation may be a strategy to reduce membrane frustration.
The continuum elastic model reproduces the trend in curvature induction for the four bilayers discussed here; however it may not provide reliable results for a specific system of interest. For example, curvature induction for piscidin in 3:1 POPC/POPG for the CEM and MD simulation is opposite in sign. Several factors may be responsible for this difference. The CEM does not allow for the membrane to wrap below the peptide as was seen in the simulations. This prevents the CEM from thinning as much as the all-atom model. Lastly, intermolecular interactions are not explicitly modeled in the CEM, so the effects of hydrogen bonding or electrostatic interactions between the peptide and lipids can be missed.
In regards to the free energy of curvature F(c), the low of pure 3:1 DMPC/DMPG indicates that, with respect to curvature, it is a stable flat leaflet. The addition of a peptide significantly increases . According to the Helfrich model, this shifts the minimum of the energy away from c0 = 0 Å−1 (a flat leaflet). In contrast, the decrease in for flat PO-monolayers shifts the minimum of the free energy toward zero curvature. As a result, the flat monolayer becomes less frustrated. This decrease in frustration is accompanied by an increase in acyl chain disorder near midplane and a shift in the phosphate density toward the center of the bilayer.
The depth of insertion of the peptide in lipid bilayers is determined as a balance of at least two components. First, partitioning of the amphipathic peptide in the hydrophobic and hydrophilic regions of the bilayer satisfies hydrophobic matching. This includes extension of peptide side chains or kinking of the backbone to maximize the hydrophobicity and electrostatic interactions between the side chains and lipids. Second, acyl chains repack below the peptide to fill space between the peptide and midplane. This results in a decrease in the acyl chain order parameter of lipids near the peptide and bilayer thinning. If the acyl chains are unable to optimally pack to keep the peptide at the interface, the system can respond by lowering the peptide in the bilayer. In terms of peptide orientation, the results discussed here can only explain the frustration of the membrane for a peptide in the S state: the peptide increases frustration on a flat 3:1 DMPC/DMPG bilayer, while reducing frustration in flat 3:1 POPC/POPG, 1:1 POPE/POPG, or 4:1 POPC/chol bilayers.
To determine preference for the S state over the I state, well-characterized structures of both states are required. Here, the S state is reasonably characterized for amphipathic peptides, but the I state is not. Insertion of an amphipathic peptide into a stable inserted state requires cooperative interactions with other peptides, either by lining the inside of a pore or by thinning the bilayer to a preferred thickness. Characterization of I states will require simulations on significantly longer timescales or enhanced sampling with well-defined reaction coordinates. Nevertheless, the results presented here clearly demonstrate clearly that the interaction of antimicrobial peptides and lipid bilayers is highly dependent on lipid composition, and that the induction of spontaneous curvature can be modeled quantitatively with molecular dynamics simulation.
Supplementary Material
Acknowledgements
This research was supported in part by the Intramural Research Program of the NIH, National Heart, Lung and Blood Institute, and utilized the high-performance computational capabilities at the National Institutes of Health, Bethesda, MD (NHLBI LoBoS cluster).
References
- Brogden KA (2005) Antimicrobial peptides: pore formers or metabolic inhibitors in bacteria? Nat Rev Micro 3:238–250 [DOI] [PubMed] [Google Scholar]
- Brooks BR et al. (2009) CHARMM: The biomolecular simulation program. J Comput Chem 30:1545–1614 [DOI] [PMC free article] [PubMed] [Google Scholar]
- Campelo F, McMahon HT, Kozlov MM (2008) The hydrophobic insertion mechanism of membrane curvature generation by proteins. Biophys J 95:2325–2339 [DOI] [PMC free article] [PubMed] [Google Scholar]
- Canham PB (1970) The minimum energy of bending as a possible explanation of the biconcave shape of the human red blood cell. J Theor Biol 26:61–81 [DOI] [PubMed] [Google Scholar]
- Chen Z, Rand RP (1998) Comparative study of the effects of several n-alkanes on phospholipid hexagonal phases. Biophys J 74:944–952 [DOI] [PMC free article] [PubMed] [Google Scholar]
- Darden T, York D, Pedersen L (1993) Particle mesh Ewald: An N log(N) method for Ewald sums in large systems. J Chem Phys 98:10089–10092 [Google Scholar]
- Evans E, Rawicz W, Smith BA (2013) Back to the future: mechanics and thermodynamics of lipid biomembranes. Faraday Discuss 161:591–611 [DOI] [PubMed] [Google Scholar]
- Fuller N, Benatti CR, Peter Rand R (2003) Curvature and bending constants for phosphatidylserine-containing membranes. Biophys J 85:1667–1674 [DOI] [PMC free article] [PubMed] [Google Scholar]
- Fuller N, Rand RP (2001) The influence of lysolipids on the spontaneous curvature and bending elasticity of phospholipid membranes. Biophys J 81:243–254 [DOI] [PMC free article] [PubMed] [Google Scholar]
- Goetz R, Lipowsky R (1998) Computer simulations of bilayer membranes: Self-assembly and interfacial tension. J Chem Phys 108:7397–7409 [Google Scholar]
- Gruner SM, Parsegian VA, Rand RP (1986) Directly measured deformation energy of phospholipid HII hexagonal phases. Faraday Discuss 81:29–37 [DOI] [PubMed] [Google Scholar]
- Hallock KJ, Lee D-K, Ramamoorthy A (2003) MSI-78, an analogue of the magainin antimicrobial peptides, disrupts lipid bilayer structure via positive curvature strain. Biophys J 84:3052–3060 [DOI] [PMC free article] [PubMed] [Google Scholar]
- Helfrich W (1973) Elastic properties of lipid bilayers: theory and possible experiments. Z Naturforsch C 28:693–703 [DOI] [PubMed] [Google Scholar]
- Hoover WG (1985) Canonical dynamics: Equilibrium phase-space distributions. Phys Rev A 31:1695–1697 [DOI] [PubMed] [Google Scholar]
- Jo S, Kim T, Iyer VG, Im W (2008) CHARMM-GUI: A web-based graphical user interface for CHARMM. J Comput Chem 29:1859–1865 [DOI] [PubMed] [Google Scholar]
- Klauda JB et al. (2010) Update of the CHARMM all-atom additive force field for lipids: Validation on six lipid types. J Phys Chem B 114:7830–7843 [DOI] [PMC free article] [PubMed] [Google Scholar]
- Lagüe P, Roux B, Pastor RW (2005) Molecular dynamics simulations of the influenza hemagglutinin fusion peptide in micelles and bilayers: Conformational analysis of peptide and lipids. J Mol Biol 354:1129–1141 [DOI] [PubMed] [Google Scholar]
- Lindahl E, Edholm O (2000) Spatial and energetic-entropic decomposition of surface tension in lipid bilayers from molecular dynamics simulations. J Chem Phys 113:3882–3893 [Google Scholar]
- MacKerell AD et al. (1998) All-atom empirical potential for molecular modeling and dynamics studies of proteins. J Phys Chem B 102:3586–3616 [DOI] [PubMed] [Google Scholar]
- Méléard P et al. (1997) Bending elasticities of model membranes: influences of temperature and sterol content. Biophys J 72:2616–2629 [DOI] [PMC free article] [PubMed] [Google Scholar]
- Nagle JF (2013) Introductory Lecture: Basic quantities in model biomembranes. Faraday Discuss 161:11–29 [DOI] [PMC free article] [PubMed] [Google Scholar]
- Nagle JF, Tristram-Nagle S (2000) Structure of lipid bilayers. Biochimica et Biophysica Acta (BB A) - Reviews on Biomembranes 1469:159–195 [DOI] [PMC free article] [PubMed] [Google Scholar]
- Nose S (1984) A unifed formulation of the constant temperature molecular-dynamics methods. J Chem Phys 81:511–519 [Google Scholar]
- Perrin BS Jr et al. (2014) High-resolution structures and orientations of antimicrobial peptides piscidin 1 and piscidin 3 in fluid bilayers reveal tilting, kinking, and bilayer immersion. J Am Chem Soc 136:3491–3504 [DOI] [PMC free article] [PubMed] [Google Scholar]
- Pujals S et al. (2013) Curvature engineering: Positive membrane curvature induced by epsin N-terminal peptide boosts internalization of octaarginine. ACS Chem Biol 8:1894–1899 [DOI] [PubMed] [Google Scholar]
- Rand RP, Fuller NL, Gruner SM, Parsegian VA (1990) Membrane curvature, lipid segregation, and structural transitions for phospholipids under dual-solvent stress. Biochem 29:76–87 [DOI] [PubMed] [Google Scholar]
- Rawicz W, Olbrich KC, McIntosh T, Needham D, Evans E (2000) Effect of chain length and unsaturation on elasticity of lipid bilayers. Biophys J 79:328–339 [DOI] [PMC free article] [PubMed] [Google Scholar]
- Ryckaert JP, Ciccotti G, Berendsen HJC (1977) Numerical integration of the Cartesian equations of motion of a sysytem with constraints: Molecular dynamics of n-alkanes. J Comp Phys 23:327–341 [Google Scholar]
- Safran SA (1994) Statistical Thermodynamics of Surfaces, Interfaces, and Membranes. Westview Press, Boulder, CO [Google Scholar]
- Salnikov Evgeniy S, Bechinger B (2011) Lipid-controlled peptide topology and interactions in bilayers: Structural insights into the synergistic enhancement of the antimicrobial activities of PGLa and magainin 2. Biophys J 100:1473–1480 [DOI] [PMC free article] [PubMed] [Google Scholar]
- Salnikov ES, Mason AJ, Bechinger B, Salnikov ES, Mason AJ, Bechinger B (2009) Membrane order perturbation in the presence of antimicrobial peptides by H-2 solid-state NMR spectroscopy. Biochimie 91:734–743 [DOI] [PubMed] [Google Scholar]
- Sodt Alexander J, Pastor Richard W (2013) Bending free energy from simulation: Correspondence of planar and inverse hexagonal lipid phases. Biophys J 104:2202–2211 [DOI] [PMC free article] [PubMed] [Google Scholar]
- Sodt Alexander J, Pastor Richard W (2014) Molecular modeling of lipid membrane curvature induction by a peptide: More than simply shape. Biophys J 106:1958–1969 [DOI] [PMC free article] [PubMed] [Google Scholar]
- Sonne J, Hansen FY, Peters GH (2005) Methodological problems in pressure profile calculations for lipid bilayers. J Chem Phys 122:- [DOI] [PubMed] [Google Scholar]
- Strandberg E, Tiltak D, Ehni S, Wadhwani P, Ulrich AS (2012) Lipid shape is a key factor for membrane interactions of amphipathic helical peptides. Biochimica et Biophysica Acta (BBA) - Biomembranes 1818:1764–1776 [DOI] [PubMed] [Google Scholar]
- Strandberg E, Zerweck J, Wadhwani P, Ulrich Anne S (2013) Synergistic insertion of antimicrobial magainin-family peptides in membranes depends on the lipid spontaneous curvature. Biophys J 104:L9–L11 [DOI] [PMC free article] [PubMed] [Google Scholar]
- Szleifer I, Kramer D, Ben - Shaul A, Gelbart WM, Safran SA (1990) Molecular theory of curvature elasticity in surfactant films. J Chem Phys 92:6800–6817 [Google Scholar]
- Szule JA, Rand RP (2003) The effects of gramicidin on the structure of phospholipid assemblies. Biophys J 85:1702–1712 [DOI] [PMC free article] [PubMed] [Google Scholar]
- Venable RM, Luo Y, Gawrisch K, Roux B, Pastor RW (2013) Simulations of anionic lipid membranes: Development of interaction-specific ion parameters and validation using NMR data. J Phys Chem B 117:10183–10192 [DOI] [PMC free article] [PubMed] [Google Scholar]
- Venable RM et al. (2014) CHARMM all-atom additive force field for sphingomyelin: Elucidation of hydrogen bonding and of positive curvature. Biophys J 107:134–145 [DOI] [PMC free article] [PubMed] [Google Scholar]
- Watson MC, Brandt EG, Welch PM, Brown FLH (2012) Determining biomembrane bending rigidities from simulations of modest size. Phys Rev Lett 109:028102. [DOI] [PubMed] [Google Scholar]
- Wiesner J, Vilcinskas A (2010) Antimicrobial peptides: The ancient arm of the human immune system. Virulence 1:440–464 [DOI] [PubMed] [Google Scholar]
- Wimley WC (2010) Describing the mechanism of antimicrobial peptide action with the interfacial activity model. ACS Chem Biol 5:905–917 [DOI] [PMC free article] [PubMed] [Google Scholar]
- Zemel A, Ben-Shaul A, May S (2008) Modulation of the spontaneous curvature and bending rigidity of lipid membranes by interfacially adsorbed amphipathic peptides. J Phys Chem B 112:6988–6996 [DOI] [PubMed] [Google Scholar]
Associated Data
This section collects any data citations, data availability statements, or supplementary materials included in this article.