

Abstract
Objective:
To explore the ED contribution to prescription opioid use for opioid naïve patients by comparing the guideline concordance of ED prescriptions to those attributed to other settings and the risk of patients continuing to long term opioid use.
Methods:
Analysis of administrative claims data (OptumLabs™ Data Warehouse 2009–2015) of opioid naïve privately insured and Medicare Advantage (aged and disabled) beneficiaries to compare characteristics of opioid prescriptions attributed to the ED with those attributed to other settings. Concordance with CDC guidelines and rate of progression to long-term opioid use are reported.
Results:
We identified 5.2 million opioid fills that met inclusion criteria. Opioid prescriptions from the ED were more likely to adhere to CDC guidelines for dose, days supply, and formulation than those attributed to non-ED settings. Disabled Medicare beneficiaries were the most likely to progress to long-term use, with 13.4% of their fills resulting in long-term use, compared to 6.2% of aged Medicare and 1.8% of commercial beneficiaries’ fills. Compared to non-ED settings, commercial beneficiaries receiving opioid prescriptions in the ED were 46% less likely, aged Medicare 56% less likely, and disabled Medicare 58% less likely to progress to long-term opioid use.
Conclusion:
Compared to non-ED settings, opioid prescriptions provided to opioid naïve patients in the ED were more likely to align with CDC recommendations. They were shorter, written for lower daily doses, and less likely to be for long acting formulations. Prescriptions from the ED are associated with a lower risk of progression to long-term use.
Introduction
Background
Following a fourfold rise in opioid prescriptions since 1999, long-term opioid use has become major public health issues in the United States.1,2 Because opioids are frequently prescribed to patients dismissed from emergency departments (ED), it is important to understand the relationship between ED opioid prescribing for opioid naïve individuals and their risk of progressing to recurrent opioid use.3 Some policymakers and members of the public perceive EDs to be a significant source of overprescription of opioids.4–6 This perception may stem from the fact that many ED visits involve chronic or acute pain; adult patients reported pain as the primary symptom in 45% of ED visits.7 With so many patients in pain, it isn’t surprising that recent studies have found that 17-21% of all ED discharges included a prescription for opioids.4,8
Importance
Despite the public health consequences of nonmedical and long-term prescription opioid use,9–12 short-term use of these medications is clinically indicated in select settings.13,14 With some rare exceptions, health care professionals do not intend for an initial opioid prescription issued for an acute pain episode to result in indefinite repeat prescriptions.15 Unfortunately, a dearth of information exists about the progression of intended short-term use to an unintended prolonged pattern of use16,17 which may occur in 1.5% to 27% of opioid-naïve patients after receiving an initial prescription.18–25 This is critically important because intentional short-term use is emerging as a previously under-recognized segue to unintended prolonged opioid use.16–22,24–26 One of the 5 key questions proposed in the 2016 Centers for Disease Control and Prevention (CDC) guideline for prescribing opioids for chronic pain was to determine the effects of opioid therapy for acute pain on long-term opioid use.27 The goal of these guidelines is to improve opioid prescribing practices to ensure patients have access to safer treatment while reducing the risks of non-medical use and overdose.
Limited research has been conducted to date on prescribing practices for acute pain that limit risk of long-term opioid use. Current recommendations are to prescribe the lowest effective dose and quantity needed for the expected duration of pain. With new guidelines and ED clinicians facing the challenge of patients seeking help for uncontrolled pain, it is natural to ask whether and how prescribing in the ED compares with other settings. The guidelines were not published until after the study period; our goal in using their recommendations is not to determine the adherence rates to the CDC guidelines per se, but rather as a source of reasonable and evidence-based standards for comparing prescriptions attributed to different settings.
Goals of this investigation
We used administrative claims data to compare characteristics of opioid prescriptions written for opioid naïve patients dismissed from the ED and other settings and evaluated the risk of long-term use of prescription opioids by addressing these questions:
To what extent are opioid prescriptions issued to opioid-naïve patients in the ED or non-ED settings concordant with best practices on the number of days supplied, the daily dose of the prescription, and the number of prescriptions filled for long-acting or extended-release formulations?
For opioid naïve patients, what is the difference in the rate of progression to long-term opioid use after an initial prescription in the ED compared to a non-ED setting?
Methods
We adhered to the RECORD statement (REporting of studies Conducted using Observational Routinely-collected health Data).28
Study design and setting
We conducted an analysis of administrative claims data from 1/1/2009 through 12/31/2015 from the OptumLabs Data Warehouse (OLDW), a database comprised of privately insured and Medicare Advantage enrollees throughout the US; more than 35 million unique people had both medical and prescription drug coverage at some time during the study period.29 OLDW contains longitudinal health information on enrollees from geographically diverse regions across the US with the greatest representation from the Southern and Midwestern states.30 It includes adjudicated claims for all healthcare services incurred by beneficiaries and submitted to the insurance company for payment. The included plans provide coverage for professional, facility, laboratory, and pharmacy claims. Administrative data include beneficiary sex, race/ethnicity, age, and dates of coverage. Medical claims include International Classification of Diseases, 9th and 10th Revision procedure and diagnosis codes; Healthcare Common Procedure Coding System (HCPCS) procedure codes; site of service codes; and provider specialty codes.31 The commercial population covered by OLDW is similar to the United States population of commercially insured people in age, race/ethnicity, and gender. Further detail is provided in web appendices.
This study was determined to be exempt from review by the Mayo Clinic Institutional Review Board.
Selection of Included Prescription Fills
We identified opioid prescriptions filled between 1/1/2009 and 12/31/2015 by beneficiaries of all ages who had both medical and pharmacy coverage. In order to focus our attention on people for whom long-term opioid use is an important risk, we examined claims in the 3 months before each opioid fill and excluded prescription fills by beneficiaries who either had 1) any hospice claims, or 2) at least 2 physician visits with a cancer diagnosis in those 3 months. (See web appendices for codes used to identify cancer and hospice beneficiaries.)
We focused on opioid prescription fills among opioid-naïve beneficiaries, defined as having no opioid fills in the prior 6 months. As such, we excluded fills for beneficiaries with less than 6 months of insurance enrollment before the index fill and those who had any opioid fills during those 6 months. We limited our cohort to the first opioid-naïve fill for each beneficiary—the index fill. Our final cohort consists of 5.2 million index fills. A cohort flow chart is provided in Figure 1.
Figure 1:
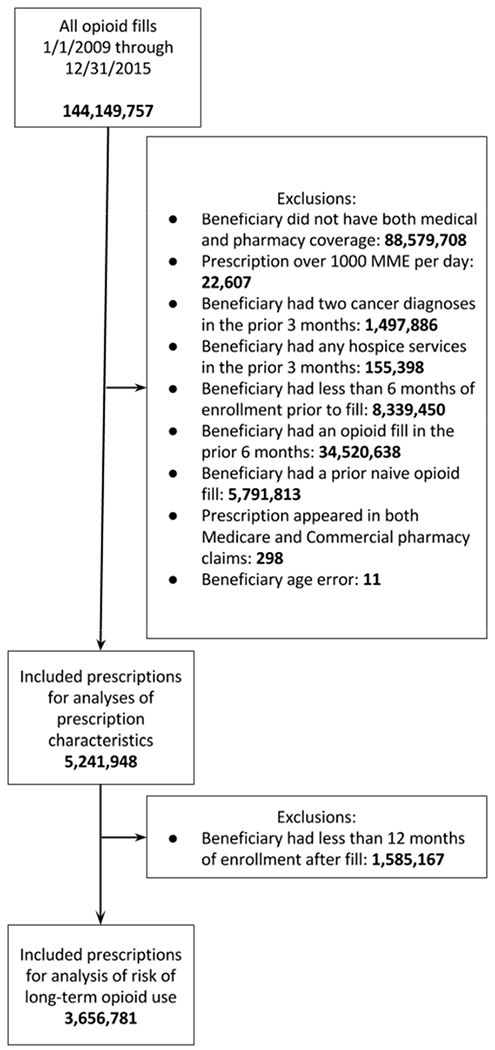
Cohort flow chart
Variables
Opioid fill:
We identified National Drug Codes for all opioids available during any part of the study period. For this study, we classified tramadol as an opioid. The complete list of medications classified as opioids for this study is provided in web appendices.
We used conversion factors provided by the CDC to convert the daily prescribed opioid dose to milligrams of morphine equivalents (MME).32 Prescriptions written for 1000 MME or more per day were excluded from the analysis (n=22,607; 0.04% of opioid fills by people with medical and prescription coverage) as extreme outliers.
If multiple doses of the same opioid were filled on the same day with the same prescriber ID, we merged those fills and calculated a combined daily dose in MME. In rare cases (N=56,845 beneficiaries and 114,507 opioid naïve fills) beneficiaries filled prescriptions for multiple different opioids or the same opioid with different prescribers on the same day. In these cases, each fill was included separately in the analysis. For this reason, the opioid fill is the unit of analysis rather than the beneficiary. Complete details are provided in web appendices.
Prescription source
We used information from medical claims in the 30 days prior to and including the date of the index fill to determine the most likely source of the prescription. Detailed information is provided in web appendices. We classified the most likely source of each index fill as 1) ED visit only; 2) non-ED visit only, which combines inpatient, outpatient, ambulatory surgery, and dental/accidental dental; 3) unknown source, which includes prescriptions where both ED and non-ED services were provided on the same day (4.3% of all prescriptions), as well as prescriptions for which there was no medical claim in the 30 days leading up to and including the prescription fill date. A substantial proportion of prescriptions had no visits in the prior 30 days: 22% for the Commercial population and 10% for the Medicare population; this rate is similar to study using a different source of commercial claims which found 28% of opioid fills unmatched with a look back period of 2 weeks.33 Some of these prescriptions were likely written by dentists, who have been estimated to write 6.4% of opioid prescriptions.34 We did not observe most dental visits, as dentistry is not included in medical insurance benefits. In our sample of fills to opioid-naïve patients, 7.0% of fills with a known prescriber specialty were written by a dentist or dental specialist. We present the results for prescriptions with unknown source throughout, but do not focus on the interpretation of this group of prescriptions.
All patients in the study were opioid naïve, with no insurance-paid opioid fills in the prior 6 months, which decreases the variability in the dose and duration of opioids that would be considered appropriate. It is likely that -regardless of the setting—people receiving a new opioid prescription with no prior recent fills were either experiencing acute pain or were experiencing an acute exacerbation of a chronic problem. Appropriate prescribing practices for acute pain or acute exacerbations of chronic problems are likely similar across settings.
Beneficiary characteristics
Administrative information was used to determine beneficiary age, race/ethnicity, sex, and type of insurance (commercial vs. Medicare). We used type of insurance and beneficiary age to identify 3 key patient populations: 1) commercially insured of all ages (Commercial), 2) people eligible for Medicare due to age (aged Medicare), and 3) people with Medicare coverage who were under age 65 but qualified for Medicare due to long-term disability, end-stage renal disease, or other serious conditions (disabled Medicare).
To assess patient illness burden, we used the Elixhauser comorbidity measures, a set of 31 measures indicating presence of comorbidities associated with increased risk of mortality.35 We used ICD9 and ICD10 codes to identify these comorbidities in the 6 months prior to the index fill.36 We required a diagnosis to be present on one inpatient stay or 2 separate outpatient visits. Each index fill was categorized with flags for the Elixhauser comorbidities and whether the beneficiary had any claims in the 6 months prior to the fill.
Outcomes
We assessed concordance with best practice in opioid prescribing as summarized in the CDC guidelines.27 One recommendation states that for acute pain, “Three days or less will often be sufficient; more than seven days will rarely be needed.” The number of days supplied was extracted from the pharmacy claim. We coded binary variables for prescriptions for more than 3 days and more than 7 days supplied.
Another recommendation states that physicians should write prescriptions for the lowest effective dose. For patients using opioids for chronic pain, the CDC urged caution if increasing doses to above 50 MME per day; doses above 90 MME per day were suggested to be appropriate only for pain specialists to prescribe. Binary variables indicated whether an index fill was written for more than 50 or more than 90 MME per day. As these would be exceptionally high doses for opioid-naïve patients, we expected to identify a small proportion of fills in this dose range.
A third recommendation from the guideline states that extended-release/long-acting opioids should not be used when starting opioid therapy. We anticipated prescriptions for extended-release and long-acting formulations would be rare in a cohort of opioid-naïve patients.
To determine the risk of long-term use of opioids, we examined opioid fills in the 12 months following the index fill. Long-term opioid use was defined using the Consortium to Study Opioid Risks and Trends (CONSORT) criteria: episodes of opioid prescribing lasting longer than 90 days and 120 or more total days’ supply or 10 or more prescriptions in the one year following the index fill.37 Only beneficiaries with at least 12 months of continuous enrollment after the index fill were included in this analysis. Because this analysis was performed on a different population than the analyses of guideline concordance (which was allowed to have less than 12 months of follow-up), we repeated all guideline concordance analyses using just the cohort with at least 12 months of follow-up. We found no difference in the results of these analyses. A full comparison of results is presented in web appendices.
Analysis
Distributions of demographic and fill characteristics were compared using χ2 goodness-of-fit tests, one-way ANOVA, and a Wald test for equality of coefficients after Poisson regression; see web appendices for further detail. We report 95% confidence intervals (CIs) for selected results in the text; all CIs are presented in tables or Appendices.
Logistic regression was used to measure the association between the source of the initial prescription and study outcomes. Prescription source (ED, non-ED, unknown) was interacted with beneficiary type (Commercial, aged Medicare, disabled Medicare) in the model. Covariates included year (continuous), age, age-squared, and age-cubed, female sex, race/ethnicity, indicators for each Elixhauser comorbidity, and whether the beneficiary had any medical claims in the 6 months before the fill. Complete results from logistic regression models are provided in web appendices. Adjusted probabilities of outcomes were calculated for each beneficiary type and prescription source. Risk ratios were generated from these probabilities, with 95% confidence intervals (CI) calculated using the delta method.38 Stata/MP version 14.2 was used for all analyses.39
We performed a supplementary analysis treating time as a categorical variable to allow estimation of time trends in the proportion of prescriptions concordant with guidelines. Results are described briefly in the text and presented in full in web appendices.
Results
We identified 5,241,948 naïve opioid fills that met inclusion criteria (Table 1). The rate of naïve opioid fills per person-year was similar across the three populations, with 0.07 naïve fills per person-year for the Commercial, 0.07 for the aged Medicare, and 0.06 for the disabled Medicare population (difference significant at P <0.0001, but a minor clinical difference). We report the total opioid fills per person-year (including both naïve and non-naïve fills, and including buprenorphine and methadone fills) for context. Though the rates of opioid naïve fills are similar across the three groups, the disabled Medicare population filled 7.15 total opioid prescriptions per person-year: 4 times more than the aged Medicare population and 8 times more than the Commercial population.
Table 1:
Characteristics of beneficiaries and opioid fills (unadjusted/crude rates)
| Commercial |
Aged Medicare |
Disabled Medicare |
||||
|---|---|---|---|---|---|---|
| Beneficiary/fill characteristic | Value | 95% CI | Value | 95% CI | Value | 95% CI |
| Beneficiary population | ||||||
| Total person-years of coverage (all OLDW beneficiaries with medical and prescription coverage) | 69,664,465 | 10,078,948 | 1,369,427 | |||
| Unique beneficiaries (all OLDW beneficiaries with medical and prescription coverage) | 31,840,382 | 3,679,349 | 590,329 | |||
| Unique beneficiaries with a naïve opioid fill | 4,447,662 | 655,667 | 80,982 | |||
| Opioid fills | ||||||
| Number of naïve opioid fills | 4,496,928 | 662,573 | 82,049 | |||
| Proportion of all naïve opioid fills | 85.8% | (85.8%,85.8%) | 12.6% | (12.6%,12.7%) | 1.6% | (1.6%,1.6%) |
| Naive opioid fills per covered person per year of insurance coverage | 0.07 | (0.07,0.07) | 0.07 | (0.07,0.07) | 0.06 | (0.06,0.06) |
| Total opioid fills per covered person per year of insurance coverage (naïve + non-na’ive fills) | 0.86 | (0.86,0.86) | 1.77 | (1.77,1.77) | 7.15 | (7.14,7.15) |
| Characteristics of beneficiaries with naïve opioid fills | ||||||
| Sex | ||||||
| Female | 52.7% | (52.6%,52.7%) | 57.2% | (57.0%,57.3%) | 51.2% | (50.9%,51.6%) |
| Age | ||||||
| Median (IQR) | 38 | (25 – 51) | 73 | (68 – 79) | 57 | (51 − 61) |
| Race/ethnicity | ||||||
| White | 71.9% | (71.9%,72.0%) | 74.7% | (74.6%,74.8%) | 64.6% | (64.3%,65.0%) |
| Hispanic | 10.6% | (10.5%,10.6%) | 6.9% | (6.8%,6.9%) | 9.4% | (9.2%,9.6%) |
| Black | 10.5% | (10.5%,10.5%) | 11.3% | (11.2%,11.3%) | 20.2% | (19.9%,20.4%) |
| Asian | 3.7% | (3.7%,3.7%) | 2.4% | (2.4%,2.5%) | 1.7% | (1.6%,1.8%) |
| Unknown | 3.3% | (3.3%,3.3%) | 4.8% | (4.7%,4.8%) | 4.1% | (4.0%,4.2%) |
| Prescription Source | ||||||
| ED | 13.3% | (13.3%,13.3%) | 11.7% | (11.6%,11.8%) | 17.4% | (17.1%,17.7%) |
| Not ED | 61.1% | (61.0%,61.1%) | 73.4% | (73.3%,73.6%) | 66.8% | (66.5%,67.1%) |
| Unknown | 25.6% | (25.6%,25.7%) | 14.9% | (14.8%,14.9%) | 15.8% | (15.6%,16.1%) |
| Insurance coverage after fill | ||||||
| Covered 3 mos after fill | 90.3% | (90.3%,90.3%) | 93.0% | (92.9%,93.0%) | 93.9% | (93.8%,94.1%) |
| Covered 6 mos after fill | 81.3% | (81.3%,81.4%) | 87.4% | (87.3%,87.4%) | 87.8% | (87.6%,88.1%) |
| Covered 12 mos after fill | 68.2% | (68.1%,68.2%) | 79.4% | (79.3%,79.5%) | 79.2% | (78.9%,79.5%) |
| Medical claims before fill | ||||||
| Had any claims in 3 mos before fill | 85.5% | (85.5%,85.6%) | 95.5% | (95.5%,95.6%) | 95.1% | (94.9%,95.2%) |
| Had any claims in 6 mos before fill | 90.6% | (90.6%,90.6%) | 97.5% | (97.5%,97.6%) | 97.2% | (97.1%,97.4%) |
| Elixhauser comorbidities, 6 months before fill | ||||||
| Mean number of comorbidities | 0.25 | (0.25,0.25) | 1.39 | (1.38,1.39) | 1.43 | (1.42,1.44) |
| Any comorbidity | 16.0% | (16.0%,16.0%) | 57.8% | (58.0%,58.0%) | 59.1% | (58.7%,59.4%) |
| Characteristics of naïve index opioid fills | ||||||
| Drug filled (5 most common; further detail in web appendices) | ||||||
| Hydrocodone SA | 58.9% | (58.9%,59.0%) | 49.2% | (49.1%,49.4%) | 49.7% | (49.3%,50.0%) |
| Oxycodone SA | 18.8% | (18.8%,18.8%) | 16.6% | (16.6%,16.7%) | 19.4% | (19.1%,19.7%) |
| Tramadol SA | 8.7% | (8.7%,8.7%) | 20.2% | (20.1%,20.3%) | 18.7% | (18.5%,19.0%) |
| Codeine | 9.8% | (9.8%,9.9%) | 8.6% | (8.5%,8.7%) | 7.2% | (7.0%,7.4%) |
| Propoxyphene | 2.3% | (2.3%,2.3%) | 2.4% | (2.4%,2.5%) | 2.0% | (1.9%,2.1%) |
| DEA class | ||||||
| Non-schedule II (short acting) | 73.0% | (72.9%,73.0%) | 71.5% | (71.4%,71.6%) | 69.5% | (69.1%,69.8%) |
| Schedule II (short acting) | 26.5% | (26.5%,26.5%) | 27.6% | (27.5%,27.8%) | 28.6% | (28.3%,28.9%) |
| Long acting (any schedule) | 0.5% | (0.5%,0.5%) | 0.9% | (0.8%,0.9%) | 1.9% | (1.8%,2.0%) |
| Dose and supply | ||||||
| Greater than 50 MME per day | 19.9% | (19.9%,19.9%) | 17.0% | (16.9%,17.1%) | 17.8% | (17.5%,18.0%) |
| Greater than 90 MME per day | 6.0% | (5.9%,6.0%) | 5.2% | (5.1%,5.2%) | 5.6% | (5.5%,5.8%) |
| Greater than 3 days supplied | 57.4% | (57.4%,57.5%) | 68.0% | (67.9%,68.1%) | 67.5% | (67.2%,67.8%) |
| Greater than 7 days supplied | 14.4% | (14.4%,14.4%) | 30.6% | (30.4%,30.7%) | 33.9% | (33.6%,34.3%) |
| Continued to chronic use | ||||||
| Chronic opioid use (>10 fills or 120 days supplied in 1 year) | 1.8% | (1.8%,1.8%) | 6.2% | (6.1%,6.3%) | 13.4% | (13.1%,13.6%) |
Notes See web appendices for details on calculation of confidence intervals.
Main Results
1. Prescription sources and drug prescribed
The proportion of prescriptions attributed to the ED was 11.7% in aged Medicare, 13.3% in Commercial, and 17.4% in the disabled Medicare population (Table 1). The most common medication prescribed for naïve fills across all treatment settings was hydrocodone (comprising 58.9% of Commercial fills, 49.2% aged Medicare and 49.7% disabled Medicare) (Table 1).
2. Guideline concordance
Guideline concordance of prescriptions is reported in Tables 1 and 2 and in Figure 2A-F. Unadjusted rates of guideline concordance by beneficiary population are reported in Table 1, adjusted rates of concordance by beneficiary population and treatment setting (ED, non-ED, unknown) in Table 2, and adjusted risk ratios in Figure 2A-F. A table of risk ratios with 95% CIs is provided in web appendices.
Table 2:
Regression adjusted outcomes: proportions
| Commercial |
Aged Medicare |
Disabled Medicare |
||||
|---|---|---|---|---|---|---|
| Outcome | Adjusted proportion | 95% CI | Adjusted proportion | 95% CI | Adjusted proportion | 95% CI |
| Prescription for more than 3 days supply | ||||||
| Non-ED | 65.9% | (65.9%,66.0%) | 74.6% | (74.4%,74.7%) | 76.8% | (76.4%,77.1%) |
| Unknown | 47.2% | (47.1%,47.3%) | 56.3% | (56.0%,56.6%) | 61.9% | (61.1%,62.7%) |
| ED | 37.0% | (36.9%,37.1%) | 41.6% | (41.3%,41.9%) | 36.7% | (36.0%,37.5%) |
| Prescription for more than 7 days supply | ||||||
| Non-ED | 19.1% | (19.0%,19.1%) | 36.7% | (36.5%,36.8%) | 42.5% | (42.1%,42.9%) |
| Unknown | 7.7% | (7.7%,7.8%) | 20.4% | (20.1%,20.7%) | 28.2% | (27.4%,28.9%) |
| ED | 3.1% | (3.1%,3.1%) | 4.5% | (4.3%,4.6%) | 3.9% | (3.6%,4.2%) |
| Prescription for more than 50 MME | ||||||
| Non-ED | 22.8% | (22.7%,22.8%) | 17.7% | (17.6%,17.8%) | 18.0% | (17.7%,18.3%) |
| Unknown | 17.0% | (16.9%,17.1%) | 16.4% | (16.1%,16.6%) | 19.3% | (18.6%,20.0%) |
| ED | 14.3% | (14.2%,14.3%) | 13.0% | (12.8%,13.2%) | 13.9% | (13.3%,14.5%) |
| Prescription for more than 90 MME | ||||||
| Non-ED | 7.2% | (7.2%,7.2%) | 5.5% | (5.4%,5.5%) | 5.8% | (5.6%,6.0%) |
| Unknown | 4.4% | (4.4%,4.5%) | 4.8% | (4.6%,4.9%) | 5.9% | (5.5%,6.3%) |
| ED | 3.3% | (3.3%,3.4%) | 3.7% | (3.5%,3.8%) | 3.3% | (3.0%,3.6%) |
| Prescription for Long acting/Extended release formulation | ||||||
| Non-ED | 0.5% | (0.5%,0.5%) | 0.9% | (0.9%,0.9%) | 1.7% | (1.6%,1.8%) |
| Unknown | 0.3% | (0.3%,0.3%) | 0.7% | (0.7%,0.8%) | 1.9% | (1.7%,2.1%) |
| ED | 0.0% | (0.0%,0.0%) | 0.1% | (0.1%,0.2%) | 0.2% | (0.1%,0.3%) |
| Progression to chronic use | ||||||
| Non-ED | 2.0% | (2.0%,2.0%) | 6.9% | (6.8%,7.0%) | 14.8% | (14.4%,15.1%) |
| Unknown | 1.3% | (1.2%,1.3%) | 4.8% | (4.7%,5.0%) | 13.3% | (12.6%,13.9%) |
| ED | 1.1% | (1.1%,1.1%) | 3.1% | (2.9%,3.2%) | 6.2% | (5.7%,6.6%) |
Adjusted proportions calculated after logistic regression that included beneficiary category (Commercial, aged Medicare, disabled Medicare); year of fill (continuous); beneficiary age, age-squared, age-cubed; indicators for each Elixhauser comorbidity and whether the beneficiary had any medical claims in the 6 months before the fill; female sex; and race/ethnicity
Figure 2: Risk ratios for outcomes by source of prescription.
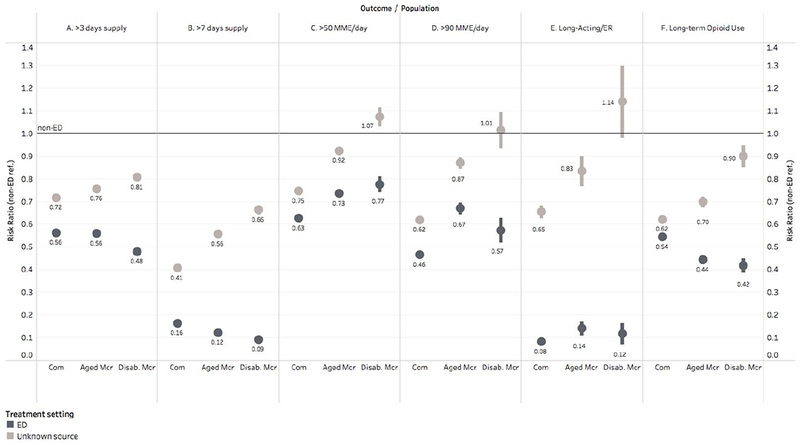
Risk ratios with non-ED prescription source as the reference category; bars indicate 95% confidence intervals. Com=commercial population; Mcr=Medicare; Disab.=Disabled; ER=Extended Release. Logistic regression with binary outcomes was performed with independent variables representing beneficiary characteristics: beneficiary category (Commercial, aged Medicare, disabled Medicare); year of fill (continuous); beneficiary age, age-squared, age-cubed; indicators for each Elixhauser comorbidity and whether the beneficiary had any medical claims in the 6 months before the fill; female sex; and race/ethnicity. Adjusted proportions meeting each outcome were calculated for each beneficiary group using Stata’s marginal effects commands. Risk ratios were calculated from these adjusted proportions, with 95% CIs calculated using Stata’s nlcom command, which uses the delta method to produce standard errors.
2.1. Days supplied
It was common for opioid naïve beneficiaries to fill prescriptions exceeding 3 days supply, with unadjusted proportions ranging from 57.4% among Commercial to 68.0% among disabled Medicare beneficiaries (Table 1). Prescriptions from non-ED settings were the most likely to exceed 3 days: 65.9% among Commercial beneficiaries, 74.6% for aged Medicare, and 76.8% for disabled Medicare (Table 2); regression adjusted). Prescriptions from the ED were 44% (Commercial: adjusted risk ratio 0.56 [0.56,0.56]) to 52% (disabled Medicare: adjusted risk ratio 0.48 [0.47,0.49]) less likely to exceed 3 days supply than those from non-ED settings (Figure 2-A).
Prescriptions from the ED were also less likely to exceed 7 days supply compared to non-ED prescriptions. In the ED, adjusted proportions of prescriptions exceeding 7 days were 84% to 91% lower than in the non-ED setting (adjusted risk ratio comparing ED to non-ED was 0.16 [0.16,0.16] in the Commercial population, 0.12 [0.12,0.13] in the aged Medicare population, and 0.09 [0.08,0.10] in the disabled Medicare population; adjusted percentages in Table 2, risk ratios in Figure 2-B).
2.2. Daily dose
Prescriptions for high MME doses were common; 17.0% to 19.9% exceeded 50 MME per day, and 5.2% to 6.0% exceeded 90 MME per day (unadjusted proportions; see Table 1 for details). Prescriptions from the ED were 23% to 37% less likely to exceed 50 MME (Figure 2-C; regression adjusted) and 33% to 54% less likely to exceed 90 MME than those attributed to non-ED settings (Figure 2-D; regression adjusted).
2.3. Long-acting/extended-release
Prescriptions for long-acting (LA) or extended-release(ER) formulations were rare among opioid naïve beneficiaries, with unadjusted percentages ranging from 0.5% of Commercial to 1.9% of disabled Medicare prescriptions.
In the regression-adjusted analysis, prescriptions from the ED were 86% to 92% less likely to be written for LA or ER formulations than those attributed to non-ED settings (risk ratios ranged from 0.08 [0.07,0.09] in the Commercial population to 0.14 [0.11,0.17] in the aged Medicare population; Figure 2-E).
3. Progression to long-term opioid use
In all beneficiary populations, prescriptions attributed to the ED were less likely to progress to long-term opioid use. For beneficiaries seen in the ED, 1.1% of Commercial beneficiaries, 3.1% of aged Medicare, and 6.2% of disabled Medicare progressed to long-term use (Table 2). Commercial beneficiaries seen in the ED were 46% (adjusted risk ratio 0.54 [0.53,0.56]) less likely to progress to long-term use than Commercial beneficiaries seen in non-ED settings. Aged Medicare beneficiaries were 56% (adjusted risk ratio 0.44 [0.42,0.46]) and disabled Medicare were 58% (adjusted risk ratio 0.42 [0.39,0.45]) less likely to progress to long-term use if receiving a prescription in the ED compared to non-ED settings (Figure 2-F).
To determine whether guideline concordant prescriptions were associated with a lower risk of progression to long-term use of opioids, we included a binary variable indicating whether the prescription met all guidelines in a regression of long-term use. Across nearly all care settings and beneficiary populations, a non-concordant prescription was associated with a greater risk of progression to long-term opioid use (adjusted risk ratios range from 1.09 [0.93,1.26] for disabled Medicare beneficiaries treated in the ED to 5.42 [4.79,6.05] for aged Medicare beneficiaries seen in unknown settings; full regression results in web appendices. All beneficiary/treatment setting comparisons showed statistically significant increases in risk except disabled Medicare/ED). See Table 3 for all risk ratios and confidence intervals.
Table 3:
risk ratios comparing risk of progression to long-term opioid use with non-concordant vs. fully concordant prescriptions
| Commercial |
Aged Medicare |
Disabled Medicare |
||||
|---|---|---|---|---|---|---|
| Risk of progression to long-term use | Risk ratio | 95% CI* | Risk ratio | 95% CI* | Risk ratio | 95% CI* |
| Non-concordant prescriptions Treatment setting | ref.: prescription fully guideline concordant (<=3 days and <=50 MME per day and not long acting) | |||||
| Non-ED | 3.75 | (3.61,3.89) | 4.42 | (4.18,4.66) | 4.28 | (3.79,4.77) |
| Unknown | 4.44 | (4.19,4.70) | 5.42 | (4.79,6.05) | 4.36 | (3.52,5.19) |
| ED | 1.24 | (1.16,1.32) | 1.30 | (1.18,1.42) | 1.09 | (0.93,1.26) |
Delta method standard errors
4. Time trends in risk of guideline concordance and long-term use
In every year of the study, across all three populations and all measures of guideline concordance, prescriptions attributed to the non-ED setting were more likely to exceed guideline limits than those attributed to the ED.
The proportion of prescriptions exceeding 3 days or 7 days and the proportion written for long-acting formulations were relatively stable over the years of the study. However, the proportion of prescriptions written for large doses decreased from 2009 to 2011. In prescriptions exceeding 50 MME, this decrease ranged from 20% to 50%, depending on the treatment setting and beneficiary population. See web appendices for full details. The proportion of prescriptions progressing to long-term opioid use fell over the study period in all beneficiary populations and treatment settings. The largest decrease in progression to long-term use was in the aged Medicare population seen in the ED, from 2.1% in 2009 to 1.2% in 2015 (−42%); the smallest decrease was in the Commercial population seen in non-ED settings, from 2.7% in 2009 to 2.4% in 2015 (−11%).
Limitations
A limitation of this study is the large number of prescriptions for which we were unable to assign a likely source. As noted, this issue has been found in a study using a different source of commercial claims.33 We estimate that about 7-10% of the prescriptions in this study were written by dentists, leaving 5-10% of the prescriptions unexplained. Further research is needed to understand whether some of these prescriptions may indicate problematic prescribing practices in which a physician writes a prescription without seeing the patient.
The data available in administrative claims does not allow us to attribute prescriptions to visits with complete certainty. Our method of attribution uses the information available to assign a most likely source of prescriptions.
This study is limited to prescription fills submitted for insurance payment and to a population of commercial and Medicare Advantage beneficiaries. We do not include the uninsured, or people with Medicaid or fee-for-service Medicare.
Given our study design, we were unable to evaluate whether the risk of long-term use was causally related to the prescription’s guideline concordance. Randomized controlled studies are unlikely to meet ethical guidelines for responsible research practice, given the weight of evidence on the risks of opioid use. The recent work of Barnett et al. suggests that observational studies of provider variability may be a source of quasi-random variation that could be used to study the impact of prescription characteristics on patient outcomes.19
The CDC guidelines had not been released during the period we studied. Therefore, this study should not be understood as measuring physician adherence to the CDC guidelines, but rather as measuring physician practice in reference to evidence guiding best practices in prescribing.
Discussion
Compared to non-ED settings, opioid prescriptions provided to opioid naïve patients in the ED were more likely to align with CDC recommendations for duration of these prescriptions for acute pain. More than 40% of prescriptions filled by disabled Medicare patients seen in non-ED settings exceeded 7 days supplied. In contrast, less than 5% of ED-attributed prescriptions exceeded 7 days in all three patient populations.
ED prescription durations in our study were similar to those in Weiner et al., which used Ohio Prescription Drug Monitoring Program data to study ED prescribing patterns from 2010 to 2014.40 Observations from this study showed similar rates of prescriptions exceeding 3 days to those found in the ED prescriptions in our study: 34% across their study period compared to 38% (Commercial), 42% (aged Medicare), and 37% (disabled Medicare) in our study.
We expected a small number of prescriptions in excess of 50 or 90 MME to be issued to opioid-naïve patients in any setting. These dose levels were selected by the CDC guideline writers as high doses for people with some degree of tolerance due to long-term opioid use. The high rates of prescriptions exceeding these levels were not anticipated. In non-ED settings, one in six prescriptions written for disabled Medicare patients and one in five for Commercial patients were for more than 50 MME per day. The rates of prescriptions for more than 90 MME per day ranged up to 7% in the Commercial population seen in non-ED settings. These high doses prescribed to people with no prior opioids in 6 or more months could be considered an indication that the individual had previously taken opioids for a similar condition at a similar high dose. However, this may not be a safe practice for the majority of patients due in part, to the rapid resolution of opioid tolerance.41,42
As expected, we found low overall rates of prescriptions for LA and ER opioids. However, more than 2 percent of prescriptions written for the disabled Medicare population were for these formulations. This is a safety concern for opioid naïve patients, as initiating opioid treatment with LA or ER formulations increases in the risk of overdose compared to immediate-release opioids.43
The rate of continued use seen in this Medicare Advantage population is higher than that reported by Barnett et al.19 who followed Medicare Fee-for-Service beneficiaries who were opioid naïve in the prior 6 months and received an opioid prescription in the ED. They found that 1.2% to 1.5% progressed to long-term use, defined as 180 days supplied in 12 months following the initial prescription, but excluding the 30 days after the prescription. More than 3 percent of our Medicare Advantage beneficiaries seen in the ED progressed to long-term use; however, our definition of long-term use was a lower bar than the Barnett definition: 120 days, rather than 180 days in the Barnett study, and we did not exclude the 30 days after the prescription.
Although we didn’t set out to compare guideline concordance across beneficiary populations, we found that the disabled Medicare population were more likely to receive prescriptions exceeding 3 days and 7 days, and were more likely to receive long-acting formulations compared to the aged Medicare and Commercial populations. Future investigations comparing these populations are needed.
In conclusion, opioid prescriptions attributed to the ED for opioid-naïve patients were more likely to adhere to best practices for opioid prescribing to opioid naïve patients compared to those attributed to non-ED settings. ED prescriptions were shorter in duration, written for lower doses, and less likely to be for LA or ER formulations. These prescriptions were followed by a lower risk of progression to long-term opioid use.
Across all treatment settings and patient populations, guideline concordance was associated with a lower risk of long-term use. Among opioid-naïve patients, greater guideline concordance in the ED may have been an important driver that helped mitigate the progression to long-term opioid use. Future research may explore why ED prescriptions for opioid naïve patients are more likely to be guideline concordant, with the hope of replicating that success in other settings where opioid naïve patients are treated.
Supplementary Material
References
- 1.Vital signs: overdoses of prescription opioid pain relievers---United States, 1999--2008. MMWR Morbidity and mortality weekly report 2011;60:1487–92. [PubMed] [Google Scholar]
- 2.Jones CM, Mack KA, Paulozzi LJ. Pharmaceutical overdose deaths, United States, 2010. Jama 2013;309:657–9. [DOI] [PubMed] [Google Scholar]
- 3.Hoppe JA, Kim H, Heard K. Association of emergency department opioid initiation with recurrent opioid use. Annals of emergency medicine 2015;65:493–9.e4. [DOI] [PubMed] [Google Scholar]
- 4.Kea B, Fu R, Lowe RA, Sun BC. Interpreting the National Hospital Ambulatory Medical Care Survey: United States Emergency Department Opioid Prescribing, 2006-2010. Academic emergency medicine : official journal of the Society for Academic Emergency Medicine 2016;23:159–65. [DOI] [PMC free article] [PubMed] [Google Scholar]
- 5.Emergency Physicians Use New Tool to Detect Drug-Seekers in the ER. American College of Emergency Physicians (ACEP), 2013. (Accessed 1/24/17, at http://newsroom.acep.org/2013-07-10-Emergency-Physicians-Use-New-Tool-to-Detect-Drug-Seekers-in-the-ER.) [Google Scholar]
- 6.Emergency Medicine’s Role in Prescription Opioid Abuse. 2015. at http://www.acepnow.com/article/emergency-medicines-role-in-prescription-opioid-abuse/.)
- 7.Chang HY, Daubresse M, Kruszewski SP, Alexander GC. Prevalence and treatment of pain in EDs in the United States, 2000 to 2010. The American journal of emergency medicine 2014;32:421–31. [DOI] [PubMed] [Google Scholar]
- 8.Hoppe JA, Nelson LS, Perrone J, Weiner SG. Opioid Prescribing in a Cross Section of US Emergency Departments. Annals of emergency medicine 2015;66:253–9.e1. [DOI] [PMC free article] [PubMed] [Google Scholar]
- 9.Chou R, Turner JA, Devine EB, et al. The effectiveness and risks of long-term opioid therapy for chronic pain: a systematic review for a National Institutes of Health Pathways to Prevention Workshop. Annals of internal medicine 2015;162:276–86. [DOI] [PubMed] [Google Scholar]
- 10.Goldenberg DL, Clauw DJ, Palmer RE, Clair AG. Opioid Use in Fibromyalgia: A Cautionary Tale. Mayo Clinic proceedings 2016;91:640–8. [DOI] [PubMed] [Google Scholar]
- 11.Schuchat A, Houry D, Guy GP Jr., New Data on Opioid Use and Prescribing in the United States. Jama 2017;318:425–6. [DOI] [PMC free article] [PubMed] [Google Scholar]
- 12.Califf RM, Woodcock J, Ostroff S. A Proactive Response to Prescription Opioid Abuse. The New England journal of medicine 2016;374:1480–5. [DOI] [PubMed] [Google Scholar]
- 13.Lovich-Sapola J, Smith CE, Brandt CP. Postoperative pain control. The Surgical clinics of North America 2015;95:301–18. [DOI] [PubMed] [Google Scholar]
- 14.Hegmann KT, Weiss MS, Bowden K, et al. ACOEM practice guidelines: opioids for treatment of acute, subacute, chronic, and postoperative pain. Journal of occupational and environmental medicine 2014;56:e143–59. [DOI] [PubMed] [Google Scholar]
- 15.Waljee JF, Li L, Brummett CM, Englesbe MJ. Iatrogenic Opioid Dependence in the United States: Are Surgeons the Gatekeepers? Annals of surgery 2016. [DOI] [PubMed] [Google Scholar]
- 16.Callinan CE, Neuman MD, Lacy KE, Gabison C, Ashburn MA. The Initiation of Chronic Opioids: A Survey of Chronic Pain Patients. The journal of pain : official journal of the American Pain Society 2017;18:360–5. [DOI] [PubMed] [Google Scholar]
- 17.Stumbo SP, Yarborough BJ, McCarty D, Weisner C, Green CA. Patient-reported pathways to opioid use disorders and pain-related barriers to treatment engagement. Journal of substance abuse treatment 2017;73:47–54. [DOI] [PMC free article] [PubMed] [Google Scholar]
- 18.Alam A, Gomes T, Zheng H, Mamdani MM, Juurlink DN, Bell CM. Long-term analgesic use after low-risk surgery: a retrospective cohort study. Archives of internal medicine 2012;172:425–30. [DOI] [PubMed] [Google Scholar]
- 19.Barnett ML, Olenski AR, Jena AB. Opioid-Prescribing Patterns of Emergency Physicians and Risk of Long-Term Use. The New England journal of medicine 2017;376:663–73. [DOI] [PMC free article] [PubMed] [Google Scholar]
- 20.Brummett CM, Waljee JF, Goesling J, et al. New Persistent Opioid Use After Minor and Major Surgical Procedures in US Adults. JAMA surgery 2017:e170504. [DOI] [PMC free article] [PubMed] [Google Scholar]
- 21.Clarke H, Soneji N, Ko DT, Yun L, Wijeysundera DN. Rates and risk factors for prolonged opioid use after major surgery: population based cohort study. BMJ (Clinical research ed) 2014;348:g1251. [DOI] [PMC free article] [PubMed] [Google Scholar]
- 22.Deyo RA, Hallvik SE, Hildebran C, et al. Association Between Initial Opioid Prescribing Patterns and Subsequent Long-Term Use Among Opioid-Naive Patients: A Statewide Retrospective Cohort Study. Journal of general internal medicine 2017;32:21–7. [DOI] [PMC free article] [PubMed] [Google Scholar]
- 23.Johnson SP, Chung KC, Zhong L, et al. Risk of Prolonged Opioid Use Among Opioid-Naive Patients Following Common Hand Surgery Procedures. The Journal of hand surgery 2016. [DOI] [PubMed] [Google Scholar]
- 24.Shah A, Hayes CJ, Martin BC. Characteristics of Initial Prescription Episodes and Likelihood of Long-Term Opioid Use - United States, 2006-2015. MMWR Morbidity and mortality weekly report 2017;66:265–9. [DOI] [PMC free article] [PubMed] [Google Scholar]
- 25.Sun EC, Darnall BD, Baker LC, Mackey S. Incidence of and Risk Factors for Chronic Opioid Use Among Opioid-Naive Patients in the Postoperative Period. JAMA internal medicine 2016;176:1286–93. [DOI] [PMC free article] [PubMed] [Google Scholar]
- 26.Hooten WM, St Sauver JL, McGree ME, Jacobson DJ, Warner DO. Incidence and Risk Factors for Progression From Short-term to Episodic or Long-term Opioid Prescribing: A Population-Based Study. Mayo Clinic proceedings 2015;90:850–6. [DOI] [PMC free article] [PubMed] [Google Scholar]
- 27.Dowell D, Haegerich TM, Chou R. CDC Guideline for Prescribing Opioids for Chronic Pain - United States, 2016. Mmwr Recommendations and Reports 2016;65:1–49. [DOI] [PubMed] [Google Scholar]
- 28.Benchimol EI, Smeeth L, Guttmann A, et al. The REporting of studies Conducted using Observational Routinely-collected health Data (RECORD) statement. PLoS medicine 2015;12:e1001885. [DOI] [PMC free article] [PubMed] [Google Scholar]
- 29.Wallace PJ, Shah ND, Dennen T, Bleicher PA, Crown WH. Optum Labs: building a novel node in the learning health care system. Health affairs (Project Hope) 2014;33:1187–94. [DOI] [PubMed] [Google Scholar]
- 30.Real world health care experiences from over 150 million unique individuals since 1993. Optum, 2015. (Accessed 6/6/2017, at https://www.optum.com/content/dam/optum/resources/productSheets/5302_Data_Assets_Chart_Sheet_ISPOR.pdf.) [Google Scholar]
- 31.Bellolio MF, Sangaralingham LR, Schilz SR, et al. Observation Status or Inpatient Admission: Impact of Patient Disposition on Outcomes and Utilization Among Emergency Department Patients With Chest Pain. Academic emergency medicine : official journal of the Society for Academic Emergency Medicine 2017;24:152–60. [DOI] [PubMed] [Google Scholar]
- 32.CDC compilation of opioid analgesic formulations with morphine milligram equivalent conversion factors, 2015 version. Centers for Disease Control and Prevention, 2015. at http://www.pdmpassist.org/pdf/BJA_performance_measure_aid_MME_conversion.pdf.) [Google Scholar]
- 33.Liu Y, Logan JE, Paulozzi LJ, Zhang K, Jones CM. Potential misuse and inappropriate prescription practices involving opioid analgesics. The American journal of managed care 2013;19:648–65. [PubMed] [Google Scholar]
- 34.Levy B, Paulozzi L, Mack KA, Jones CM. Trends in Opioid Analgesic-Prescribing Rates by Specialty, U.S., 2007-2012. American journal of preventive medicine 2015;49:409–13. [DOI] [PMC free article] [PubMed] [Google Scholar]
- 35.Elixhauser A, Steiner C, Harris DR, Coffey RM. Comorbidity measures for use with administrative data. Medical care 1998;36:8–27. [DOI] [PubMed] [Google Scholar]
- 36.Quan H, Sundararajan V, Halfon P, et al. Coding algorithms for defining comorbidities in ICD-9-CM and ICD-10 administrative data. Medical care 2005;43:1130–9. [DOI] [PubMed] [Google Scholar]
- 37.Von Korff M, Saunders K, Thomas Ray G, et al. De facto long-term opioid therapy for noncancer pain. The Clinical journal of pain 2008;24:521–7. [DOI] [PMC free article] [PubMed] [Google Scholar]
- 38.Dowd BE, Greene WH, Norton EC. Computation of standard errors. Health services research 2014;49:731–50. [DOI] [PMC free article] [PubMed] [Google Scholar]
- 39.StataCorp. Stata: Release 14. College Station, TX: StataCorp LLC; 2015. [Google Scholar]
- 40.Weiner SG, Baker O, Rodgers AF, et al. Opioid Prescriptions by Specialty in Ohio, 2010-2014. Pain medicine (Malden, Mass) 2017. [DOI] [PubMed] [Google Scholar]
- 41.Strang J, McCambridge J, Best D, et al. Loss of tolerance and overdose mortality after inpatient opiate detoxification: follow up study. BMJ (Clinical research ed) 2003;326:959–60. [DOI] [PMC free article] [PubMed] [Google Scholar]
- 42.White JM, Irvine RJ. Mechanisms of fatal opioid overdose. Addiction (Abingdon, England) 1999;94:961–72. [PubMed] [Google Scholar]
- 43.Miller M, Barber CW, Leatherman S, et al. Prescription opioid duration of action and the risk of unintentional overdose among patients receiving opioid therapy. JAMA internal medicine 2015;175:608–15. [DOI] [PubMed] [Google Scholar]
Associated Data
This section collects any data citations, data availability statements, or supplementary materials included in this article.