Abstract
Basal cell carcinoma (BCC) is the most frequent cancer in humans and results from constitutive activation of the Hedgehog pathway1. Several Smoothened inhibitors (Smoi) are used to treat Hedgehog-mediated malignancies, including BCC and medulloblastoma2. Vismodegib, a Smoi, leads to BCC shrinkage in the majority of the BCC patients3, but the mechanism by which it mediates BCC regression is currently unknown. Here, we used two different genetically engineered mouse models4 to investigate the mechanisms by which Smoi mediates tumor regression. We found that vismodegib mediates BCCs regression by inhibiting hair follicle-like fate and promoting the differentiation of tumour cells (TCs). However, a small population of TCs persists and is responsible for tumour relapse following treatment discontinuation, mimicking the situation found in humans5. In both mouse and human BCC, this persisting slow-cycling tumour population expresses Lgr5 and is characterised by active Wnt signalling. Lgr5 lineage ablation or Wnt signalling inhibition together with vismodegib leads to BCC eradication. Our study reveals that vismodegib induces tumour regression by promoting tumour differentiation, and demonstrates that the synergy between Wnt and Smoothened inhibitors constitutes a clinically relevant strategy to overcome tumour relapse in BCC.
Vismodegib/GDC0449 is the first Smoi approved for the treatment of locally advanced and metastatic BCCs. A small fraction of patients does not respond to vismodegib administration: their tumours continue to grow and do not show inhibition of the Hedgehog (HH) signalling pathway during vismodegib treatment3. This type of vismodegib resistance is frequently associated with genetic mutations rendering vismodegib unable to inhibit the HH pathway6,7. Most patients treated with vismodegib experience clinical benefits3. However, many patients only partially respond: their tumours initially regress under therapy, and relapse after vismodegib discontinuation3,5. The mechanisms by which vismodegib induces tumour regression and underlying the non-genetic resistance to vismodegib therapy are unknown.
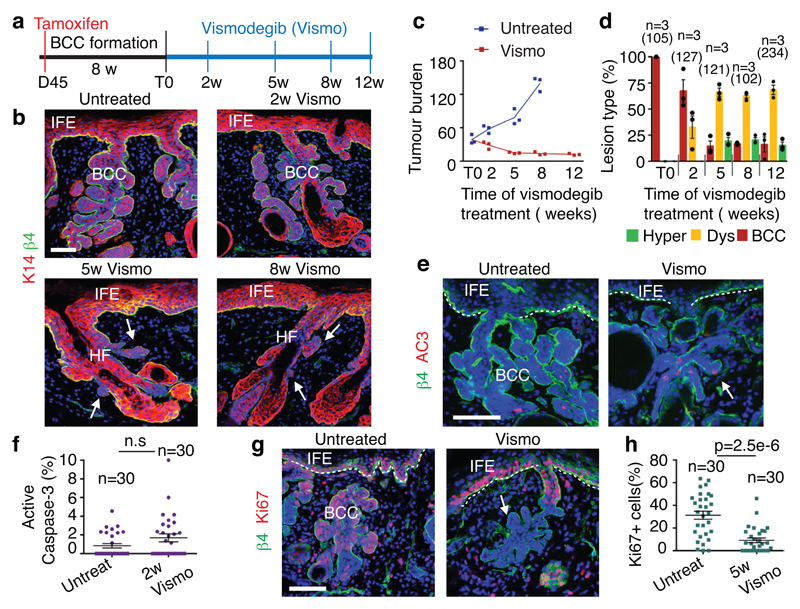
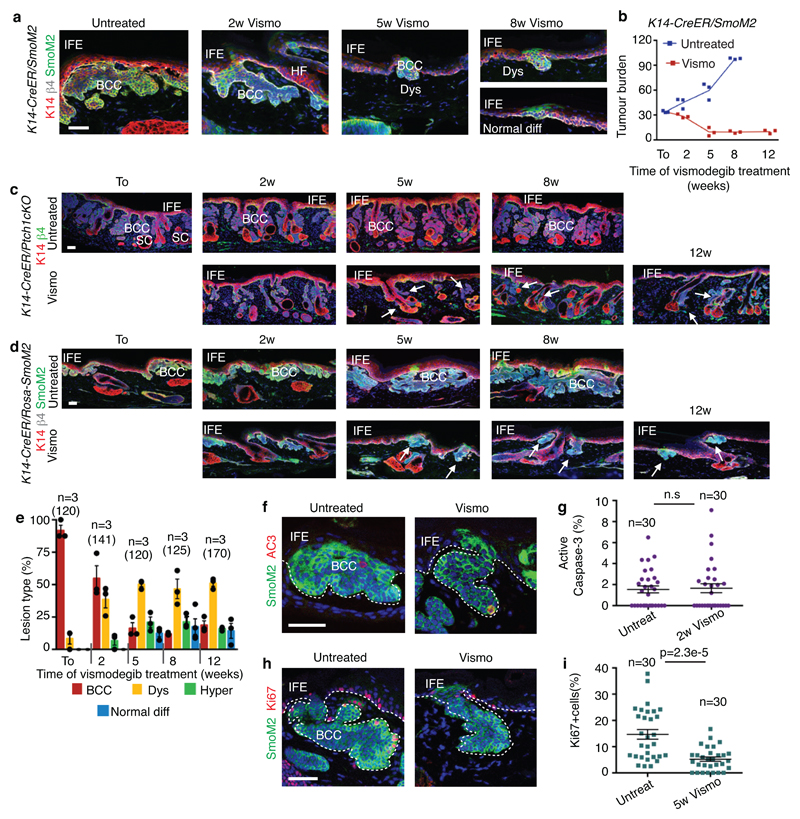
To study the mechanisms by which vismodegib leads to BCC regression, we induced BCC in mice by deleting Patched1 (Ptch1) or overexpressing the constitutive active form of Smo (SmoM2) in the epidermis using K14-CreER 8,9. Ptch1cKO-induced BCC arise mainly from the upper hair follicle (infundibulum) whereas SmoM2-induced BCCs originate from the interfollicular epidermis (IFE)4,8. Eight weeks after tamoxifen administration, mice showing fully formed BCCs were treated daily with vismodegib and analysed at different time points (Fig. 1a). A decrease in tumour burden was observed during the first 5 weeks of vismodegib treatment followed by the stabilization of the tumour size from 5 to 12 weeks, together with the appearance of vismodegib-persistent lesions (Fig1.b-c and Extended Data Fig. 1a-d). Vismodegib administration led to the conversion of the BCCs into pre-neoplastic lesions (hyperplasia and dysplasia), which persisted as drug-tolerant lesions (Fig. 1d and Extended Data Fig.1e). These results reveal that vismodegib induces tumour shrinkage and the progressive appearance of drug-tolerant lesions.
Fig. 1. Slow-cycling TCs persist following vismodegib treatment in mouse BCCs.
(a) Protocol for tumour induction and vismodegib administration. (b) Immunostaining for K14 and β4-integrin in ventral skin from Ptch1cKO mice. (c) (c) Tumour burden (total area occupied by tumours divided by the length of the analysed epidermis) in untreated and vismodegib-treated mice (n=3 mice analysed per time point and condition). Centre values define the mean. See Source Data. (d) Quantification of the lesion type upon vismodegib treatment (n= 3 mice, total number of lesions analysed per time point indicated in parenthesis). Histograms represent the mean and error bars the s.e.m. (e) Immunostaining for active caspase-3 (AC3) and β4-integrin. (f) Percentage of AC3+ TCs in untreated and vismodegib-treated mice (n=30 lesions analysed from 3 mice). Mean +/- s.e.m. Two-sided t-test. (g) Immunostaining for Ki67 and β4-integrin. (h) Percentage of Ki67+ TCs in untreated and vismodegib-treated mice (n=30 lesions analysed from 3 mice). Mean +/- s.e.m. Two-sided t-test. Ptch1cKO mice (b-h).Hoechst nuclear staining in blue; scale bars, 50μm. IFE: interfollicular epidermis, BCC: basal cell carcinoma, HF: hair follicle, Dys: dysplasia. Dashed line delineates basal lamina. Arrows indicate vismodegib-persistent lesions.
Active caspase-3 staining performed at 2 weeks following vismodegib administration showed a similar number of apoptotic cells in treated and untreated conditions (Fig. 1e-f and Extended Data Fig. 1f-g), indicating that apoptosis is not the main mechanism by which vismodegib induces BCC regression. As quiescence has been described as a mechanism of cancer resistance to therapy10, we assessed the proportion of Ki67-positive TCs and observed a strong decrease in the proportion of proliferative cells in persistent lesions (Fig. 1g-h and Extended Data Fig. 1h-i), suggesting that quiescence contributes to the emergence of drug-tolerant cells.
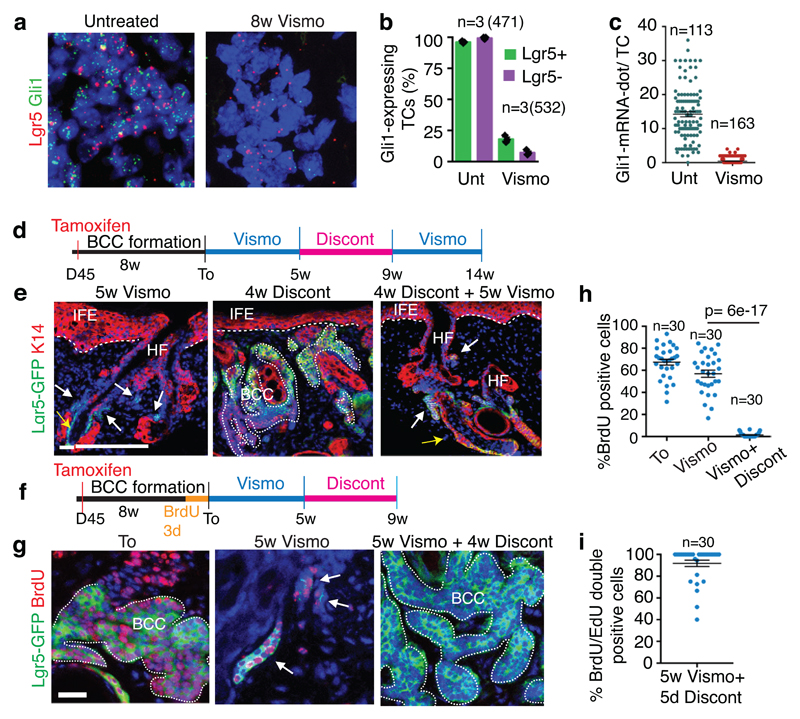
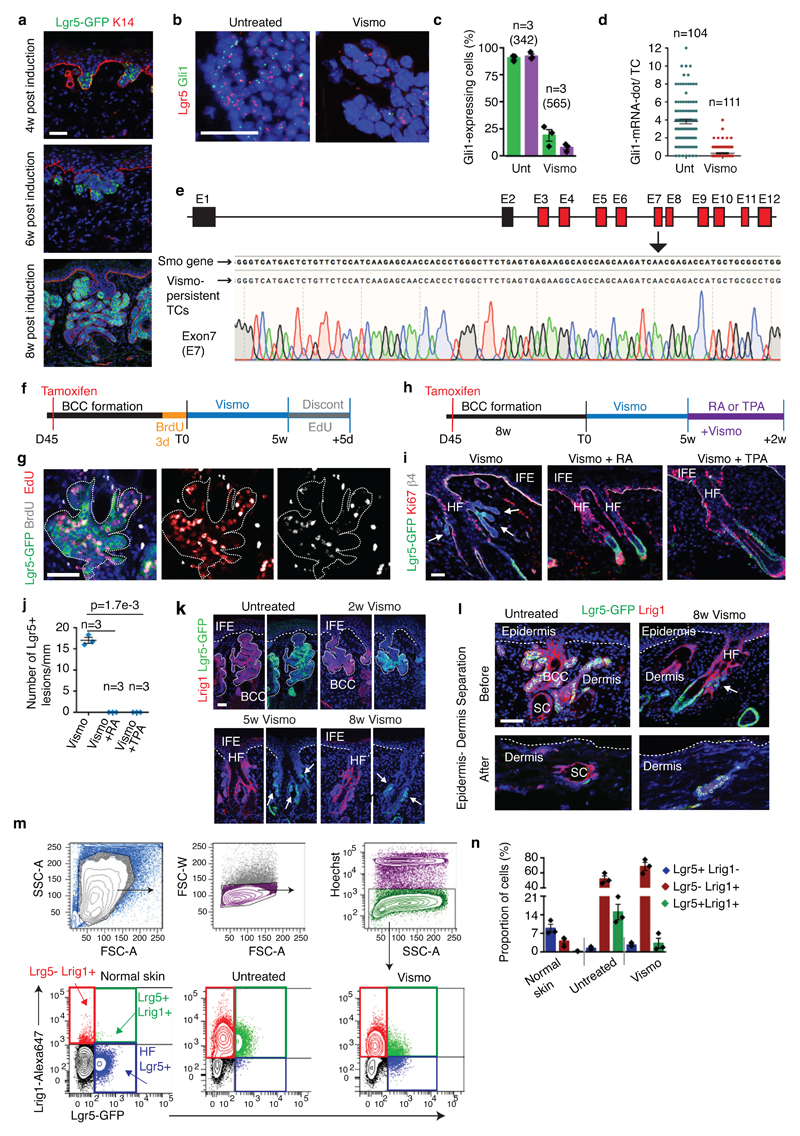
Lgr5 is expressed by different epithelial stem cells (SCs) including HFSCs11 and is upregulated during BCC initiation9 (Extended Data Fig.2a). In situ hybridization (ISH) revealed that Lgr5 is highly expressed in untreated BCCs and its expression persisted although at lower level in vismodegib-tolerant lesions (Fig. 2a and Extended Data Fig. 2b)
Fig. 2. Slow-cycling Lgr5+ LRCs mediate tumour relapse following vismodegib discontinuation.
(a) In situ hybridization for Lgr5 and Gli1 in untreated and treated Ptch1cKO-induced BCCs. (b) Percentage of TCs (Lgr5+ and Lgr5-) that express Gli1 (n=3 Ptch1cKO mice, total number of cells analysed indicated in parenthesis). Mean +/- s.e.m. (c) Distribution of the number of Gli1-mRNA dot per TC with and without treatment (n=113 and 163 total TCs from 3 mouse per condition and time point). Mean +/- s.e.m. (d) Protocol for vismodegib administration, discontinuation and re-administration (e) Immunostaining for Lgr5-DTR-GFP (Lgr5-GFP) and Keratin-14 (K14) in Ptch1cKO ventral skin following vismodegib treatment, discontinuation and vismodegib re-administration. 3 independent experiments per condition were analysed showing similar results.(f) Protocol for BrdU pulse chase label retention studies followed by vismodegib administration and discontinuation. (g) Immunostaining for Lgr5-GFP and BrdU following BrdU administration and upon BrdU chase in Ptch1cKO-induced BCCs. (h-i) Proportion of Lgr5+LRCs at T0, after vismodegib treatment and discontinuation (h) and BrdU/EdU double positive TCs 5 days after vismodegib discontinuation (i) in Ptch1cKO/Lgr5-DTR-GFP-derived BCCs (n=30 lesions analysed from 3 mice per condition in h and i). Mean +/- s.e.m. Two-sided t-test. Hoechst nuclear staining in blue; scale bars, 25 μm. Dashed line delineates basal lamina. White arrow indicates vismodegib-persistent lesions and yellow arrow indicates HF Lgr5+ cells.
ISH for Gli1, a transcription factor relaying HH signalling and a HH target gene, demonstrated that Gli1 was co-expressed with Lgr5 before treatment and was strongly downregulated in all TCs upon vismodegib treatment (Fig. 2a-c and Extended Data Fig. 2b-d), consistent with the strong inhibition of HH signalling by vismodegib. Drug-tolerant lesions did not present mutations in the Smo gene, the most frequently mutated gene in vismodegib-resistant BCC6,7 (Extended Data Fig. 2e), reinforcing the notion that the persistence of drug-tolerant lesions is not mediated by mutations abrogating vismodegib sensitivity, as it occurs in vismodegib resistant BCCs that continue to grow during treatment3,6,7.
BCC relapse upon vismodegib discontinuation has been reported in human BCC patients5. Discontinuation of vismodegib administration for 4 weeks in K14-CreER/Ptch1cKO/Lgr5-DTR-GFP mice12 bearing drug-persistent lesions lead to the re-growth of BCC to their pre-treatment size. Moreover, re-administration of vismodegib to the relapsing BCC leads to tumour regression (Fig. 2d-e).
To determine whether the quiescent TC population mediates tumour relapse, we performed BrdU pulse chase label retention studies by administrating BrdU during 3 days in mice bearing BCC to label proliferative cells, and then chased the mice during 5 weeks under vismodegib treatment (Fig.2f). We found BrdU labelled retaining cells (LRCs) in Lgr5+ drug-tolerant lesions, suggesting that persisting TCs existed prior vismodegib treatment and underwent a phenotype switch from a proliferative to a quiescent state (Fig. 2g-h). Upon vismodegib discontinuation, relapsed tumours lost the LRCs (Fig. 2g-h), suggesting that quiescent LRCs actively proliferated, diluting the BrdU. To test this possibility directly, we performed BrdU/EdU double labelling studies. Administration of EdU during vismodegib discontinuation lead to EdU incorporation in the majority of the Lgr5+BrdU+LRCs (Fig. 2i and Extended Data Fig. 2f-g), further demonstrating that the quiescent LRCs re-enter cell cycle and proliferate to contribute to tumour relapse.
To determine whether quiescence promotes the persistence of the vismodegib-tolerant lesions, we assessed whether increasing epidermal proliferation decreases the number of drug-tolerant lesions. Mice bearing Lgr5+ persistent lesions were treated for 2 weeks with vismodegib in combination with 12-O-Tetradecanoylphorbol-13-acetate (TPA) or retinoic acid (RA), two drugs that promote epidermal proliferation. Combined vismodegib and TPA or RA administration promoted proliferation, which lead to the elimination of Lgr5+ persistent lesions (Extended Data Fig. 2h-j), demonstrating that when persistent slow-cycling cells are forced to proliferate, they become sensitive to vismodegib and are eliminated.
We isolated the persistent TCs by flow cytometry (FACS), by combining Lgr5-GFP with Lrig1, which does not co-localize with Lgr5 in resting HFs13, (Extended Data Fig. 2k-m). Upon vismodegib administration the proportion of Lgr5+Lrig1+ cells decreased, together with an increase in the Lrg5-Lrig1+ population (Extended Data Fig. 2m-n).
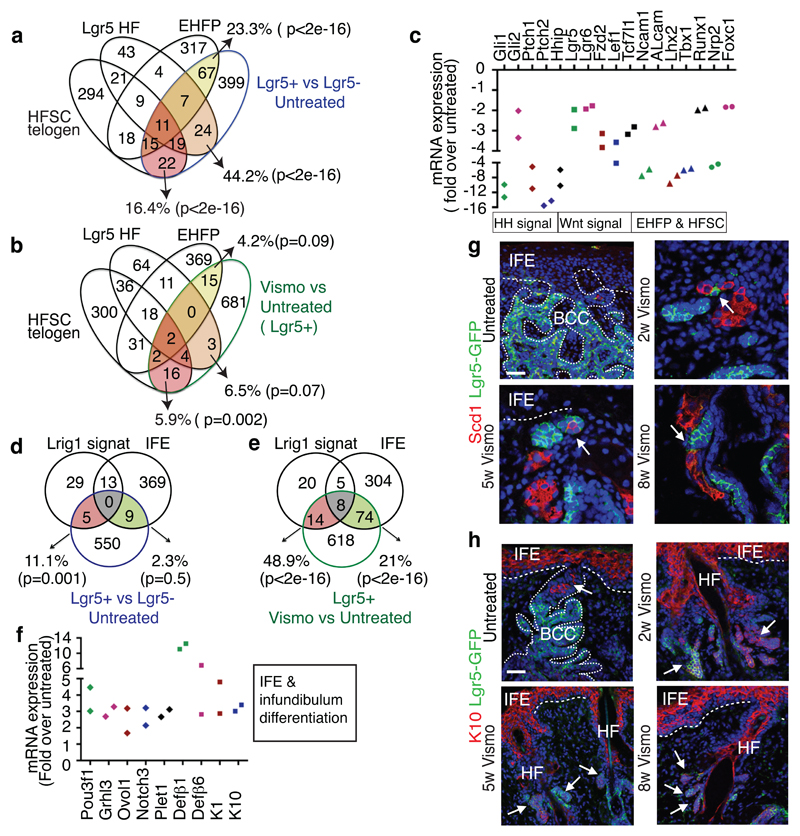
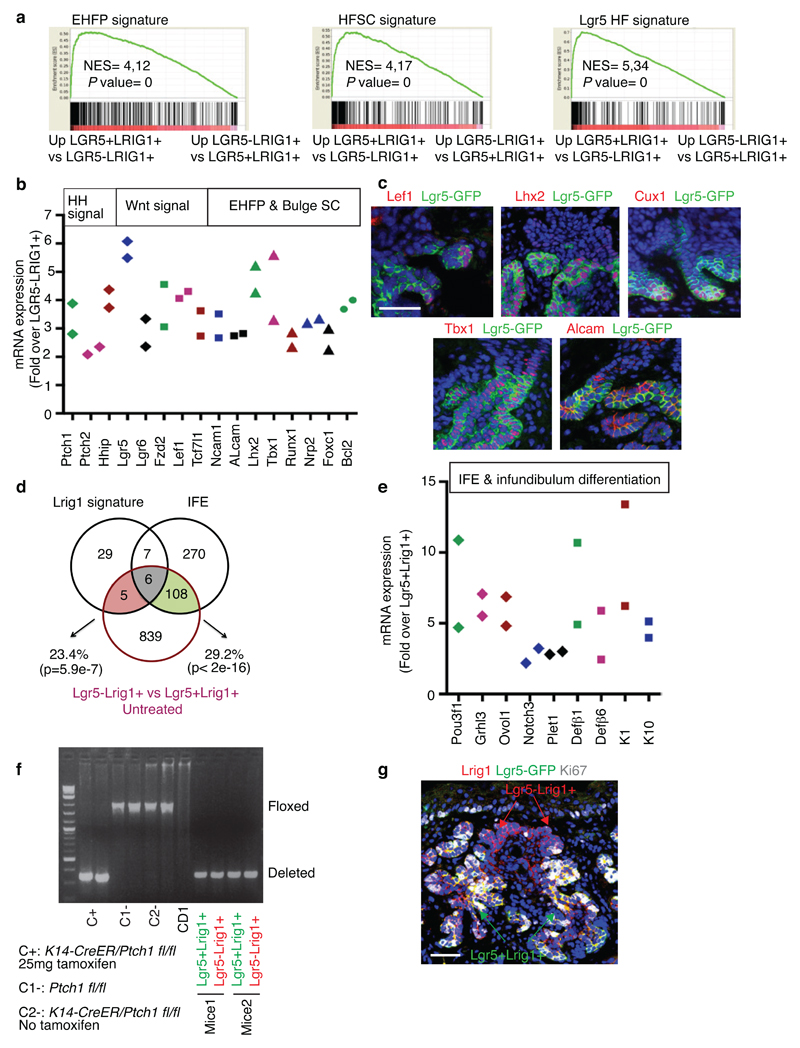
We then characterized the gene signature of FACS isolated Lgr5+Lrig1+ and Lgr5-Lrig1+ TC populations from untreated BCCs using microarray analysis. It has been previously shown that during BCC initiation, IFE and infundibulum Ptch1cKO or SmoM2-targeted cells are reprogrammed into embryonic HF progenitor (EHFP) and adult HF-like fate in a Wnt dependent manner9,14. The genes upregulated in Lgr5+Lrig1+ TCs compared to Lrg5-Lrig1+ TCs (Lgr5+BCC signature) overlapped significantly with the EHFP signature15 (23.3%), resting HFSC signature16 (16,4%) and Lgr5+ HF signature17 (44.2%)(Fig. 3a and Extended Data Fig. 3a). The Lgr5+ BCC signature included genes downstream of HH signalling pathway such as Ptch1, Ptch2 and Hhip, genes of the Wnt signalling pathway such as Lgr5, Fzd2 and Lef1, transcription factors expressed by EHFP such as Runx1 and Lhx2 and genes expressed by HFSC such as Tbx1 or Foxc1 (Extended Data Fig. 2b). Immunostaining for Lef1, Lhx2, Cux1, Tbx1, and Alcam in Ptch1cKO-induced BCCs confirmed the increased expression of these Wnt, EHFP and HFSC genes in Lgr5+ TCs (Extended Data Fig. 3c).
Fig. 3. Vismodegib promotes BCC differentiation.
(a-b) Venn diagram showing the similarities and the differences from 2 independent microarray experiments between the genes upregulated more than two-fold in Lgr5+Lrig1+ vs. Lgr5-Lrig1+ (a) or in Lgr5+Lrig1+ cells vismodegib treated vs. untreated (b) with the telogen HFSC signature16, HF Lgr5-expressing cells signature17 and EHFP signature15. (c) mRNA expression of HF genes downregulated in Lgr5+Lrig1+ cells 8 weeks following vismodegib administration (n=2 independent microarray experiments). (d-e) Venn diagrams showing the similarities and the differences between the genes differentially upregulated more than two-fold from 2 independent microarray experiments in Lgr5+Lrig1+ vs. Lgr5-Lrig1+ (d) or in Lgr5+Lrig1+ TCs vismodegib treated vs. untreated (e) compared to IFE16 and Lrig113 signatures. (f) mRNA expression of IFE and infundibulum genes upregulated in Lgr5+Lrig1+ cells 8 weeks following vismodegib administration (n=2 independent microarray experiments). (g) Immunostaining for GFP and Stearoyl-CoA desaturase-1 (Scd1) in untreated and vismodegib-treated Ptch1cKO/Lgr5-DTR-GFP mice. Arrow indicates areas of SG differentiation. (h) Immunostaining for GFP and K10 in untreated and vismodegib-treated Ptch1cKO/Lgr5-DTR-GFP mice. Arrow indicates differentiation of Lgr5+ TCs into K10-expressing cells. Three independent experiments per condition were analysed showing similar results in g and h. Hoechst nuclear staining in blue; scale bars, 50 μm. Dashed line delineates basal lamina. p value calculated using the hypergeometric test for each intersection of two subsets of genes with phyper function in R software, in a, b, d and e.
To assess whether Lgr5-Lrig1+ population represents a differentiated part of the BCC, we defined the genes upregulated in Lgr5-Lrig1+ compared to Lgr5+Lrig1+ TCs (Lgr5-signature). Interestingly, the Lrg5- signature overlapped significantly with previously reported Lrig113 and IFE16 signatures, including markers of IFE or infundibulum differentiation such as Ovol1, Notch-3, Defβ6, Keratins 1 or 10 (Extended Data Fig. 3d-e). PCR analysis performed on FACS-isolated Lgr5+Lrig1+ and Lgr5-Lrig1+ TCs confirmed that both populations presented Ptch1 deletion and staining for the proliferation marker Ki67 showed that the Lrg5+Lrig1+ population was more proliferative than the Lgr5-Lrig1+ population (Extended Data Fig. 3f-g).
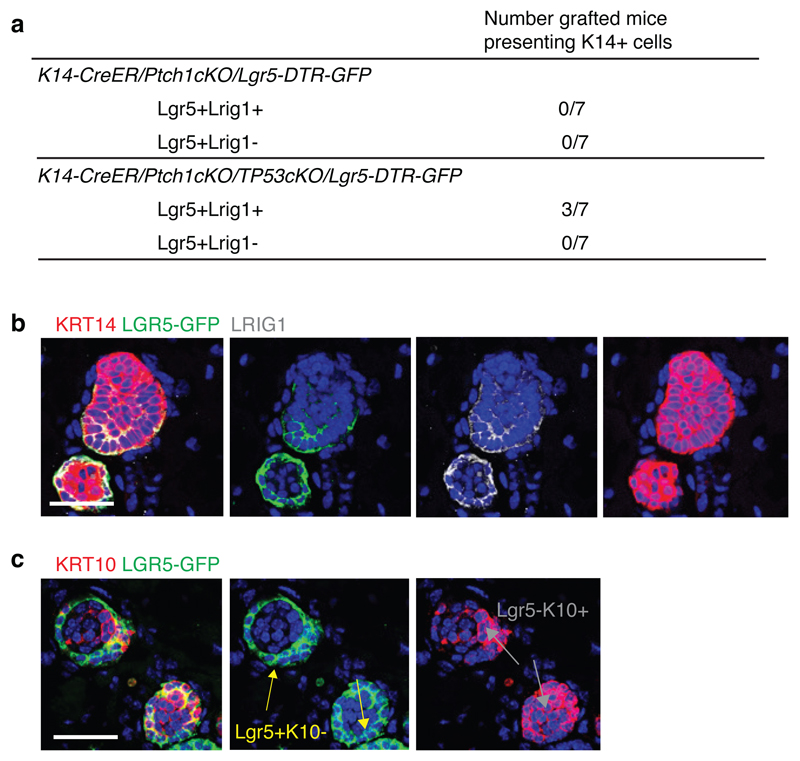
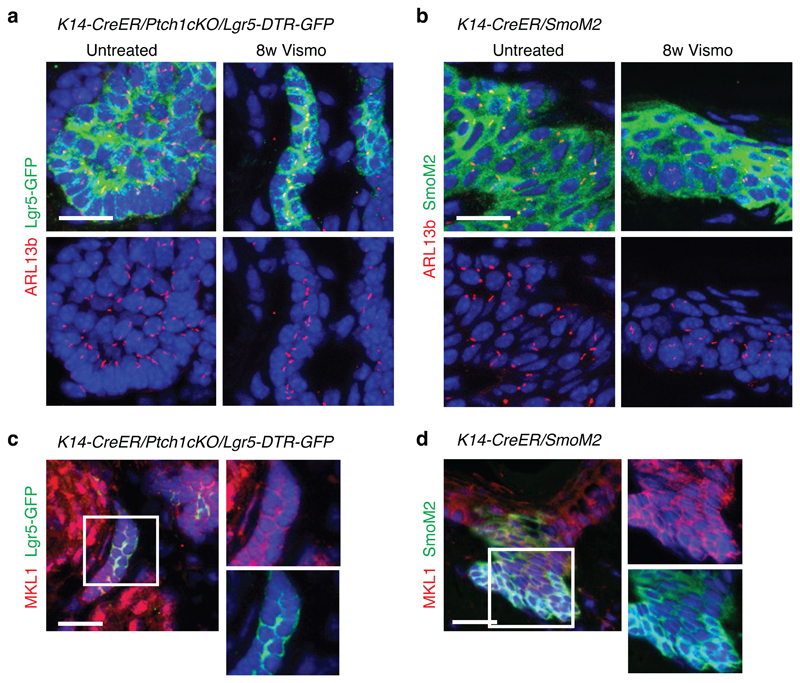
To directly assess whether Lgr5-Lrig1+ cells were more differentiated than Lgr5+Lrig1+ population, we performed transplantation assays of FACS-isolated TC populations from K14-CreER/Ptch1cKO/Lgr5-DTR-GFP and K14-CreER/Ptch1cKO/Tp53cKO/Lgr5-DTR-GFP mice that growth faster and form bigger tumours18. Groups of cells resembling early BCC and expressing K14, Lgr5 and Lrig1 were only observed upon transplantation of Lgr5+Lrig1+ cells from Tp53cKO mice in 3 out of 7 mice. In contrast, no TCs were observed following the transplantation of Lgr5-Lrig1+ cells from Tp53cKO BCC or in the absence of Tp53 deletion (Extended Data Fig. 4a-b). Tumours found after transplantation of Lgr5+Lrig1+ cells mimicked the different cell types present in BCCs: Lgr5+Lrig1+, Lgr5-Lrig1+ and cells presenting a flat differentiated morphology expressing Keratin-10 (K10) (Extended Data Fig. 4b-c). Altogether, these results show that BCCs contain a more stem/progenitor-like TC population (Lgr5+Lrig1+) and a more differentiated population (Lgr5-Lrig1+) of TCs. Immunostaining for the primary cilia marker, ARL13b and the coactivator MKL1 demonstrated that loss of primary cilia19 or SRF-MKL1 activation20 are not involved in the drug-tolerant phenotype described in this study (Extended Data Fig. 5a-d).
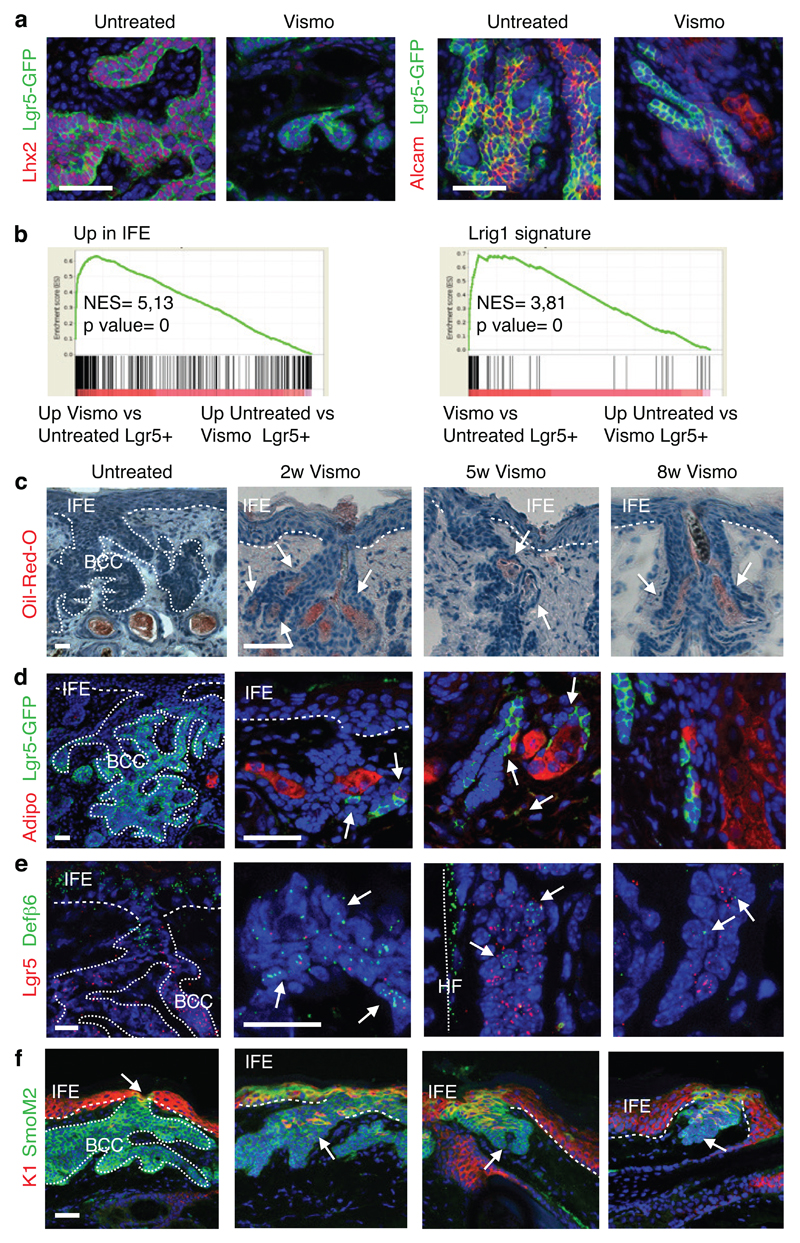
To define the molecular mechanisms by which vismodegib promotes tumour shrinkage and appearance of drug-tolerant lesions, we compared the transcriptional profile of FACS-isolated Lgr5+Lrig1+ and Lgr5-Lrig1+ TCs from untreated BCCs and mice that received vismodegib for 8 weeks. We found that the overlap between Lgr5+Lrig1+ signature and the EHFP15, Lgr5+ HF17 and resting HFSC16 signatures decreased considerably in vismodegib-treated cells (Fig. 3a-b). A strong decrease in the expression of HH target genes such as Gli1, Gli2 Ptch1, Ptch2 and Hhip was found upon vismodegib treatment (Fig. 3c). Only a small portion of the reduction of the overlap between vismodegib and EHFP was driven by HH target genes such as Hhip1, Ptch2 and Gli1 and the reduction in the overlap between HFSC and vismodegib signature was not mediated by HH target genes as the HFSC signature was obtained in the resting stage when HH signalling is not active16. The genes belonging to the EHFP and HFSC signatures such as Runx1, Lhx2, Lgr5, Alcam and Tbx1 were also downregulated following vismodegib administration at the mRNA and protein levels (Fig. 3c and Extended Data Fig. 6a).
The overlap between Lgr5+Lrig1+ signature and the infundibulum13 and the IFE16 signatures increased considerably upon vismodegib treatment, with genes such as Ovol1, Notch3, Plet1, K1, K10, Defβ6 and Defβ4 strongly upregulated following vismodegib treatment (Fig. 3d-f and Extended Data Fig. 6b), indicating that vismodegib promotes the differentiation of BCC into IFE and infundibulum-like cells, possibly through a Notch-dependent mechanism21.
Lrig1+ SCs give rise to infundibulum and sebaceous gland (SG) in homeostatic conditions13. We performed staining for SG markers (Stearoyl-CoA desaturase-1 (Scd1) and Adipophilin) and lipids (Oil-Red-O staining). Whereas sebaceous cysts were visible in the dermis in untreated conditions, cells expressing SG markers were localized within the tumour mass after two weeks of vismodegib treatment and adjacent to the neoplastic lesions upon 5 and 8 weeks of treatment (Fig. 3g and Extended Data Fig. 6c-d). We studied the expression of Keratin-10 (K10) and Defensin-β6 (Defβ6), which are normally expressed in infundibulum and IFE cells13. Upon vismodegib administration, K10 and Defβ6 were strongly upregulated in TCs (Fig. 3h and Extended Data Fig. 6e), further supporting that vismodegib induces tumour differentiation towards SG/infundibulum/IFE-like fate in the Ptch1cKO-derived BCCs.
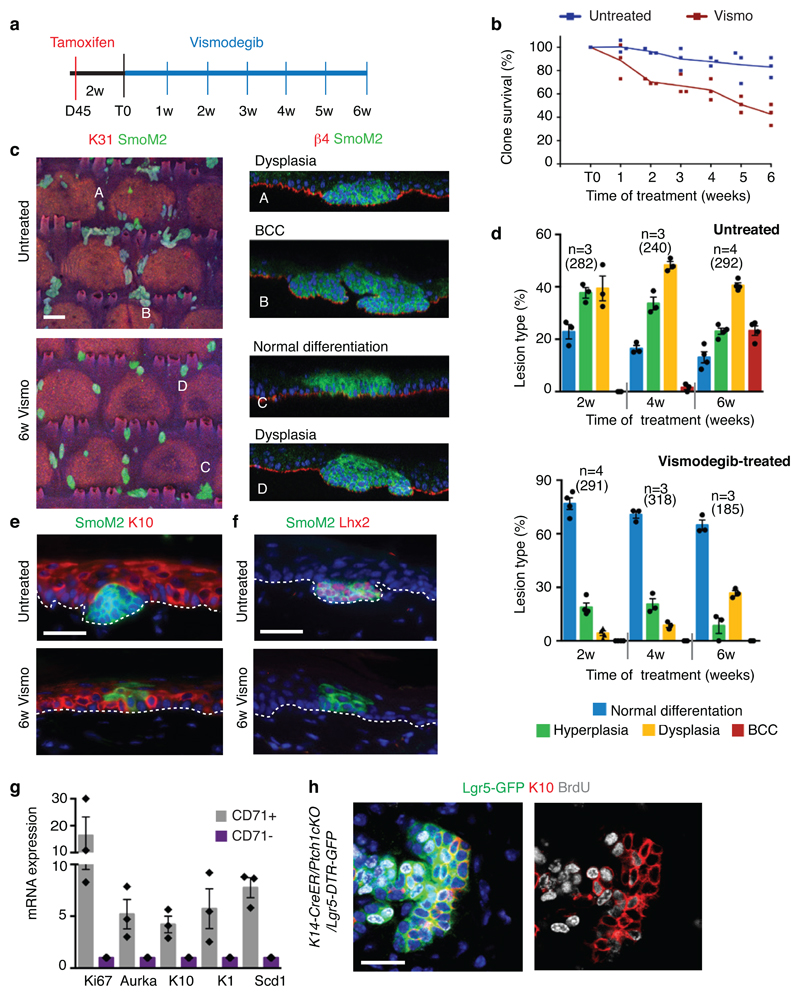
We then assessed whether vismodegib also promotes BCC differentiation into IFE in SmoM2-induced BCCs. Upon vismodegib administration, SmoM2-expressing cells connected to normal differentiating IFE cells expressed high level of the IFE differentiation marker Keratin-1 (K1) (Extended Data Fig. 6f). We studied the effect of vismodegib administration on the SmoM2-clone survival and morphology during BCC initiation. Two weeks after SmoM2 expression, mice were treated daily with vismodegib during 6 weeks (Extended Data Fig. 7a). Vismodegib administration led to a progressive loss of SmoM2-expressing clones in comparison to untreated conditions and to the emergence of clones presenting normal differentiation with only a small proportion of the clones progressing into hyperplasias and dysplasias (Extended Data Fig. 7b-d). The normally differentiating clones observed during vismodegib treatment were positive for the differentiation marker K10 but did not express Lhx2, a HFSC marker present in hyperplasias and dysplasias (Extended Data Fig. 7e-f), indicating that vismodegib administration inhibits oncogene-induced HF reprograming, promotes IFE differentiation of SmoM2-expressing cells and prevents BCC initiation.
To assess whether Lgr5+ TCs consist of heterogeneous populations in terms of proliferation and differentiation, we isolated Lgr5+ Lrig1+ TCs based on the expression of the proliferation marker CD7110 two weeks after vismodegib administration, when both persistent and responsive to vismodegib TCs co-exist. The CD71+ population expressed higher level of proliferation (Ki67 and Aurka) and differentiation markers (K1, K10 and Scd1) (Extended Data Fig. 7g), indicating that the more proliferative TCs are more prone to vismodegib-induced differentiation. Immunostaining for the differentiation marker K10 in Lgr5+ TCs after BrdU label-retention followed by two weeks of vismodegib administration, showed that the majority of BrdU-labelled cells were negative for K10, while K10 was observed in non-LRCs or in LRCs in which the BrdU signal was lower due to its dilution following cell division (Extended Data Fig. 7h). These results support the notion that vismodegib induces higher rate of differentiation in the drug-responsive tumour population that actively cycles.
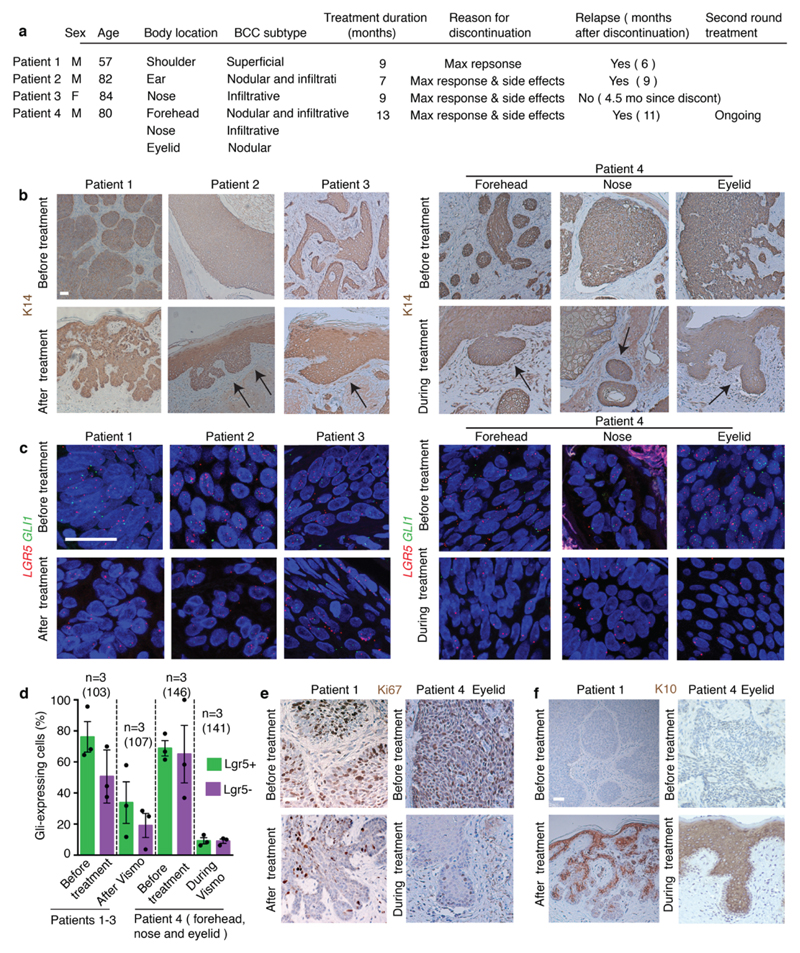
To determine the human relevance of our findings, we analysed biopsies from four patients presenting locally advanced BCCs before, during or immediately after vismodegib treatment discontinuation. Vismodegib did not eradicate all TCs in these patients, and small tumorigenic lesions expressing LGR5 persisted despite the administration of vismodegib for months (Extended Data Fig. 8a-c). ISH for GLI1 and quantification of the GLI1-mRNA-Dot/TC before, after or during vismodegib treatment showed that there was almost no GLI1 expression in samples from patients during vismodegib treatment but few more GLI1-expressing cells were found shortly after discontinuation of vismodegib treatment (Extended Data Fig. 8c-d), indicating that vismodegib administration efficiently inhibits HH signalling in these drug-persistent lesions. Ki67 immunohistochemistry showed that vismodegib-persistent lesions were more quiescent than the untreated BCC cells and vismodegib induced the expression of the differentiation marker K10 in human TCs (Extended Data Fig. 8e-f). Importantly, patient 1 and 2 relapsed 6 months and 9 months after treatment discontinuation and patient 4 had previously relapsed after vismodegib discontinuation, showing that vismodegib-mediated TC persistence is fully reversible upon drug withdrawal and re-inducible upon new cycle of vismodegib treatment. Together, these results show the existence of drug-tolerant lesions in human BCC, characterized by the expression of Lgr5 and their relative quiescence.
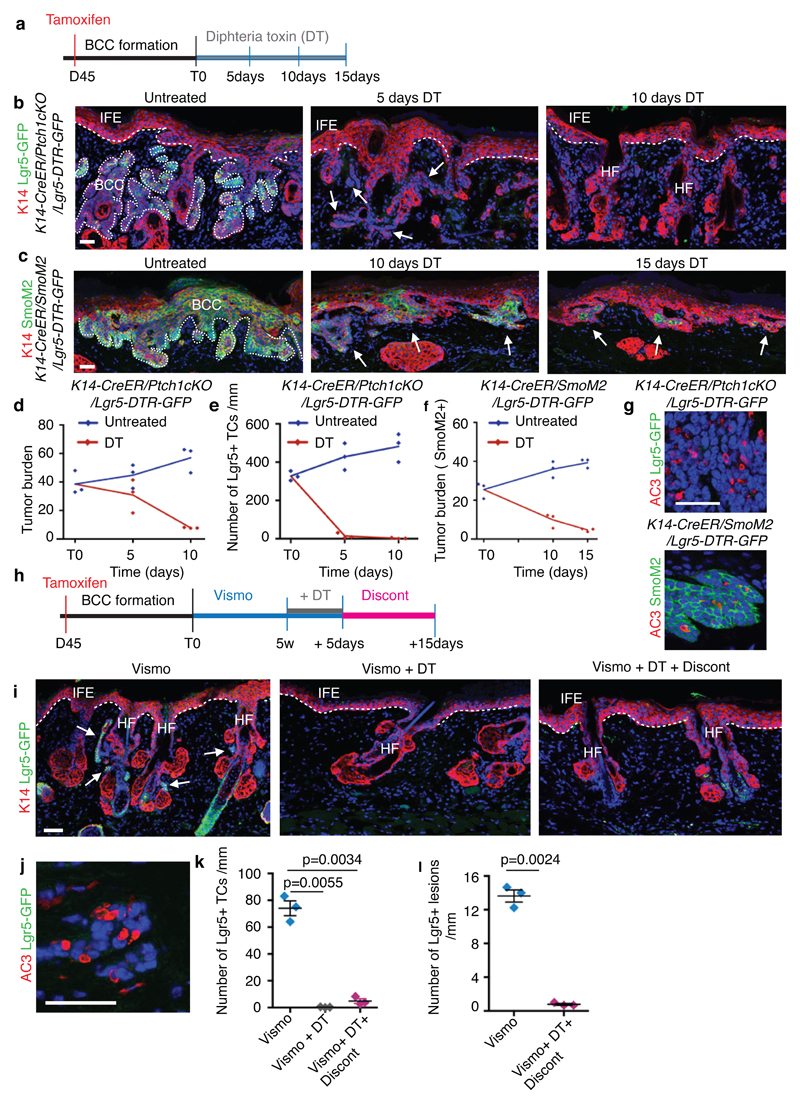
To assess whether Lgr5+ cells mediate tumour growth, we lineage ablated Lgr5+ TCs by administrating diphtheria toxin (DT) for 10 days to K14-CreER/Ptch1cKO/Lgr5-DTR-GFP mice and for 15 days to K14-CreER/Rosa-SmoM2/Lgr5-DTR-GFP mice (Extended Data Fig. 9a). DT treatment could not be extended due to toxicity of Lgr5 ablation in normal liver cells12. DT administration lead to a substantial elimination of the tumour mass in both BCC models (80% of the initial tumour mass) and almost a total elimination of Lgr5 expressing cells in Ptch1cKO-induced BCC (Extended Data Fig. 9b-g), further demonstrating the importance of Lgr5+ TCs to sustain BCC growth and maintenance.
To determine whether vismodegib administration together with Lgr5 lineage ablation can eliminate the Lgr5-expressing drug-tolerant lesions responsible for tumour relapse, we administrated DT for 5 consecutive days in combination with vismodegib to K14-CreER/Ptch1cKO/Lgr5-DTR-GFP mice bearing persistent lesions (Extended Data Fig. 9h). Lgr5 ablation combined with vismodegib administration lead to almost total elimination (99.5%) of the persistent Lgr5-expressing TCs (Extended Data Fig. 9i-k). We did not observe reappearance of Lgr5+ cells from the vast majority (94%) of the initial Lgr5+ persistent tumorigenic lesions 15 days after DT-vismodegib treatment discontinuation (Extended Data Fig. 9i, k l), whereas HFSC were replenished by Lgr5-expressing cells as previously reported22, indicating that there is little plasticity within the Lgr5-Lrig1+ BCC cells to revert back to Lgr5+ TCs after DT-vismodegib treatment. The therapeutic benefit of Lgr5 ablation in BCC is reminiscent of the effect observed following Lgr5 ablation upon transplantation of mouse model of colorectal cancer, where Lgr5 ablation prevents metastasis, and in human colorectal cancer organoids, in which Lgr5 ablation promotes tumour regression and synergises with chemotherapy23,24.
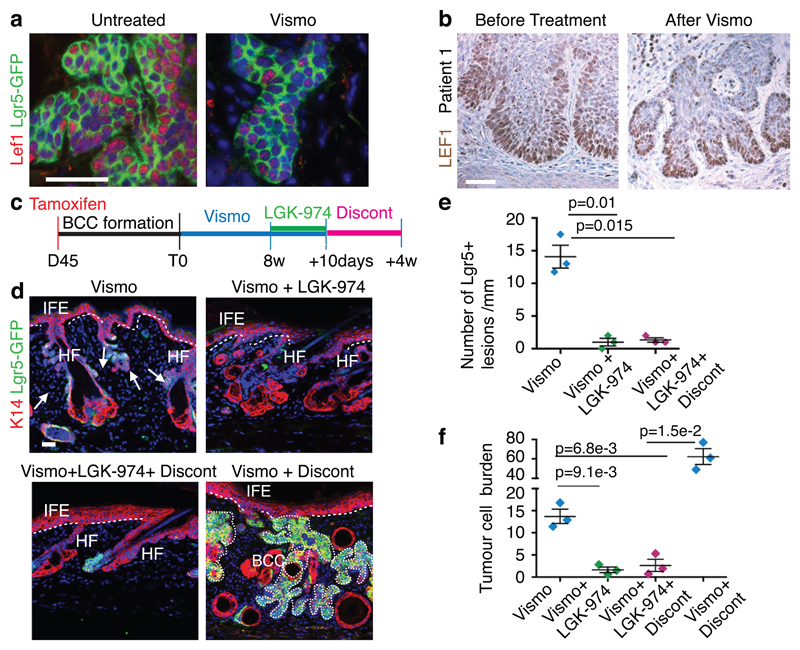
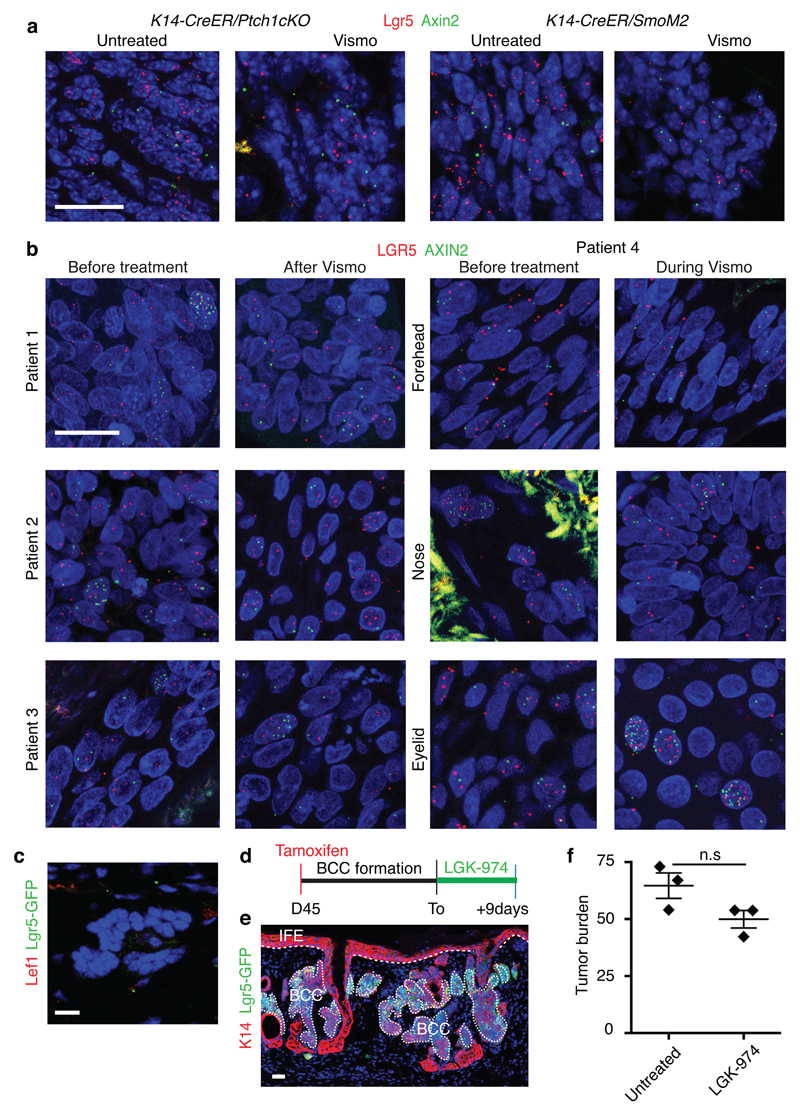
Lgr5 has been identified as a Wnt target gene, and acts as a co-receptor for R-spondin, positively regulating the Wnt signalling pathway11. Administration of vismodegib decreased the levels but did not completely abolish the expression of different members of the Wnt signalling pathway (Fig. 3c). Immunostaining for Lef1 a transcription factor that relays Wnt signalling and that is a Wnt target gene in BCCs9 and ISH for Axin2, another Wnt target gene, showed that Lef1 and Axin2 were expressed in Lgr5+ persistent lesions from both mouse and human samples (Fig. 4a-b and Extended Data Fig. 10.a-b), indicating that Lgr5+ persistent TCs are characterized by active Wnt signalling.
Fig. 4. Dual HH and Wnt inhibition eliminates vismodegib-persistent Lgr5+ TCs.
(a) Immunostaining for GFP and Lef1 in Ptch1cKO/Lgr5-DTR-GFP mice untreated and vismodegib-treated. (b) Immunohistochemistry for LEF1, in biopsies from a patient before and after vismodegib treatment. (c) Protocol for dual HH and Wnt inhibition followed by treatment discontinuation. (d) Immunostaining for GFP and K14 upon vismodegib administration, dual inhibition of Wnt and HH pathways and following discontinuation in Ptch1cKO/Lgr5-DTR-GFP mice. (e) Number of Lgr5+ tumorigenic lesions per length of epidermis upon treatment and treatment discontinuation in Ptch1cKO/Lgr5-DTR-GFP-derived BCCs. (n=3 mice, 3mm of skin analysed per mouse). Mean+/- s.e.m. Two-sided t-test. (f) Quantification of the tumour burden upon treatment and treatment discontinuation in Ptch1cKO/Lgr5-DTR-GFP-derived BCCs (n=3 mice). See Source Data. Two-sided t-test. Mean+/- s.e.m. Three independent experiments per condition were analysed showing similar results (a) and two technical replicates were performed for each sample showing similar results (b). Hoechst nuclear staining in blue; scale bars, 50 μm. Dashed line delineates basal lamina Arrow indicates vismodegib-persistent lesions.
To assess whether dual Wnt and HH inhibition can promote the elimination of Lgr5+ persistent TCs, LGK-974, a porcupine Wnt inhibitor25 was administrated for 10 consecutive days in combination with vismodegib to K14-CreER/Ptch1cKO/Lgr5-DTR-GFP mice bearing Lgr5+ persistent lesions (Fig.4c). Combined Wnt and HH inhibition resulted in the disappearance of Lef1 expression consistent with an efficient Wnt inhibition, the elimination of the vast majority (93%) of initial Lgr5+ drug-tolerant lesions and a substantial decrease in the tumour burden (87%) compared to vismodegib treatment alone (Fig. 4d-f and Extended Data Fig. 10c). No significant reduction of the tumour burden was observed following the administration of Wnt inhibitor alone showing that although Wnt inhibition can block BCC initiation9,14 it is not efficient as monotherapy to induce clinically relevant BCC regression (Extended Data Fig. 10d-f). We then determined whether rare residual TCs can lead to tumour relapse upon discontinuation of dual Wnt and HH inhibition. Four weeks after discontinuation, which corresponds to the time that it takes for drug-tolerant lesions to regrow to their initial size upon vismodegib discontinuation, no tumour relapse was observed, as shown by the stable number of Lgr5+ tumour lesions and tumour burden (Fig. 4d-f). Altogether, these results demonstrate that the synergy between HH and Wnt inhibition in BCC leads to the elimination of the vast majority Lgr5+ persistent TCs preventing tumour relapse.
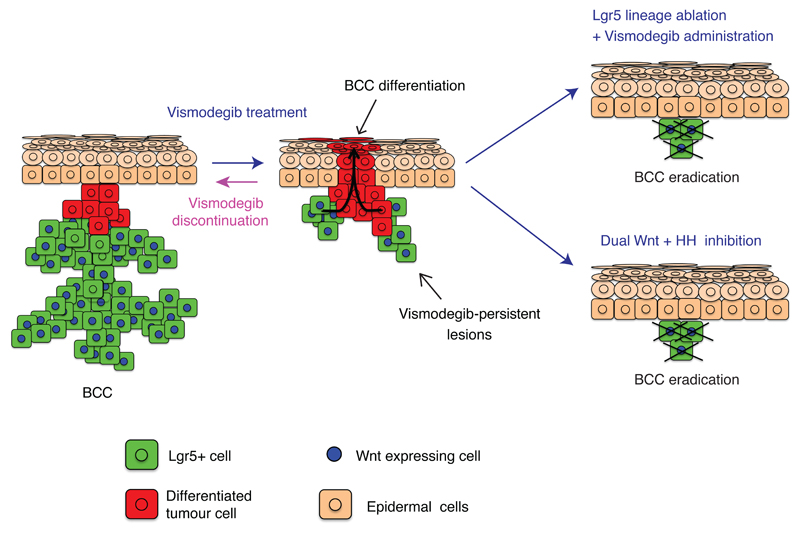
In summary, our study demonstrates that vismodegib induces BCC regression by promoting tumour differentiation and identifies a quiescent TC population expressing Lgr5 that persists following vismodegib treatment in different mouse models and human patients, promoting BCC relapse following treatment discontinuation (Extended Data Fig. 11). The non-genetic mechanism of drug resistance described here differs from the previously described mutations in Smo or other genes that render cells insensitive to vismodegib treatment6,7,19,20. Vismodegib administration promotes a switch from a proliferative state fostering tumour growth to a tumour state characterized by HH inhibition and slow-cycling properties that is fully reversible upon drug withdrawal, and re-inducible upon new cycle of vismodegib treatment. These persistent Lgr5+ TCs present residual Wnt signalling activity in both mouse and human BCCs and could be eliminated by dual Wnt and HH inhibition leading to tumour eradication in the vast majority of the BCCs (Extended Data Fig. 11). Dual Wnt and HH inhibition constitutes a clinically relevant strategy to avoid BCC relapse, which might also be effective against other cancers, such as medulloblastoma, characterised by HH and Wnt activation26.
Material and Methods
Ethical compliance
This study complied with all relevant ethical regulations regarding experiments involving mouse and human skin samples. Mouse colonies were maintained in a certified animal facility in accordance with European guidelines. Experiments involving mice presented in this work were approved by Comité d’Ethique du Bien Être Animal (Université Libre de Bruxelles) under protocol number 483N and 632N, that state that animals should be euthanized if they present tumours that exceed 1 cm in diameter. The BCCs observed in this study were microscopic and ranged from 1.5 mm to 100 μm in diameter and in none of the experiments performed the BCCs exceeded the limit (1 cm in diameter) described in protocols 483N and 632N.
Experiments involving human samples presented in this study were approved by the ethics committee of Vall d’Hebron Institute of Oncology (VHIO) and by the ethics committee of Erasmus Hospital under protocol number P2012/332. Permission and informed consent was obtained from all the patients in order to use their biopsies in this study.
Mice
K14-CreER transgenic mice27 were kindly provided by E. Fuchs, Rockefeller University, USA. Ptch1fl/fl mice 28 and Rosa/SmoM2-YFP 29 mice were obtained from the JAX repository. Lgr5-DTR-GFP mice, knock in mouse that contain the diphtheria toxin receptor (DTR) fused to an enhanced green fluorescent protein (GFP) under the control of Lgr5 regulatory region, allowing to identify the Lgr5-expressing cells using the GFP reporter and to selectively ablate Lgr5 tumour cells by diphtheria toxin (DT) administration12, were kindly provided by Genentech (San Francisco, USA). Tp53fl/fl 30 mice were obtained from the National Cancer Institute at Frederick.
Female and male animals have been used for all experiments and equal gender ratios have been respected in the majority of the analysis. Analysis of the different mutant mice was not blind and sample size was calculated to reach statistical significance. The experiments were not randomized.
Tumour induction
For Ptch1cKO deletion, K14-CreER/Ptch1fl/fl/Lrg5-DTR-GFP mice and K14-CreER/Ptch1fl/fl/TP53fl/fl/Lrg5-DTR-GFP (2.5months old) received one intraperitoneal injection of 2.5mg of tamoxifen during three consecutive days. For SmoM2 expression, K14-CreER/Rosa-SmoM2/Lgr5-DTR-GFP mice (1.5 months old) received one intraperitoneal injection of 1mg of tamoxifen. In the clonal induction experiments, K14-CreER/Rosa-SmoM2 mice (1.5 months old) received one intraperitoneal injection of 0.1mg of tamoxifen.
Vismodegib and LGK-974 administration
Vismodegib/GDC-0449 was kindly provided by Genentech (San Francisco, US) and LGK-974 was kindly provided by Novartis (Bâle, Switzerland). During vismodegib treatment, mice received 150mg vismodegib/kg mice by oral gavage daily. Vismodegib was administered in two doses (one every 12 hours).
During the 10 day LGK-974 treatment mice received: six days 10mg LGK-974 / kg mice by oral gavage and the last 4 days one topical application of 100 μl of 0.2mg/ml of LGK-974 diluted in propylene glycol: ethanol (7:3 v/v). For oral gavage LGK-974 and vismodegib were dissolved in 0.5% methylcellulose solution containing 0.2% Tween-80.
12-O-Tetradecanoylphorbol-13-acetate and retinoic acid administration
12-O-Tetradecanoylphorbol-13-acetate (TPA) and retinoic acid (RA) were used to promote epidermal proliferation31,32. TPA (200 μl of 0.02 mg/ml solution in dimethyl sulfoxide) or retinoic acid (200 μl of 0.5 mM all-trans-RA (Sigma) in dimethyl sulfoxide) was administered daily to shaved mouse back skin for 2 weeks.
DT administration
For Lgr5 lineage cell ablation, mice received a daily intraperitoneal injection of 50 μg/kg of diphtheria toxin (Sigma).
Immunostaining in sections
The tail for the SmoM2 model and ventral skin or back skin for Ptch1cKO model were embedded in optimal cutting temperature compound (OCT, Sakura) and cut into 5–8 μm frozen sections using a CM3050S Leica cryostat (Leica Microsystems).
Immunostainings were performed on frozen sections. Owing to the fusion of SmoM2 with YFP and DTR with GFP, SmoM2-expressing and Lgr5-expressing cells were detected using anti-GFP antibody. Frozen sections were dried and then fixed with 4% paraformaldehyde/PBS (PFA) for 10min at room temperature and blocked with blocking buffer for 1h (PBS, horse serum 5%, BSA 1%, Triton 0.1%). Skin sections were incubated with primary antibodies diluted in blocking buffer overnight at 4 ° C, washed with PBS for 3 × 5 min, and then incubated with Hoechst solution and secondary antibodies diluted in blocking buffer for 1h at room temperature. Finally, sections were washed with PBS for 3 × 5 min at room temperature and mounted in DAKO mounting medium supplemented with 2,5% Dabco (Sigma). Primary antibodies used were the following: anti-B4-integrin (Rat, 1:200, BD, clone346-11A, ref.553745, lot.5239648), anti-GFP (chiken, 1:3000,Abcam,ref.ab13970, lot.236651-23), anti-Active Caspase-3 (rabbit, 1/600, R&D, ref.AF835, lot.CF23517031), anti-Ki67 (rabbit, 1/1000, Abcam, ref.ab15580, lot.GR3198193-1), anti-Lrig1 (goat, 1/500, R&D, ref.AF3688, lot.ZPH0217111), anti-Lef1 (rabbit, 1/100, Cell Signaling, ref.2230), anti-Lhx2 (goat, 1/500, Santa Cruz, sc-19344, lot.K1615), anti-Cux1 (rabbit,1/6000, Santa Cruz, sc-13024), anti-Tbx1 (rabbit, 1/100, Invitrogen) anti-Alcam (goat, 1/1000, Novus, ref.FAB1172F, lot.AASW0111121), anti-Keratin10(rabbit, 1/3000,Covance,ref.PRB-159P-0100), anti-Keratin1 (rabbit, 1/3000, Covance, ref.PRB-165P-0100),anti-Keratin-14 (rabbit, 1/3000, Thermofisher), anti-scd1(goat, 1/500, Santa Cruz, ref.sc14719,lot.H2610), anti-adipophilin (guinea pig,1/5000, Fitzgerald, ref.20R-AP002, lot.P17030911), anti-BrdU(mouse, 1/200, BD, clone 3D4,ref. 560209, lot.4293550)anti-MKL1 (rabbit,1/200, Sigma, ref.HPA030782,lot.C106712) and anti-ARL13b (rabbit, 1:2000,ref.17711-1-AP, Proteintech, lot.49885). The following secondary antibodies were used: anti-rabbit, anti-rat, anti-goat, anti-guinea pig, anti-chicken, conjugated to AlexaFluor488 (Molecular Probes) and to rhodamine Red-X and Cy5 (JacksonImmunoResearch). Images of the Immunostainings in sections were acquired using an Axio Imager M2 microscope and Axiovision 4.8.2 software (Carl Zeiss).
Immunostaining in whole mounts
Whole-mounts of tail epidermis were performed as previously described33 and used to quantify the proportion of surviving clones. Precisely, pieces of tail were incubated for 1h 37°C in EDTA 20mM in PBS in rocking plate, then using forceps the dermis and epidermis were separated and the epidermis was fixed for 30 minutes in paraformaldehyde (PFA) 4% in agitation at room temperature and washed 3 times with PBS.
For the immunostaining: tail skin pieces were blocked with blocking buffer for 3h (PBS, horse serum 5%, Triton 0.8%) in a rocking plate at room temperature. After, the skin pieces were incubated with primary antibodies diluted in blocking buffer overnight at 4 ° C. The next day, they were washed with PBS-Tween 0.2% for 3 × 10 min at room temperature, and then incubated with the secondary antibodies diluted in blocking buffer for 3h at room temperature, washed 2x10 min with PBS-Tween 0.2% and washed for 10min in PBS. Finally, they were incubated in Hoechst diluted in PBS for 30 minutes at room temperature in the rocking plate, washed 3x10 min in PBS and mounted in DAKO mounting medium supplemented with 2,5% Dabco (Sigma). Primary antibodies used were the following: anti-GFP (Rabbit, 1/100, BD, ref. A11122), anti-B4-integrin (Rat, 1:200, BD, ref. 553745) and anti-K31 (Guinea Pig, 1:200, Progen, ref. GP-hHa1). The following secondary antibodies were used: anti-rabbit, anti-rat and anti-guinea pig, conjugated to AlexaFluor488 (Molecular Probes), to rhodamine Red-X (JacksonImmunoResearch) and to Cy5 (1:400, Jackson ImmunoResearch).
BrdU/EdU label retention studies
For the BrdU studies, mice received 3 daily intraperitoneal injections (150 μl of 10mg/ml) (every 8 hours) for 3 consecutive days. For EdU studies, mice received 3 daily intraperitoneal injections (10 μl of 1mg/ml) (every 8 hours) for 3 consecutive days. EdU and BrdU stainings were performed as described 18
In situ hybridization/RNA FISH
The tail in the SmoM2 model and ventral skin in the Ptch1cKO model were embedded in optimal cutting temperature compound (OCT, Sakura) and cut into 5–8μm frozen sections using a CM3050S Leica cryostat (Leica Microsystems). Sections were fixed for 30min in 4%PFA at 4°C and the in situ protocol was performed according to the manufacturer instructions (Advanced Cell diagnostics). The following mouse probes were used: Mm-Lgr5 cat. No. 312171, Mm-Gli1 cat. No. 311001-C2, Mm-Axin2 cat no.400331-C3, Mm-Defensinβ6 cat no.430141-C3.
Human samples were fixed in 4% formalin and embedded in paraffin. Cut sections were deparaffinized and rehydrated before proceeding to the in situ hybridization performed according the manufacturer instructions. The following probes where used: Hs-Lgr5-C2 cat. No. 310991-C2, Hs-Lgr5 cat. No. 311021 and Hs-Axin2 cat no.400241-C3.
The confocal microscope LSM-780 (Carl Zeiss) and ZEN 2.3 software were used to acquire and analyse the ISH images.
Immunohistochemistry
For K14, Ki67, K10 and Lef1 immunohistochemistry in human samples, paraffin sections were deparaffinized, rehydrated, followed by antigen unmasking performed for 20 min at 98 °C in citrate buffer (pH 6) using the PT module. Endogenous peroxidase was blocked using 3% H2O2 (Merck) in methanol for 10 min at room temperature. Endogenous avidin and biotin were blocked using the Endogenous Blocking kit (Invitrogen) for 20 min at room temperature. Nonspecific antigen blocking was performed using blocking buffer. Mouse anti-K14 (rabbit, 1/2000, Thermofisher), anti-Ki67 (rabbit, 1/400, Abcam, ab15580), anti-Keratin10 (rabbit, 1/200, Biolegend, ref.90541) and anti-Lef1 (rabbit, 1/100, Cell Signaling, ref.2230) were incubated overnight at 4 °C. Anti-rabbit biotinylated with blocking buffer, Standard ABC kit, and ImmPACT DAB (Vector Laboratories) was used for the detection of horseradish peroxidase (HRP) activity. Slides were then dehydrated and mounted using SafeMount (Labonord).
FACS Isolation of tumour cells and microarray analysis
Isolation of tumour cells were performed as previously described34. Briefly, Lgr5-DTR-GFP and K14-CreER/Ptch1fl/fl/Lgr5-DTR-GFP mice untreated and upon 8 weeks of vismodegib treatment were sacrificed. Back skin was placed in a petri dish and sterile scalpel was used to remove the adipose tissue and muscle. The skin tissue was incubated with thermolysin (Sigma) for 1h at 37°C and after a scalpel was used to separate epidermis from the dermis. The epidermal tissue was chopped in little pieces and resuspended in PBS supplemented with 5% chelated fetal calf serum and filtered in 70um and 40um cell strainers (BD). Cells were stained using the anti-Lrig1 (goat polyclonal, R&D) followed by the secondary antibody donkey anti-Goat-Alexa 647 (Invitrogen).
Lrg5+Lrig1+ and Lgr5-Lrig1+ cells from untreated K14-CreER/Ptch1fl/fl/Lgr5-DTR-GFP animals and 8 weeks treated with vismodegib mice were sorted using Lrig1 staining and native Lgr5-GFP. 2000-sorted cells per sample were collected directly in 45 μl of lysis buffer (20 mM DTT, 10 mM Tris–HCl pH 7.4, 0.5% SDS, 0.5 μg μl–1 proteinase K). Samples were then lysed at 65 °C for 15 min and frozen. RNA isolation, amplification and microarray were performed at the IRB Functional Genomics Core, Barcelona. cDNA synthesis, library preparation and amplification were performed as described 35. Microarrays using Mouse Genome 430 PM strip Affymetrix array were performed and the data was normalized using RMA algorithm. Biological duplicates were performed for all conditions. Genetic signatures were obtained by considering genes presenting a fold change greater or smaller than 2 or –2, respectively, in each replicates.
FACS isolation of CD71+ and CD71- populations of tumour cells, RNA extraction and quantitative PCR
Isolation of TCs from mouse skin was performed as described in the previous section. Cells were stained using the anti-Lrig1 (goat polyclonal, R&D) and anti-CD71-PE (rat, BD) followed by the secondary antibody donkey anti-Goat-Alexa 647 (Invitrogen). 7000 FACS sorted cells were harvested directly in the lysis buffer provided by the manufacturer (RNAeasy Microkit, Quiagen) and RNA extraction was then carried out according to the manufacturer's protocol. Purified RNA was used to synthesize the first-strand complementary DNA using SuperScript II (Invitrogen) with random hexamers (Roche). Quantitative PCR analyses were carried out with Light Cycler 96 (Roche). Primers used: Ki67-F: CCTGCCTCAGATGGCTCAAA, Ki67-R: GGTTCCCTGTAACTGCTCCC, Aurka-F: AACACAACGCAAGCCAAAGG, Aurka-R: GGCCAGTTGGAGGTTTGGAA, K10-F: AACTGACAATGCCAACGTGC, K10-R: TAGGTAGGCCAGCTCTTCGT, K1-F: ACAACCCGGACCCAAAACTT, K1-R: CTCTGCGTTGGTCCTCTTGT, SCD1-F: ACACCATGGCGTTCCAGAAT and SCD1-R: AGCTTCTCGGCTTTCAGGTC. Normalizers: HPRT-F: GCAGTACAGCCCCAAAATGG, HPRT-R: TCCAACAAAGTCTGGCCTGT, βActin-F: GAAGCTGTGCTATGTTGCTCTA, βActin-R: CAATAGTGATGACCTGGCCGT, β2M-F: TCACCCCCACTGAGACTGAT, β2M-R: TCCCAGTAGACGGTCTTGGG, Gapdh-F: CGTGTTCCTACCCCCAATGT, Gapdh-R: GTGTAGCCCAAGATGCCCTT, Tbox-F: GTACCGCAGCTTCAAAATATTGTAT and Tbox-R: AAATCAACGCAGTTGTGCGTG
Sequencing of the Smo gene in vismodegib-persistent lesions
A total of 200.000 Lgr5+Lrig1+ TCs from 3 Ptch1cKO mice treated for 8 weeks with vismodegib were FACS-sorted following the same protocol described above. Exons 3- 12 of the mouse Smo gene were amplified using PCR and the products of the PCR were purified using the Monarch DNA Gel Extraction Kit (ref. T1020). The products of the PCR were sequenced following the Sanger standard using chemistry BigDy31.1, the cycle sequencing technology based on dideoxy chain termination/cycle sequencing and performed on ABI 3730XL sequencer. SnapGene version 4.1.3 was used for the analysis. Description of the the amplification primers used and sequencing results can be found in Source Data.
Grafting experiments
For transplantation experiments 100.000 cells previously FACS-sorted to obtain pure populations of Lgr5+Lrig1+ and Lgr5-Lrig1+ cells were transplanted in the interscapular fat pad of nod-scid immunodeficient mice. The 100.000 cells Lgr5+Lrig1+ and Lgr5-Lrig1+ cells were mixed in a proportion 1/40 tumour associated fibroblasts from the same tumours (FACS sorted using CD140a marker). The tumour cells and fibroblasts were embedded in 50μl of matrigel containing ROCK-inhibitor (3.3μg/ml) and transplanted in the fat pad.
GSEA analysis
The GSEA program was downloaded from the BROAD institute website (http://www.broadinstitute.org/gsea/). We used the GSEA preranked option with standard parameters of weighted enrichment score calculation to run the GSEA against a user-supplied fold-change-ranked list of genes. Results of the enrichment analysis were plotted using R software
Ptch1 deletion
To determine the deletion of the two Ptch1 alleles in the Lgr5+Lrig1+ and Lgr5-Lrig1+ populations 200.000 cells were FACS-sorted and DNA was extracted using the QiAmp DNA Mini-Kit (Qiagen). The following primers Forward: AAAGAGATCTTGTGGGCAAGG, Reverse:CTACTTCCATTTGTCACGTCC were used to determine the presence of the floxed/floxed or deleted alleles.
Extended Data
Extended Data Fig 1. Vismodegib leads to tumour shrinkage and emergence of vismodegib-persistent lesions in mice.
(a) Immunostaining for SmoM2-YFP, K14 and β4-integrin in tail from SmoM2 mice at different time points following vismodegib administration. (b) Tumour burden in μm (total area occupied by tumours divided by the length of the analysed epidermis) in untreated and vismodegib-treated SmoM2 mice (n=3 mice analysed per time point and condition). Centre values define the mean. Description of the skin length and tumour area analysed per mouse in Source Data.(c) Immunostaining for K14 and β4-integrin in ventral skin from Ptch1cKO mice (d) Immunostaining for SmoM2, Keratin-14 and β4-integrin in tail skin from SmoM2 mice.(e) Quantification of the lesion type upon vismodegib treatment in SmoM2 mice (n= 3 mice, total number of lesions analysed per time point indicated in parenthesis). Histograms represent the mean and error bars the s.e.m. (f) Immunostaining for active caspase-3 (AC3) and SmoM2. (g) Percentage of AC3+ TCs in untreated and vismodegib-treated SmoM2 mice (n=30 lesions analysed from 3 mice). Mean +/- s.e.m. Two-sided t-test.(h) Immunostaining for Ki67 and SmoM2. (i) Percentage of Ki67+ TCs in untreated and vismodegib-treated SmoM2 mice (n=30 lesions analysed from 3 mice). Mean +/- s.e.m. Two-sided t-test. Three independent experiments per condition were analysed showing similar results in a, c, d, f and h. Hoechst nuclear staining in blue; scale bars, 100 μm in c and d, 50 μm in a, f and h. IFE: interfollicular epidermis, BCC: basal cell carcinoma, HF: hair follicle, Dys: dysplasia. Dashed line delineates basal lamina. Arrows indicate vismodegib-persistent lesions.
Extended Data Fig 2. Vismodegib-persistent lesions express Lgr5 in mice.
(a) Immunostaining for GFP and K14 at different time points post tamoxifen administration in the K14CreER/Ptch1cKO/Lgr5-DTR-GFP mice. (b) In situ hybridization for Lgr5 and Gli1 in untreated and treated TCs in SmoM2 mice. (c) Percentage of TCs (Lgr5+ and Lgr5-) that express Gli1 in SmoM2 mice (n=3 mice, total number of cells analysed indicated in parenthesis). Mean +/- s.e.m. (d) Distribution of the number of Gli1-mRNA-dot per TC with and without treatment in SmoM2 mice (n=104 and 111 total TCs from 3 mouse per condition and time point). Mean +/- s.e.m. (e) Representation of the mouse Smo gene, in red the exons (E) in which genetic mutations have been described6,7 (upper panel). Results from the sequencing of the exon 7 from vismodegib-persistent lesions obtained by pooling drug-persistent cells from 3 mice, showing absence of genetic mutations in the exon analysed (lower panel). See Source data for sequencing results of exons 3-12. (f) Protocol for BrdU/EdU double labelling studies in BCC followed by vismodegib administration and discontinuation in the Ptch1cKO-induced BCCs. (g) Immunostaining for GFP, BrdU and EdU mice following 5 days of vismodegib discontinuation in Ptch1cKO/Lgr5-DTR-GFP-derived BCCs. (h) Protocol for vismodegib and RA or TPA treatment. (i) Immunostaining for GFP, Ki67 and β4 in the back skin of Ptch1cKO/Lgr5-DTR-GFP animals treated with vismodegib and RA or TPA. (j) Quantification of the number of Lgr5+ tumorigenic lesions per length of skin upon vismodegib and vismodegib with RA or TPA treatment (n= 3 Ptch1cKO/Lgr5-DTR-GFP mice, 3mm of skin analysed per mouse). Two-sided t-test. (k)Immunostaining for GFP and Lrig1 in untreated and treated Ptch1cKO/Lgr5-DTR-GFP mice. (l)Immunostaining for GFP and Lrig1 in untreated and 8 weeks vismodegib treated mice before and after enzymatic and physical separation of epidermis from dermis in Ptch1cKO/Lgr5-DTR-GFP mice. Note that HF co-expressing Lgr5 and Lrig1 and the sebaceous cysts remained in the dermal fraction whereas the BCCs were isolated with the epidermal fraction, indicating that the normal HF did not significantly contaminate the FACS isolated TCs.(m) Cell sorting strategy to isolate Lgr5+Lrig1-, Lgr5+Lrig1+ and Lgr5-Lrig1+ in normal skin and in Ptch1cKO/Lgr5-DTR-GFP-derived BCCs before and after vismodegib administration. Forward scatter (FSC) and side scatter (SSC) were performed to exclude cell debris and doublets. Living cells were selected by Hoechst dye exclusion. Finally, the different Lgr5 and Lrig1 cell populations were isolated by FACS sorting. A: area; W: width. (n) Proportion of cells presenting Lgr5-GFP and Lrig1 expression determined by FACS (n=3 independent experiments per condition). Histograms represent the mean and error bars de s.e.m. These experiments indicate that Lrig1 can be used to discriminate between Lgr5+ cells coming from the HFSC or lower HF (Lgr5+Lrig1-) from BCC cells (Lgr5+Lrig1+). Three independent experiments per condition were analysed showing similar results in a, k and l. Hoechst nuclear staining in blue; scale bars, 50 μm in a, i, k and l and 25 μm in b. Dashed line delineates basal lamina separating IFE from the dermis. Dotted line delineates BCC. Arrow indicates vismodegib-persistent lesion.
Extended Data Fig. 3. Characterization of Lgr5+Lrig1+ and Lgr5-Lrig1+ TCs.
(a) GSEA showing the enrichment of genes upregulated in Lgr5+Lrig1+ compared to Lrg5-Lrig1+ population from 2 independent microarray experiments with the EHFP 15 (left) in telogen HFSC 16 (middle) and HF Lgr5-expressing cell signatures17 (right), showing that Lgr5-expressing BCC cells express many genes of the embryonic and adult HF signatures. The normalized enrichment score (NES) and p value (one-sided test) were calculated using the GSEA program (b) mRNA expression of genes upregulated in Lgr5+Lrig1+ TC population compared to Lgr5-Lrig1+ TC population in untreated conditions (n=2 independent microarray experiments). (c) Immunostaining for GFP and Lef1, Lhx2, Cux1, Tbx1 and Alcam in untreated Ptch1cKO/Lgr5-DTR-GFP-derived BCC. Venn diagram showing the similarities and the differences between the genes upregulated more than 2-fold from 2 independent microarray experiments in Lgr5-Lrig1+vs Lgr5+Lrig1+ compared to IFE 16 and Lrig1 13 signatures. p value was calculated using the hypergeometric test for each intersection of two subsets of genes with phyper function in R software. The high overlap indicates that Lgr5-Lrig1+ cells expressed IFE and infundibulum differentiation markers mRNA expression of genes upregulated in Lgr5-Lrig1+ TCs compared to Lgr5+Lrig1+ in untreated conditions (n= 2 independent microarray experiments) (f) PCR analysis of the recombination of the floxed Ptch1 alleles in control samples and in FACS-isolated tumour-derived Lgr5+Lrig1+ and Lgr5-Lrig1+ populations from Ptch1cKO-induced BCCs. Two technical replicates were analysed for each sample showing similar results. (g) Immunostaining for GFP Lrig1 and Ki67 in Ptch1cKO/Lgr5-DTR-GFP-derived BCC shows higher proliferation rate in Lgr5+ as compared to Lgr5-Lrig1+ tumour cells. Three independent experiments per condition were analysed showing similar results (c,g).Hoechst nuclear staining in blue; scale bars, 50 μm.
Extended Data Fig. 4. Transplantation of Lgr5+Lrig1+ Ptch1/p53 double cKO BCC cells leads to the formation of BCC-like structures.
(a) Table summarizing the number of grafted mice that presented K14+ BCC-like structures upon transplantation of FACS-isolated Lgr5+Lrig1+ and Lgr5-Lrig1+ cells from BCCs arising in K14-CreER/Ptch1cKO/Lgr5-DTR-GFP and K14-CreER/Ptch1cKO/p53cKO/Lgr5-DTR-GFP mice. (b-c) Immunostaining for GFP, K14 and Lrig1 (b) and for GFP and K10 (c) in the BCC-like structures obtained upon transplantation of Lgr5+Lrig1+ cells from Ptch1/p53 double cKO/Lgr5-DTR-GFP BCCs in the dorsal fat pad of NOD/SCID mice. Three independent experiments per condition were analysed showing similar results (b and c). Hoechst nuclear staining in blue; scale bars, 50 μm.
Extended Data Fig. 5. Vismodegib-persistent lesions do not present decreased primary cilia number or nuclear localization of MKL1.
(a-b)Immunostaining for ARL13b and GFP in Ptch1cKO/Lgr5-DTR-GFP model (a) and for ARL13b and SmoM2 in SmoM2 model (b) in untreated and vismodegib-treated lesions. (c,d)Immunostaining for MKL1 and GFP in the vismodegib-persistent lesions in Ptch1cKO/Lgr5-DTR-GFP model (c) and for MKL1 and SmoM2 in vismodegib-persistent lesions from the SmoM2 model (d) mice treated for 8 weeks with vismodegib. Three independent experiments per condition were analysed showing similar results (a-d). Scale bars, 25 μm.
Extended Data Fig. 6. Vismodegib promotes BCC differentiation.
(a) Immunostaining for GFP, Lhx2 and Alcam in untreated and vismodegib treated Ptch1cKO/Lgr5-DTR-GFP-derived BCCs. (b) GSEA showing the enrichment of genes upregulated in Lgr5+Lrig1+ vismodegib-treated compared to untreated BCC with IFE16 and Lrig113 signatures in vismodegib treated tumours, showing that vismodegib treatment promotes the expression of the IFE and infundibulum signature. The normalized enrichment score (NES) and p value (one-sided test) were calculated using the GSEA program. (c) Oil-Red-O and hematoxylin/eosin staining in ventral skin of untreated and vismodegib-treated Ptch1cKO/Lgr5-DTR-GFP mice. Arrow indicates areas of sebaceous differentiation. (d) Immunostaining for GFP and Adipophilin (Adipo) in untreated and vismodegib-treated Ptch1cKO/Lgr5-DTR-GFP-derived BCCs. Arrow indicates areas of sebaceous differentiation (e) In situ hybridization for Lgr5 and Defensin-β6 in untreated and vismodegib-treated Ptch1cKO-derived BCCs.(f) Immunostaining for Keratin-1 (K1) and SmoM2 in untreated and vismodegib-treated SmoM2 mice. Three independent experiments per condition were analysed showing similar results (a,c,d,e,f).Hoechst nuclear staining in blue; scale bars, 50 μm.
Extended Data Fig. 7. Vismodegib promotes differentiation of SmoM2-expressing cells during BCC initiation and in Ptch1cKO tumor cells.
(a) Protocol for tumour induction and timing of vismodegib administration to K14-CreER/Rosa-SmoM2 mice. (b) Quantification of surviving SmoM2 clones in the interscale (tail epidermis) in untreated and at different time points following vismodegib administration (n=3 mice per time point and condition). Centre values define the mean. Description of the total number of clones counted per time point and condition can be found in Source Data. (c) Immunostaining of K31 and SmoM2 in whole mount tail skin (left panel) and orthogonal view of the clones highlighted in the upper panel stained with β 4-integrin and SmoM2 (left panel). (d) Quantification of the type of SmoM2-expressing clones at different time points following vismodegib administration (n= 3 or 4 mice as indicated in the graph, total number of lesions quantified indicated in parenthesis. Mean +/- s.e.m. (e-f) Immunostaining for K10 and SmoM2 (e) and for Lhx2 and SmoM2 (f) in untreated and vismodegib-treated mice. Three independent experiments per condition were analysed showing similar results in e and f.(g) mRNA expression of genes upregulated in the Lgr5+Lrig1+CD71+ population compared to Lgr5+Lrig1+CD71- population obtained by quantitative-PCR (n= 3 mice). Bars represent the average fold change over Lgr5+Lrig1+CD71- cells and error bars the s.e.m (h) Immunostaining for GFP, BrdU and K10 in mice that received three injections of BrdU followed by two weeks of vismodegib administration in Ptch1cKO//Lgr5-DTR-GFP-derived BCCs. Three independent experiments per condition were analysed showing similar results (h). Hoechst nuclear staining in blue; scale bars, 100 μm in c and 50μm in e, f and h.
Extended Data Fig. 8. Lgr5 is expressed in human vismodegib-persistent lesions.
(a) Table summarizing both the BCC and treatment characteristics in the patients analyzed. (b) Immunohistochemistry for K14 in biopsies before, after and during after vismodegib treatment. (c) In situ hybridization for LGR5 and GLI1 in biopsies from patients before, upon and after vismodegib treatment. (d) Percentage of tumour cells (Lgr5+ and Lgr5-) that express GLI1 in biopsies from patients, upon and after vismodegib Gli1 (n=3 samples from different patients (Patients 1-3) or body locations (Patient 4), total number of cells analysed indicated in parenthesis). Mean +/- s.e.m. (e-f) Immunohistochemistry for Ki67(e)and K10 (f) in biopsies before, during and during vismodegib treatment. Hoechst nuclear staining in blue; scale bars, 25 μm.
Extended Data Fig. 9. Lgr5 lineage ablation leads to BCC shrinkage and elimination of vismodegib-persistent lesions.
(a) Protocol for tamoxifen and diphtheria toxin (DT) administration. (b,c) Immunostaining for K14 and GFP in the Ptch1cKO/Lgr5-DTR-GFP model (b) and for K14 and SmoM2 in SmoM2-model (c) at different time points upon DT administration. (d) Quantification of tumour burden in untreated and following DT administration (n=3 mice per time point and condition). Centre values define the mean. Description of the skin length and tumour area analysed per mouse in Source Data.(e) Number of GFP positive TCs in untreated conditions and following DT administration (n=3 Ptch1cKO/Lgr5-DTR-GFP mice per time point and condition, 1mm of skin analysed per mouse).Centre values define the mean.(f) Quantification of tumour burden (SmoM2-expressing cells) in untreated conditions and following (n=3 mice per time point and condition). Centre values define the mean. Description of the skin length and tumour area analysed per mouse in Source Data.(g) Immunostaining for active caspase3 (AC3) and GFP (upper panel) and for active caspase-3 and SmoM2 (lower panel) after 5 times of DT administration. Three independent experiments per condition were analysed showing similar results. (h) Experimental strategy for combination of vismodegib treatment and Lgr5 ablation in K14-CreER/Ptch1cKO/Lgr5-DTR-GFP mice.(i) Immunostaining for GFP and K14 in the upon treatment, Lgr5 ablation and discontinuation in Ptch1cKO/Lgr5-DTR-GFP mice. (j) Immunostaining for active caspase-3 and GFP following vismodegib+DT administration in Ptch1cKO/Lgr5-DTR-GFP mice. (k) Quantification of the number of GFP positive cells in the different experimental conditions upon treatment and discontinuation (n=3 Ptch1cKO/Lgr5-DTR-GFP mice, 3mm of skin analysed per mouse). Mean+/-s.e.m. Two-sided t-test. (l) Quantification of the number of Lgr5+ lesions per length of epidermis (mm) in mice treated with vismodegib and upon vismodegib +DT treatment discontinuation (n=3 Ptch1cKO/Lgr5-DTR-GFP mice, 3mm of skin analysed per mouse). Mean+/-s.e.m. Two-sided t-test. Hoechst nuclear staining in blue; scale bars, 50 μm. IFE: interfollicular epidermis, BCC: basal cell carcinoma, HF: hair follicle. Dashed line delineates basal lamina separating IFE from the dermis. Dotted line delineates BCC. Arrow indicates tumorigenic lesions in b, c and indicates vismodegib-persistent lesion in i.
Extended Data Fig. 10. Wnt signalling is active in mouse and human vismodegib-persistent lesions.
(a) In situ hybridization for Lgr5 and Axin2 in untreated and vismodegib-treated lesions from Ptch1cKO and SmoM2 mice.(b) In situ hybridization for LGR5 and AXIN2 in biopsies from patients before, during and after vismodegib treatment. (c) Immunostaining for Lef1 and GFP in Ptch1cKO/Lgr5-DTR-FP-derived tumorigenic lesion following vismodegib+ LGK-974 treatment. (d) Protocol used for LGK-974 treatment in Ptch1cKO/Lgr5-DTR-GFP mice (e) Immunostaining for GFP and K14 in BCC treated with LGK-974 for 9 days from the Ptch1cKO/Lgr5-DTR-GFP model. (f) Quantification of the tumour burden in BCC treated with LGK-974 for 9 days and untreated (n=3 Ptch1cKO/Lgr5-DTR-GFP mice). Description of the skin length and tumour area analysed per mouse in Source Data. Two-sided t-test. Mean+/- s.e.m. Three independent experiments per condition were analysed showing similar results (a,e) and two technical replicates were performed for each sample showing similar results (b).Hoechst nuclear staining in blue; scale bars, 25 μm. IFE: interfollicular epidermis, BCC: basal cell carcinoma, HF: hair follicle. Dashed line delineates basal lamina separating IFE from the dermis. Dotted line delineates BCC.
Extended Data Fig. 11. Model.
Vismodegib administration promotes tumour cell differentiation leading to BCC regression. However, upon vismodegib a little proportion of Lgr5+ BCC cells persist forming vismodegib-tolerant lesions that are slow-cycling and characterised by Wnt signalling activation. Vismodegib discontinuation results in proliferation of Lgr5-persistent lesions leading to BCC relapse. Vismodegib treatment in combination with Lgr5 lineage ablation or Wnt signalling inhibition results in BCC eradication.
Supplementary Material
Acknowledgments
We would like to thank J-M. Vanderwinden and M.Martens (LiMiF) for the help with confocal microscopy. C.B. is an investigator of WELBIO. A.S-D. and JC.L. are supported by a fellowship of the FNRS and FRIA respectively. This work was supported by the FNRS, Marian Family, the ULB fondation, the foundation Baillet Latour, and a consolidator grant of the European Research Council.
Footnotes
Data availability. Data associated with this study have been deposited in the NCBI Gene Expression Omnibus under accession number GSE117458 (microarray).
Author Contribution
A.S-D. and C.B. designed the experiments, performed data analysis and wrote the manuscript; A.S-D performed most of the biological experiments; J.C.L, G.L and V.K helped with Lgr5 ablation experiments; M.L. performed immunostainings; C.D. performed FACS sorting; E.M-C, M.S, V.dM and J.T provided the patient samples and A.B performed the GSEA analysis.
Competing Interests
C.B. is a consultant at Genentech (San Francisco, USA)
Reprints and permissions information is available at http://www.nature.com/ reprints.
References
- 1.Epstein EH. Basal cell carcinomas: attack of the hedgehog. Nat Rev Cancer. 2008;8:743–754. doi: 10.1038/nrc2503. [DOI] [PMC free article] [PubMed] [Google Scholar]
- 2.Basset-Seguin N, Sharpe HJ, de Sauvage FJ. Efficacy of Hedgehog pathway inhibitors in Basal cell carcinoma. Mol Cancer Ther. 2015;14:633–641. doi: 10.1158/1535-7163.MCT-14-0703. [DOI] [PubMed] [Google Scholar]
- 3.Sekulic A, et al. Efficacy and safety of vismodegib in advanced basal-cell carcinoma. N Engl J Med. 2012;366:2171–2179. doi: 10.1056/NEJMoa1113713. [DOI] [PMC free article] [PubMed] [Google Scholar]
- 4.Kasper M, Jaks V, Hohl D, Toftgard R. Basal cell carcinoma - molecular biology and potential new therapies. J Clin Invest. 2012;122:455–463. doi: 10.1172/JCI58779. [DOI] [PMC free article] [PubMed] [Google Scholar]
- 5.Tang JY, et al. Inhibition of the hedgehog pathway in patients with basal-cell nevus syndrome: final results from the multicentre, randomised, double-blind, placebo-controlled, phase 2 trial. Lancet Oncol. 2016;17:1720–1731. doi: 10.1016/S1470-2045(16)30566-6. [DOI] [PubMed] [Google Scholar]
- 6.Atwood SX, et al. Smoothened variants explain the majority of drug resistance in basal cell carcinoma. Cancer Cell. 2015;27:342–353. doi: 10.1016/j.ccell.2015.02.002. [DOI] [PMC free article] [PubMed] [Google Scholar]
- 7.Sharpe HJ, et al. Genomic analysis of smoothened inhibitor resistance in basal cell carcinoma. Cancer Cell. 2015;27:327–341. doi: 10.1016/j.ccell.2015.02.001. [DOI] [PMC free article] [PubMed] [Google Scholar]
- 8.Youssef KK, et al. Identification of the cell lineage at the origin of basal cell carcinoma. Nat Cell Biol. 2010;12:299–305. doi: 10.1038/ncb2031. [DOI] [PubMed] [Google Scholar]
- 9.Youssef KK, et al. Adult interfollicular tumour-initiating cells are reprogrammed into an embryonic hair follicle progenitor-like fate during basal cell carcinoma initiation. Nat Cell Biol. 2012;14:1282–1294. doi: 10.1038/ncb2628. [DOI] [PubMed] [Google Scholar]
- 10.Brown JA, et al. TGF-beta-Induced Quiescence Mediates Chemoresistance of Tumor-Propagating Cells in Squamous Cell Carcinoma. Cell Stem Cell. 2017;21:650–664 e658. doi: 10.1016/j.stem.2017.10.001. [DOI] [PMC free article] [PubMed] [Google Scholar]
- 11.Barker N, Tan S, Clevers H. Lgr proteins in epithelial stem cell biology. Development. 2013;140:2484–2494. doi: 10.1242/dev.083113. [DOI] [PubMed] [Google Scholar]
- 12.Tian H, et al. A reserve stem cell population in small intestine renders Lgr5-positive cells dispensable. Nature. 2011;478:255–259. doi: 10.1038/nature10408. [DOI] [PMC free article] [PubMed] [Google Scholar]
- 13.Page ME, Lombard P, Ng F, Gottgens B, Jensen KB. The epidermis comprises autonomous compartments maintained by distinct stem cell populations. Cell Stem Cell. 2013;13:471–482. doi: 10.1016/j.stem.2013.07.010. [DOI] [PMC free article] [PubMed] [Google Scholar]
- 14.Yang SH, et al. Pathological responses to oncogenic Hedgehog signaling in skin are dependent on canonical Wnt/beta3-catenin signaling. Nat Genet. 2008;40:1130–1135. doi: 10.1038/ng.192. [DOI] [PMC free article] [PubMed] [Google Scholar]
- 15.Rhee H, Polak L, Fuchs E. Lhx2 maintains stem cell character in hair follicles. Science. 2006;312:1946–1949. doi: 10.1126/science.1128004. [DOI] [PMC free article] [PubMed] [Google Scholar]
- 16.Blanpain C, Lowry WE, Geoghegan A, Polak L, Fuchs E. Self-renewal, multipotency, and the existence of two cell populations within an epithelial stem cell niche. Cell. 2004;118:635–648. doi: 10.1016/j.cell.2004.08.012. [DOI] [PubMed] [Google Scholar]
- 17.Latil M, et al. Cell-Type-Specific Chromatin States Differentially Prime Squamous Cell Carcinoma Tumor-Initiating Cells for Epithelial to Mesenchymal Transition. Cell Stem Cell. 2017;20:191–204 e195. doi: 10.1016/j.stem.2016.10.018. [DOI] [PMC free article] [PubMed] [Google Scholar]
- 18.Sanchez-Danes A, et al. Defining the clonal dynamics leading to mouse skin tumour initiation. Nature. 2016;536:298–303. doi: 10.1038/nature19069. [DOI] [PMC free article] [PubMed] [Google Scholar]
- 19.Zhao X, et al. A Transposon Screen Identifies Loss of Primary Cilia as a Mechanism of Resistance to SMO Inhibitors. Cancer Discov. 2017;7:1436–1449. doi: 10.1158/2159-8290.CD-17-0281. [DOI] [PubMed] [Google Scholar]
- 20.Whitson RJ, et al. Noncanonical hedgehog pathway activation through SRF-MKL1 promotes drug resistance in basal cell carcinomas. Nat Med. 2018;24:271–281. doi: 10.1038/nm.4476. [DOI] [PMC free article] [PubMed] [Google Scholar]
- 21.Eberl M, et al. Tumor Architecture and Notch Signaling Modulate Drug Response in Basal Cell Carcinoma. Cancer Cell. 2018;33:229–243 e224. doi: 10.1016/j.ccell.2017.12.015. [DOI] [PMC free article] [PubMed] [Google Scholar]
- 22.Hoeck JD, et al. Stem cell plasticity enables hair regeneration following Lgr5(+) cell loss. Nat Cell Biol. 2017;19:666–676. doi: 10.1038/ncb3535. [DOI] [PubMed] [Google Scholar]
- 23.de Sousa e Melo F, et al. A distinct role for Lgr5+ stem cells in primary and metastatic colon cancer. Nature. 2017;543:676–680. doi: 10.1038/nature21713. [DOI] [PubMed] [Google Scholar]
- 24.Shimokawa M, et al. Visualization and targeting of LGR5(+) human colon cancer stem cells. Nature. 2017;545:187–192. doi: 10.1038/nature22081. [DOI] [PubMed] [Google Scholar]
- 25.Liu J, et al. Targeting Wnt-driven cancer through the inhibition of Porcupine by LGK974. Proc Natl Acad Sci U S A. 2013;110:20224–20229. doi: 10.1073/pnas.1314239110. [DOI] [PMC free article] [PubMed] [Google Scholar]
- 26.Northcott PA, et al. Medulloblastomics: the end of the beginning. Nat Rev Cancer. 2012;12:818–834. doi: 10.1038/nrc3410. [DOI] [PMC free article] [PubMed] [Google Scholar]
- 27.Vasioukhin V, Degenstein L, Wise B, Fuchs E. The magical touch: genome targeting in epidermal stem cells induced by tamoxifen application to mouse skin. Proc Natl Acad Sci U S A. 1999;96:8551–8556. doi: 10.1073/pnas.96.15.8551. [DOI] [PMC free article] [PubMed] [Google Scholar]
- 28.Uhmann A, et al. The Hedgehog receptor Patched controls lymphoid lineage commitment. Blood. 2007;110:1814–1823. doi: 10.1182/blood-2007-02-075648. [DOI] [PubMed] [Google Scholar]
- 29.Mao J, et al. A novel somatic mouse model to survey tumorigenic potential applied to the Hedgehog pathway. Cancer Res. 2006;66:10171–10178. doi: 10.1158/0008-5472.CAN-06-0657. [DOI] [PMC free article] [PubMed] [Google Scholar]
- 30.Jonkers J, et al. Synergistic tumor suppressor activity of BRCA2 and p53 in a conditional mouse model for breast cancer. Nat Genet. 2001;29:418–425. doi: 10.1038/ng747. [DOI] [PubMed] [Google Scholar]
- 31.Aldaz CM, Conti CJ, Gimenez IB, Slaga TJ, Klein-Szanto AJ. Cutaneous changes during prolonged application of 12-O-tetradecanoylphorbol-13-acetate on mouse skin and residual effects after cessation of treatment. Cancer Res. 1985;45:2753–2759. [PubMed] [Google Scholar]
- 32.Collins CA, Watt FM. Dynamic regulation of retinoic acid-binding proteins in developing, adult and neoplastic skin reveals roles for beta-catenin and Notch signalling. Dev Biol. 2008;324:55–67. doi: 10.1016/j.ydbio.2008.08.034. [DOI] [PubMed] [Google Scholar]
- 33.Braun KM, et al. Manipulation of stem cell proliferation and lineage commitment: visualisation of label-retaining cells in wholemounts of mouse epidermis. Development. 2003;130:5241–5255. doi: 10.1242/dev.00703. [DOI] [PubMed] [Google Scholar]
- 34.Jensen KB, Driskell RR, Watt FM. Assaying proliferation and differentiation capacity of stem cells using disaggregated adult mouse epidermis. Nat Protoc. 2010;5:898–911. doi: 10.1038/nprot.2010.39. [DOI] [PubMed] [Google Scholar]
- 35.Gonzalez-Roca E, et al. Accurate expression profiling of very small cell populations. PLoS One. 2010;5:e14418. doi: 10.1371/journal.pone.0014418. [DOI] [PMC free article] [PubMed] [Google Scholar]
Associated Data
This section collects any data citations, data availability statements, or supplementary materials included in this article.


