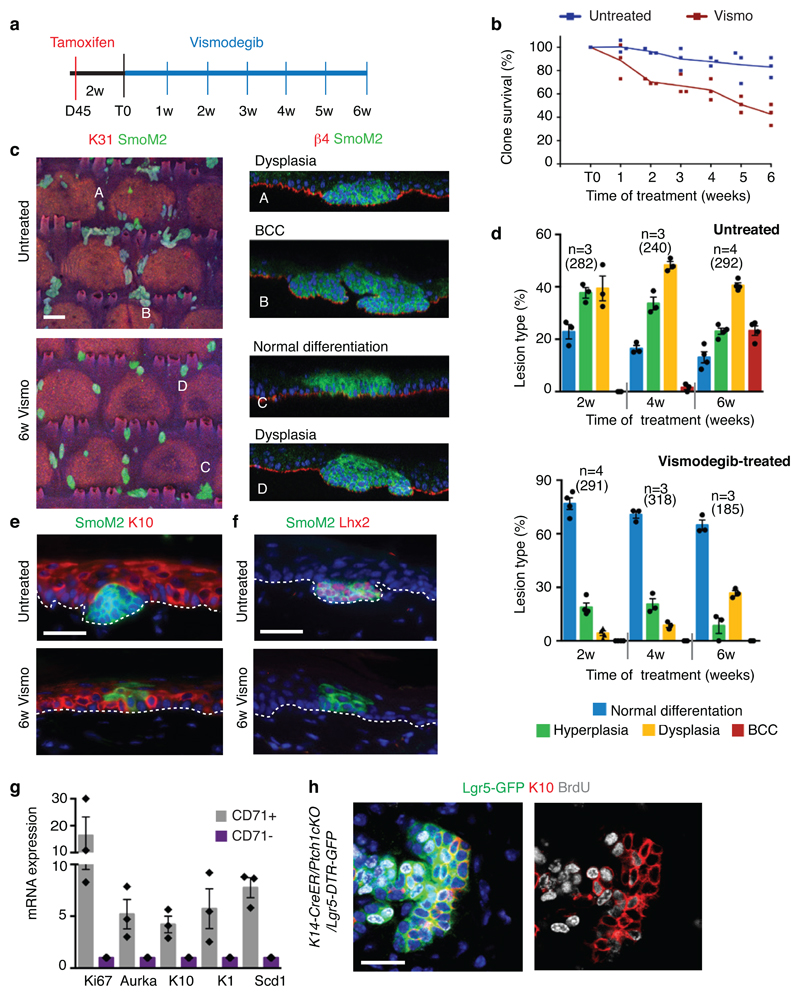
Extended Data Fig. 7. Vismodegib promotes differentiation of SmoM2-expressing cells during BCC initiation and in Ptch1cKO tumor cells.
(a) Protocol for tumour induction and timing of vismodegib administration to K14-CreER/Rosa-SmoM2 mice. (b) Quantification of surviving SmoM2 clones in the interscale (tail epidermis) in untreated and at different time points following vismodegib administration (n=3 mice per time point and condition). Centre values define the mean. Description of the total number of clones counted per time point and condition can be found in Source Data. (c) Immunostaining of K31 and SmoM2 in whole mount tail skin (left panel) and orthogonal view of the clones highlighted in the upper panel stained with β 4-integrin and SmoM2 (left panel). (d) Quantification of the type of SmoM2-expressing clones at different time points following vismodegib administration (n= 3 or 4 mice as indicated in the graph, total number of lesions quantified indicated in parenthesis. Mean +/- s.e.m. (e-f) Immunostaining for K10 and SmoM2 (e) and for Lhx2 and SmoM2 (f) in untreated and vismodegib-treated mice. Three independent experiments per condition were analysed showing similar results in e and f.(g) mRNA expression of genes upregulated in the Lgr5+Lrig1+CD71+ population compared to Lgr5+Lrig1+CD71- population obtained by quantitative-PCR (n= 3 mice). Bars represent the average fold change over Lgr5+Lrig1+CD71- cells and error bars the s.e.m (h) Immunostaining for GFP, BrdU and K10 in mice that received three injections of BrdU followed by two weeks of vismodegib administration in Ptch1cKO//Lgr5-DTR-GFP-derived BCCs. Three independent experiments per condition were analysed showing similar results (h). Hoechst nuclear staining in blue; scale bars, 100 μm in c and 50μm in e, f and h.

