

Abstract
The carcinogenesis of prostate cancer (PCa) in TRAMP model is highly correlated with hypermethylation in the promoter region of Nrf2 and the accompanying reduced transcription of Nrf2 and its regulated detoxifying genes. We aimed to investigate the effects of (3E,5E)-3,5-Bis(3,4,5-trimethoxybenzylidene) - tetrahydrothiopyran-4-one (F10) and (3E,5E)-3,5-Bis(3,4,5-trimethoxybenzylidene) -tetrahydropyran-4- one (E10), two synthetic curcumin derivatives, on restoring Nrf2 activity in TRAMP C1 cells. HepG2-C8 cells transfected with an antioxidant-response element (ARE)-luciferase vector were treated with F10, E10, curcumin and sulforaphane (SFN) to compare their effects on Nrf2-ARE pathways. We performed Real-time quantitative PCR and western blotting to investigate the effects of F10 and E10 on Nrf2, correlated phase II detoxification genes. We also measured expression and activity of DNMTand HDAC enzymes. Enrichment of H3K27me3 on the promoter region of Nrf2 was explored with a chromatin immunoprecipitation (ChIP) assay. Methylation of the CpG region in Nrf2 promoter were doubly examined by bisulfite genomic sequencing (BGS) and methylation DNA immunoprecipitation (MeDIP). Compared with curcumin and SFN, F10 are more potent in activating Nrf2-ARE pathways. Both F10 and E10 enhanced level of Nrf2 and the correlated phase II detoxifying genes. BGS and MeDIP assays indicated that F10 but not E10 hypomethylated the Nrf2 promoter. F10 also downregulated the protein level of DNMT1, DNMT3a, DNMT3b, HDAC1, HDAC4, and HDAC7 and the activity of DNMTs and HDACs. F10 but not E10 effectively reduced the accumulation of H3k27me3 on the promoter of Nrf2. F10 and E10 can activate the Nrf2-ARE pathway and increase the level of Nrf2 and correlated phase II detoxification genes. The reactivation effect on Nrf2 by F10 in TRAMP C1 may come from demethylation, decrease of HDACs and inhibition of H3k27me3 accumulation.
Keywords: Nrf2, Prostate cancer, curcumin, H3k27me3, DNA methylation, TRAMP
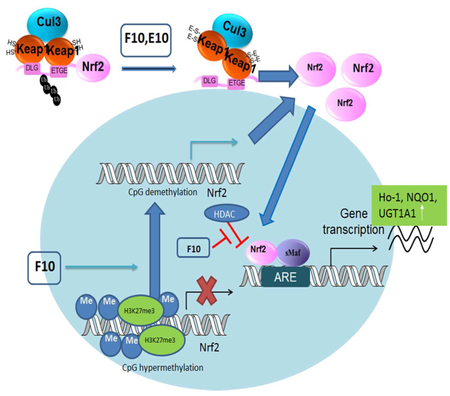
Graphical Abstract
Introduction
According to epidemiology studies, the frequency of diagnosis of prostate cancer (PCa) ranks second among all cancers in the USA.1 Like many other cancer types, it progresses from the benign to malignant stage due to genetic and epigenetic alterations.2 Compared to genetic factors, epigenetic changes are relatively reversible. In addition, epigenetic alterations are accepted as a major predictor of PCa significance by an increasing number of scientists.3 Aberrant methylation of many genes, such as GSTP1, RASSF1A, RARβ2 and galectin-3, is highly involved in PCa progression and can be found by early detection in tissue biopsies, serum and urine, and thus can be promising markers for PCa diagnosis and targeted therapies.4, 5
The antioxidant defense system normally exerts a positive cancer prevention effect; however, when this system is deregulated, it is one of the major promoting factors for toxicity and neoplastic progression of PCa.6, 7 Nuclear factor (erythroid-derived 2)-like 2 (Nrf2) is a basic-region leucine zipper (bZIP) transcription factor, which has been found to be a vital mediator in upregulating antioxidant-response element (ARE)-related phase II detoxifying and antioxidation gene transcription.8 These genes are closely regulated by Nrf2 and contribute to preservation from cellular invasion of ROS/RNS and active metabolites of carcinogens.
In a TRAMP model, we found that PCa carcinogenesis is highly associated with hypermethylation of the promoter region of Nrf2 and the consequent silencing of Nrf2 and the correlated phase II detoxification genes, comprising of NAD(P)H quinone dehydrogenase 1 (NQO1) and heme oxygenase-1 (HO-1) 9, 10 Many phytochemicals, including 3,3'-diindolylmethane (DIM), 11 sulforaphane (SFN)12, and tocopherols 13 have been demonstrated to restore Nrf2 expression by demethylating the CpG regions on the Nrf2 promoter and thus increasing its downstream phase II detoxifying and antioxidation genes and preventing PCa in the TRAMP model.
F10 ((3E,5E)-3,5-bis(3,4,5-trimethoxybenzylidene)-tetrahydrothiopyran-4-one) and E10 ((3E,5E)-3,5-bis(3,4,5-trimethoxybenzylidene) tetrahydropyran-4-one) are synthetic curcumin derivatives (Figure 1). They exhibited stronger inhibitory effects on human prostate cancer cells than curcumin through inhibition of androgen receptor activity.14 Structure activity relationship (SAR) analysis indicated the more potent anti-PCa cell effects of E10 and F10 may be related to the heteroatom structure.14 In addition, some additional groups on the aromatic rings such as a sulfur or oxygen heterocyclic ketone group, distal benzene rings and methoxy groups could enhance the effects further.15 However, the mechanism of E10 and F10 in inhibition of PCa progression is not clear. In our previous study, curcumin exerted its PCa preventive effect by epigenetically reactivating Nrf2 transcription and activating its downstream antioxidative pathway.9 In this project, we aimed to explore the potential mechanism of F10 and E10 in restoring Nrf2 expression via epigenetic regulation in TRAMP C1.
Figure 1.

Chemical structure of F10, ((3E,5E)-3,5-Bis(3,4,5-trimethoxybenzylidene) -tetrahydrothiopyran-4-one) and E10 ((3E,5E)-3,5-Bis(3,4,5-trimethoxybenzylidene) tetrahydropyran-4-one (E10)).
Materials and Methods
Reagents and Chemicals
Minimum essential medium (MEM), Dulbecco’s modified Eagle’s medium (DMEM), fetal bovine serum (FBS), penicillin-streptomycin (10,000 U/ml), versene and trypsin-EDTA were ordered from Gibco (Grand Island, NY, USA). A Cell-Titer 96 AQueous One Solution Cell Proliferation Assay Kit was obtained from Promega (Madison, WI). Platinum Taq DNA polymerase was purchased from Invitrogen (Grand Island, NY, USA). Tris-HCl precast gels, turbo transfer buffer, and PVDF membranes were obtained from Bio-Rad (Hercules, CA, USA). Tris-glycine-SDS running buffer and Super Signal enhanced chemiluminescent substrate were purchased from Boston BioProducts (Ashland, MA, USA) and Thermo (Rockford, IL, USA), respectively. Antibodies against Nrf2 (C-20), HO-1 (C-20), and NQO1 (H-90), UGT1A1 (V-19), and actin (I-19) were obtained from Santa Cruz Biotechnology (Santa Cruz, CA,USA). The protease inhibitor cocktail, radioimmunoprecipitation (RIPA) buffer, and antibodies against HDACs (HDAC1, HDAC2, HDAC3, HDAC4 and HDAC6) were supplied by Cell Signaling Technology (Beverly, MA). The anti-HDAC8 antibody was obtained from Proteintech Group (Chicago, IL), and the anti-NQO1, anti-HDAC7, anti-H3, anti-DNMT3a and anti-DNMT3b antibodies were from Abcam (Cambridge, MA,USA). Anti-DNMT1 was supplied by Novus Biologicals (Littleton, CO, USA). E10 and F10 (purity >95%) were obtained from Kun Zhang’s laboratory (Laboratory of Natural Medicinal Chemistry & Green Chemistry, Guangdong University of Technology, Guangzhou, China), which was synthesized by aldehyde and ketone in glacial acetic acid following published method.15 Dimethyl sulfoxide (DMSO), 5-aza deoxycytidine (5-aza), and trichostatin A (TSA) were from Sigma (St. Louis, MO, USA). All other chemicals, unless otherwise noted, were obtained from Sigma (St. Louis, MO, USA).
Cell Culture
Mouse prostate cancer cells TRAMP-C1 cells (ATCC- CRL-2730) were purchased from ATCC (Rockville, Maryland, USA) with certificate of analysis. The cells were cultured in DMEM (pH 7.0) containing 10% FBS at 37 °C in a humidified 5% CO2 atmosphere. The human hepatocellular HepG2-C8 cell line was previously established by stable transfection with an ARE-luciferase construct.16 The cells were cultured and maintained in DMEM supplemented with 10% FBS, 100 units/mL penicillin, and 100 μg/mL streptomycin. The treatment medium including 0.1% DMSO and drugs were changed every 2 days.
MTS Assay
TRAMP-C1 cells were seeded at a density of 1 × 10³ cells per 100 μL of medium per well in 96-well plates. After incubation for 24 h, the cells were treated with either 0.1% DMSO (control) or various concentrations of E10 and F10 in DMEM containing 1% FBS for 1, 3, or 5 days. Serially diluted E10 and F10 samples were dissolved in DMSO (final concentration in the medium of <0.1%), and the medium was changed every 2 days. Cell viability was estimated with a Cell-Titer 96 AQueous One Solution Cell Proliferation (MTS) assay kit (Promega, Madison, WI, USA) according to the manufacturer’s instructions.
Luciferase Reporter Activity Assay
The stably transfected HepG2-C8 cells expressing the ARE-luciferase vector were used to compare the effects of E10, F10, curcumin, and SFN on the Nrf2-ARE pathway. The ARE-luciferase activity in the HepG2-C8 cells was determined using a luciferase assay kit in accordance with the manufacturer’s instructions (Promega, Madison, WI, USA). Briefly, HepG2-ARE-C8 cells (1.0 × 10⁵ cells/well) were seeded in 12-well plates in 1 mL of medium containing 10% FBS, incubated for 24 h, and then treated with various concentrations of E10, F10, curcumin, and SFN. Afterwards, the cells were lysed using the reporter lysis buffer, and 10 μL of the cell lysate supernatant was analyzed for luciferase activity using a Sirius luminometer (Berthold Detection System GmbH, Pforzheim, Germany). Normalization of the luciferase activity was performed based on protein concentrations, which were determined using a BCA protein assay (Pierce Biotech, Rockford, IL, USA). The data were obtained from three independent experiments and are expressed as the inducible fold change compared with the vehicle control.
RNA Isolation and Quantitative Real-Time Polymerase Chain Reaction (qPCR)
TRAMP-C1 cells were seeded at a density of 1 × 10⁵ cells in 10 cm dishes with 10% FBS/DMEM. After 24 h, the cells were treated with DMEM containing 1% FBS with E10 (50 nM and 100 nM), F10 (50 nM and 100 nM) or with 0.1% DMSO as a control. The treatment medium was changed every 2 days. After the 3-day treatment, the total RNA was extracted from the cells using an RNeasy Mini Kit (QIAGEN, Valencia, CA). First-strand cDNA was synthesized from total RNA using a SuperScript III First-Strand Synthesis System (Invitrogen, Grand Island, NY, USA) according to the manufacturer’s instructions. mRNA expression levels were determined with quantitative real-time PCR (qPCR) using first-strand cDNA as a template and Power SYBR Green PCR Master Mix (Applied Biosystems, Carlsbad, CA, USA) in an ABI7900HT system. The following primer sequences for Nrf2, HO-1, NQO1, and UGT1A1 were used: Nrf2, 5-AGCAGGACTGGAGAAGTT-3′ (sense) and 5′-TTCTTTTTCCAGCGAGGAGA-3′ (antisense); HO-1, 5′-CCTCACTGGCAGGAAATCATC-3′ (sense) and 5′-CCTCGTGGAGACGCTTTACATA-3′(antisense); NQO1, 5 ′-AGCCCAGATATTGTGGCCG-3′ (sense) and 5′-CTTTCAGAATGGCTGGCAC-3′ (antisense); UGT1A1, 5′-GAAATTGCTGAGGCTTTGGGCAGA-3′ (sense) and 5 ′-ATGGGAGCCAGAGTGTGTGATGAA-3′ (antisense). β-Actin was used as an internal control with sense (5′-CGTTCAATACCCCAGCCATG-3′) and antisense (5′-ACCCCGTCACCAGAGTCC-3′) primers.
Preparation of Protein Lysates and Western Blotting
TRAMP-C1 cells were seeded at a density of 1 × 10⁵ cells in 10 cm dishes with 10% FBS/DMEM. After incubation for 24 h, the cells were treated with 0.1% DMSO as a control, E10 (50 nM and 100 nM) and F10 (50 nM and 100 nM). Following treatment for 3 days, the cells were washed with ice-cold PBS and harvested in ice-cold 1× RIPA buffer (Cell Signaling Technology, Danvers, MA, USA) containing a protein inhibitor cocktail (Sigma). The protein concentrations of the cell lysates were measured using the bicinchoninic acid (BCA) method (Pierce, Rockford, IL, USA). Identical concentrations of protein (20 μg) were subjected to 4 to 15% SDS-polyacrylamide gel (Bio-Rad, Hercules, CA, USA) electrophoresis (SDS-PAGE) and then transferred to PVDF membranes (Millipore, Billerica, MA, USA). The membranes were blocked with 5% BSA and sequentially incubated with specific primary antibodies and HRP-conjugated secondary antibodies. The antibody-bound proteins were visualized with SuperSignal West Femto Chemiluminescent Substrate (Thermo Scientific, Rockford, IL, USA) and measured with a Gel Documentation 2000 system (Bio-Rad).
Bisulfite Genomic Sequencing (BGS)
TRAMP-C1 cells (1 × 10⁵ cells per 10 cm dish) were treated with 0.1% DMSO as a control, E10 (50 nM and 100 nM), F10 (50 nM and 100 nM), and a combination of 5-aza (500 nM) and TSA (100 nM) for 3 days. Genomic DNA was then extracted from the cells with a QIAamp DNA Mini kit (Qiagen, Valencia, CA, USA). Then, 500 ng of genomic DNA was subjected to bisulfite conversion with an EZ DNA Methylation-Gold Kit (Zymo Research Corp., Orange, CA, USA) according to the manufacturer’s instructions. The converted DNA was amplified with Platinum Taq DNA polymerase (Invitrogen, Grand Island, NY, USA) and primers that amplify the first five CpGs of the murine Nrf2 gene. The primer sequences were 5′-AGTTATGAAGTAGTAGTAAAAA-3′ (sense) and 5′-AATATAATCTCATAAAACCCCAC-3′ (antisense). A TOPO TA Cloning kit (Invitrogen, Grand Island, NY, USA) was used to clone the PCR products into vector pCR4 TOPO. Plasmids containing PCR products from at least 10 colonies per treatment in three independent experiments were amplified and purified with a QIAprep Spin Miniprep kit (Qiagen), followed by sequencing (GeneWiz, South Plainfield, NJ, USA).
Nuclear Extraction, DNMTs and HDACs activity Assay
TRAMP-C1 cells (1 × 10⁵ cells per 10 cm dish) were treated with 0.1% DMSO as a control, E10 (50 nM and 100 nM) and F10 (50 nM and 100 nM) for 3 days. Nuclear extracts were isolated from control and treated cells by using the EpiQuik Nuclear Extraction Kit (Epigentek, Brooklyn, NY) according to the manufacturer's instructions. The protein concentration of nuclear extracts was measured by BCA Protein Assay Reagent (Pierce, Rockford, IL).
Total DNMTs activities of isolated nuclear proteins were quantified using a fluorimetric EpiQuick™ DNMT Activity/Inhibition Assay Ultra kit (Epigentek, Brooklyn, NY). One microliter (5–10 μg) of nuclear extracts and 49 μl of assay reagent were added to each well to test the activity of HDACs according to manufacturer instructions using a Tecan microplate reader plate reader (Infinite m200 pro; Mannedorf Switzerland) with an excitation wavelength of 530 nm and an emission wavelength of 590 nm. DNMTs activities were normalized by protein amount of each sample.
Total HDACs activities of isolated nuclear proteins were measured using a fluorometric Epigenase™ HDAC Activity/Inhibition Direct Assay Kit (Epigentek, Brooklyn, NY). One microliter (5–10 μg) of nuclear extracts and 49 μl of assay reagent were added to each well to test the activity of HDACs according to manufacturer instructions using a Tecan microplate reader plate reader (Infinite m200 pro; Mannedorf Switzerland) with an excitation wavelength of 530 nm and an emission wavelength of 590 nm. HDAC activities were normalized by protein amount of each sample.
Methylation DNA Immunoprecipitation (MeDIP) Analysis
To verify the DNA methylation changes, methylated DNA was captured and quantified using methylated DNA immunoprecipitation coupled with quantitative real-time polymerase chain reaction analysis (MeDIP-qPCR) based on a previously reported procedure, with some modification 12. In brief, the extracted DNA from treated cells was sonicated on ice to a fragment size of approximately 200–1000 base pairs using a Bioruptor sonicator (Diagenode Inc., Sparta, NJ, USA). The fragmented DNA was denatured at 95 °C for 2 min. Methylated DNA was isolated by immunoprecipitation with anti-5′-methylcytosine antibody using a Methylamp Methylated DNA capture kit (Epigentek, Farmingdale, NY, USA) according to the manufacturer’s manual. After final purification and elution, the methylation status was quantified by qPCR amplification of MeDIP-enriched DNA using the primer set 5′-GAGGTCACCACAACACGAAC-3′ (sense) and 5′-ATCTCATAAGGCCCCACCTC-3’ (antisense) to cover the DNA sequence of the first five CpGs of murine Nrf2. The enrichment of methylated DNA in each treatment was calculated according to the standard curve of the serial dilution of input DNA. The relative methylated DNA ratios were then calculated on the basis that the control presented 100% DNA methylation.
Chromatin Immunoprecipitation (ChIP) Assay
The ChIP assay was performed using a MAGnify TM Chromatin Immunoprecipitation System (ThermoFisher Scientific, Waltham, MA) following the manufacturer’s instructions. Briefly, after treatment with treated with 0.1% DMSO, E10 (50 nM and 100 nM) or F10 (50 nM and 100 nM) for 3 days, TRAMP-C1 cells were washed with PBS and trypsinized. After a PBS wash, the chromatin in these cells (100,000 cells were used per IP) were then cross-linked with 1% formaldehyde for 10 min at room temperature, sheared to an average length of 200–500 bp via sonication at 4 °C using a Bioruptor sonicator (Diagenode Inc., Sparta, NJ,USA) in lysis buffer. The diluted chromatin solution was immunoprecipitated with 2 μg of anti-trimethyl-histone H3-Lys27 (H3K27me3) antibody (Abcam) or mouse immunoglobulin G. After washing, cross-link reversal, DNA elution and DNA purification, the relative amount of immunoprecipitated DNA was quantified via qPCR using primer 1 with 5′-GTATCACTTCATCCACCCAGAG-3′(sense) and 5′-GTACGTGTAAAGGAACCCTGAG-3 ′ (antisense) and primer 2, 5′-GGGTTCCTTTACACGTACTTACTC-3′(sense) and 5′-GGTCACCACAACACGAACTAT-3′(antisense), which cover the promoter regions of Nrf2. The enrichment of the precipitated DNA was calibrated using the standard curve from the serial dilution of the inputs, and the data are presented as the fold changes in the signal-to-input ratio normalized to the control.
Statistical Analysis
The data are presented as the means ± the standard deviation of three independent experiments. One-way analysis of variance (ANOVA) and Duncan’s multiple-comparison test (SAS Institute Inc., Cary, NC) were performed to determine statistically significant differences among the means (p < 0.05).
Results
E10 and F10 Enhanced Nrf2 Expression by ARE-Luciferase Reporter Assay
The relative luciferase activity was analyzed in ARE-luciferase reporter vector transfected HepG2-C8 cells (Figure 2) by luciferase fluorescence signal normalized by protein expression. E10 and F10 both enhanced greater luciferase activity than the negative control (0.1% DMSO in medium) in direct proportion to concentration ranging from 50 to 1000 nM, which suggests that these two compounds can activate Nrf2 expression and hence increase the expression of the antioxidant /detoxification genes with an ARE sequence on their promoter regions. When comparing the activation efficacy in terms of luciferase signal normalized by protein concentration, F10 produced a much more powerful effect at 1000 nM than E10, curcumin and SFN.
Figure 2.

ARE-Luciferase activity assay in evaluating the potency of E10, F10, curcumin, and SFN in activating HepG2-C8 cells transfected with ARE-luciferase. The luciferase activity was normalized by cell lysate protein concentration. The data were summarized from 3 independent tests and are indicated as the relative fold change compared with control. *, p < 0.05; **, p < 0.01 compared with the control.
E10 and F10 Induced TRAMP-C1 Cytotoxicity
Based on MTS assays, E10 and F10 were found to diminish the viability of TRAMP-C1 cells in direct proportion to time and drug concentration after 24h, 72h, and 120h of incubation (Figure 3). Since the survival ratio of TRAMP-C1 cells incubated with E10 and F10 below 100 nM was above 80%, both 50 and 100 nM E10 and F10 were selected for studying the epigenetic mechanism of Nrf2 restoration.
Figure 3.

Cell viability change after treatment of E10 and F10 for 1, 3 and 5 days. One thousand TRAMP- C1 cells were plated in each well of ninety-six well plates for 24 hours and then changed the culture medium to E10 and F10 at different doses for 1, 3, or 5 days. The treatment medium including 0.1% DMSO and drugs were changed every other day. MTS assay was used to test the cell viability. The data are expressed as the means ± SD from 3 independent tests. *, p < 0.05; **, p < 0.01 compared with the control.
E10 and F10 Enhanced Nrf2 expression and the correlated Antioxidant and Detoxification genes
Nrf2 is a vital transcription factor for activating type II antioxidant and detoxification enzymes, such as HO-1, NQO1, and UGT1A1.7 In TRAMP PCa model, previous reports demonstrated that Nrf2 expression is decreased due to its highly methylated promoter region.10 To evaluate the influence of E10 and F10 on Nrf2 and its correlated type II antioxidant and detoxification genes, we did qPCR to compare the change in Nrf2, HO-1, NQO1, and UGT1A1 mRNA levels in TRAMP-C1 cells upon a 3-day treatment with E10 and F10 (Figures 4A-D). E10 and F10 at 100 nM both significantly increased Nrf2 mRNA expression (Figure 4A); E10 (50, 100 nM) and F10 (100 nM) induced a significant upregulation in HO-1 (Figure 4B); E10 (50, 100 nM) and F10 (100 nM) significantly upgraded NQO-1 (Figure 4C); however, neither E10 nor F10 induced any significant increase in UGT1A1 mRNA expression (Figure 4D). The protein expression of the above genes upon the same treatment was analyzed by western blotting. After a 3-day treatment, E10 significantly enhanced the protein expression of Nrf2 and NQO1 at 50 and 100 nM and HO-1 and UGT1A1 at 100 nM (Figure 4E). Likewise, higher concentrations of F10 also significantly increased the protein level of Nrf2 (100 nM), HO-1 (50, 100 nM), NQO1 (50, 100 nM), and UGT1A1 (100 nM) (Figure 4F). Hence, both E10 and F10 are able to raise the level of Nrf2 and the correlated antioxidant and detoxification genes transcriptionally and post-transcriptionally in a dose-dependent manner.
Figure 4.

The influence of E10 (0, 50 and 100 nM) and F10 (0, 50 and 100 nM) on mRNA and protein level of Nrf2 and its downstream genes in TRAMP-C1 cells upon 3- day treatment were analyzed by real-time qPCR and western blotting. The data are expressed as the means ± SD from 3 independent tests. *, p < 0.05 and **, p < 0.01 compared with the control. Relative mRNA level of Nrf2 (Figure 4A), HO-1 (Figure 4B), NQO1 (Figure 4C), and UGT1A1 (Figure 4D) in TRAMP-C1 cells from 3 independent tests upon three day incubation with E10 (0, 50 and 100 nM) and F10 (0, 50 and 100 nM). beta-Actin was used as the internal control. The influence of E10 (0, 50 and 100 nM) and F10 (0, 50 and 100 nM) 3-day treatment on protein expression of Nrf2 correlated genes (HO-1, NQO1, and UGT1A1) are indicated in (Figure 4E) and (Figure 4F). The relative protein expression levels are evaluated and compared based on the signal intensity of the related bands from three independent experiments. The results were normalized using β-actin intensity for the total cellular protein level and are indicated as the mean ± SD.
F10 but not E10 Reduced the Methylation Rate of the CpG Regions in the Nrf2 Promoter
High methylation rate at positions relative (−1226 to −1086) to the transcription start site (TSS) of Nrf2 has indicated a close correlation with a decrease in the expression of Nrf2 in the TRAMP model.10 Thus, we employed BGS to examine whether E10 or F10 can reverse the aberrant methylation status in TRAMP-C1 cells. The results showed a big methylation ratio (88.13%) of the CpGs region in the Nrf2 gene promoter in the untreated cells (3-day treatment with 0.1% DMSO) (Figure 5A). In the positive control group, 3-day treatment of the 5-aza-TSA (combination of 5-aza (500 nM) and TSA (100 nM)), the methylation rate was reduced to 63.89% (Figure 5A). In E10 (100 nM for 3 days) and F10 (100 nM for 3 days) group, the methylation ratio was changed to 85.64%, and 76.80%, respectively (Figure 5A). Treatment with 5-aza and TSA or with F10 for 3 days significantly induced hypomethylation in the Nrf2 promoter region (p < 0.05). To further confirm the findings, we performed a MeDIP-qPCR test. After sonication and pull-down by anti-5-methylcytosine antibody, the first 5 CpG regions located at the positions relative (−1226 to −1086) to the TSS of the Nrf2 promoter was expanded and analyzed by qPCR. The results showed that the 3-day treatment 5-aza -TSA group or F10 group (3-day treatment with 100 nM F-10) significantly decreased the methylation rate in the Nrf2 promoter region (p < 0.01, Figure 5B), while there was no significant difference between E10 and control group (Figure 5B), which resonates with the BGS data. To sum up, F10 but not E10 can diminish the methylation rate of the first five CpG regions in the Nrf2 promoter, which may contribute to restoration of Nrf2 expression.
Figure 5.

Methylation ratio determined by BGS and MeDIP of the first 5 CpGs from −1226 to −1086 upstream the TSS of the Nrf2 promoter in TRAMP C1 cells after 3 days of treatment with 0.1% DMSO (control), mixture of 5-aza (500 nM) and TSA (100 nM), E10 (100 nM) or F10 (100 nM). The data are indicated as the means ± SD from 3 independent tests.*. p < 0.05 and **, p < 0.01 compared with the control group. BGS assay in evaluating the influence of E10 (100 nM) and F10 (100 nM) compared with the control (0.1% DMSO), 5-aza (500 nM) and TSA (100 nM) on methylation of the Nrf2 promoter. Solid circles denote methylated CpGs, while hollow circles unmethylated ones (Figure 5A). MeDIP assay in examining the effects of E10 (100 nM) and F10 (100 nM) compared with the control (0.1% DMSO), 5- aza (500 nM) and TSA (100 nM) on Nrf2 promoter methylation status. qPCR was utilized to quantify the amount of MeDIP DNAs relative to their inputs by calculating the standard curve from a serial dilution of their input DNAs. The relative methylated DNA ratio was compared with the control (Figure 5B).
Regulation of Epigenetic Modification Enzymes by F10 and E10
To analyze the influence of E10 or F10 on vital epigenetic regulation enzymes, the protein expression of DNMTs and HDACs with E10 or F10 treatment were examined. DNMTs (DNMT1, DNMT3a, and DNMT3b) were all significantly decreased only upon treatment with F10 (p < 0.05, Figure 6B). In DNMT activity assay, F10 at 50nM and 100nM can both inhibit the total activity of DNMTs (p < 0.01, Figure 7A). Furthermore, F10 treatment also significantly lowered the protein expression of HDAC1, 4 and 7 (p < 0.05, Figure 6B). F10 treatment at 50nM concentration significantly reduced the total HDACs activity as well (p < 0.05, Figure 7B). In contrast, E10 (100 nM) increased the DNMT1 protein level and did not affect DNMT3a or 3b levels (p < 0.05, Figure 6A). E10 can induce a significant decrease in the protein level of HDAC4 and 7 (p < 0.05, Figure 6A). In activity assay, E10 at 100nM decreased total DNMTs level (p < 0.01, Figure 7A). E10 at both concentrations increased total HDACs activity (p < 0.01, Figure 7A).
Figure 6.

Effects of E10 (Figure 6A) and F10 (Figure 6B) on DNMT and HDAC protein expression. TRAMP-C1 cells were subjected to three day treatments of E10 (0, 50 and 100 nM) and F10 (0, 50 and 100 nM). The relative expression of proteins was measured according to the intensity of the related bands normalized by β-actin. The results are represented as mean ± SD. *, p < 0.05 and **, p < 0.01 compared with the control.
Figure 7.

Influence of E10 and F10 on DNMTs (Figure 7A) and HDACs (Figure 6B) activity on TRAMP-C1 cells. After three day treatments, the relative activity of DNMTs and HDACs was calculated as the ratio of relative enzyme activities of treatment groups to that of the control. *, p < 0.05 and **, p < 0.01 compared with the control.
F10 but not E10 Treatment Decreased the Enrichment of H3K27me3 at the Nrf2 Promoter and at the Global Level
Tri-methylation of histone 3 at lysine 27 (H3K27me3) is commonly associated with gene repression 17 and is an important marker for studying transcriptional influence. To explore the influence of F10 or E10 on enrichment of H3K27me3 on the promoter region of the Nrf2 gene, a ChIP assay was implemented with the TRAMP-C1 cells treated with F10 or E10 using H3K27me3 antibody. Two primer pairs were used to test the H3K27 accumulation in different promoter regions of Nrf2 (Figure 8A). The results indicated that treatment with F10 (100 nM) for 3 days significantly decreased the enrichment of H3K27me3 on Nrf2 promoter regions, while E10 (100 nM) treatment for 3 days increased the enrichment (Figures 8B and C). To examine whether E10 or F10 treatment had any global effect on H3K27me3, western blotting was utilized to compare the total amount of H3K27me3 in TRAMP-C1 cells. We found that treatment with E10 (50 or 100 nM) and a high dose of F10 (100 nM) did not affect the total amount of H3K27me3, whereas F10 at a low dose (50 nM) dramatically reduced the amount (Figures 8D and E), which suggests that F10 may potentially activate other genes in addition to Nrf2 by influencing the total amount or the enrichment of H3K27me3.
Figure 8.

TRAMP C1 cells were treated with control (0.1% DMSO), E10 (50 and 100 nM) and F10 (50 and 100 nM) for 3 days. Chromatin was precipitated using an antibody against H3K27me3 and was then used as a template for qPCR. Two different H3K27me3 enrichment sites were selected in the promoter region of Nrf2 genes (Figure 8A) with the number at the right indicating the relative positions of the two primers (a and b) and exons relative to the transcription start site (TSS). Relative enrichment of H3K27me3 analyzed by qPCR using primer A (Figure 8B) and primer B (Figure 8C) was compared with that of the control. The global effect of F10 (50, 100 nM) (Figure 8D) and E10 (50, 100 nM) (Figure 8E) was analyzed by western blotting. The relative protein expression levels were quantified based on the intensity of the related bands and normalized by β-actin. *, p < 0.05 and **, p < 0.01 compared with the control.
Discussions
Many natural phytochemicals, including curcumin, have chemopreventive properties against PCa.9, 11-13 F10 and E10 exhibited more potent inhibitory activity than curcumin on PCa cells CWR-22Rv1 and LNCaP.14 In our experiments, E10 and F10 demonstrated the ability to limit the expansion of prostate adenocarcinoma cell TRAMP-C1. Briefly, E10 and F10 are capable of preventing prostate carcinogenesis in vitro.
Excessive expansion and robust viability of cancer cells can be induced by hyperactive oxidative stress 18. Nrf2 can regulate excessive oxidative stress by upregulating phase II detoxifying and antioxidation gene transcription.8 Owing to its cellular conservation capabilities, Nrf2 is often inhibited in the early stage of cancer.10, 12 In our experiments, we found that F10 and E10 could increase the level of Nrf2 and the correlated phase II antioxidant and detoxifying enzymes, which indicates that F10 and E10 may have chemopreventive capability through Nrf2 pathway activation.
Epigenetic changes closely correlated with PCa carcinogenesis have received much attention.19-22 DNA methyltransferases (DNMT1, DNMT3a, and DNMT3b) can bring methylate 5′ cytosine bases in CpG dinucleotides.23 The methylation ratio in the promoter regions of tumor repressor genes are found to be low, thus keeping the activity of those genes intact.24 However, in tumor cells, those genes are usually silenced through hypermethylation in the promoter regions.25 Silencing of cancer suppressive genes due to aberrant hypermethylation in their promoter regions are proven to be highly correlated with PCa carcinogenesis and progression.26 Our group has found that, similar to other cancer repressor genes, Nrf2 expression is epigenetically decreased by hypermethylation of its promoter during PCa development in TRAMP mice and TRAMP-C1 cells.10, 27 Our BGS and MeDIP results (Figure 5) doubly confirmed that F10 not E10 can efficiently demethylate the first five CpG regions in the Nrf2 promoter in TRAMP-C1 cells, which has been shown to be highly associated with restoration of Nrf2 expression 10. The demethylation effect of F10 may greatly contribute to its ability to reduce DNMT1, 3a and 3b expression and activity.
Histone posttranslational modifications (PTMs), another major mechanism in epigenetic regulation, are believed to be crucial in manipulating gene transcription by switching the chromatin to a loose or condensed structure or by introducing histone modifiers.28 Histone PTMs mainly consist of adding acetyl groups via HATs, methyl groups via histone methyltransferases (HMTs), and phosphoryl groups via histone kinases and removing acetyl groups via HDACs, methyl groups via histone demethylases (HDMs), and phosphoryl groups via histone phosphatases.29
Among them, histone acetylation in chromatin, which is coordinated by the equilibrium of HATs and HDACs, is highly related to gene transcription regulation. Improper HDAC enhancement in cancer could be the cause of decreased cancer suppressor genes.30 In our study, both E10 and F10 significantly lowered the protein expression of HDAC4 and 7; F10 also decreased HDAC1 levels. F10 treatment at 50nM concentration also significantly reduced the total HDACs activity. These findings could to some extent explain the chemopreventive effect of E10 and F10.
Histone lysine methylation, which includes mono (me1)-, di (me2)-, and tri (me3)- methylation, may activate or repress related genes.31 Since histone modification is a crucial epigenetic factor in gene expression regulation, tri-methylation of histone 3 at lysine 27 (H3K27me3), which is catalyzed by Polycomb Regressive Complex 2, is closely related to gene repression in development.17 F10 (100 nM) can significantly reduce the relative enrichment of H3K27me3 by different primers targeting the Nrf2 promoter region, which suggests a key epigenetic role of F10 in restoring Nrf2 level in PCa cells.
In PCa, the global H3K27me3 level may be related to severity. In a clinical study, overall H3K27me3 level indicated a higher increase in metastatic PCa than in localized PCa and normal prostate tissue. Increased H3K27me3 is also associated with a higher Gleason score.32 Global H3K27me3 was also demonstrated by Ngollo M et al. to be a critical marker in prostate carcinogenesis and progression 33. In our study, F10 (50 nM) greatly reduced the global H3k27me3 level, which may be one of the cancer prevention mechanisms of F10.
In previous reports14, SAR analysis were carried out among curcumin and its five derivatives A10, B10, C10, E10 and F10 on the viability of human prostate cancer CWR-22Rv1 and LNCaP cells. The authors found E10 and F10 have better inhibition effect mainly due to the heteroatom structure. 14 Based on our results, it may suggest the curcumin derivatives with oxygen containing heterocyclic ring exhibits more potency in influencing epigenetic modification enzymes than sulphur containing heterocyclic structure. However more experiments are needed to confirm the above assumption.
Conclusions
In conclusion, the curcumin derivatives F10 and E10 are both effective in inhibiting PCa carcinogenesis in the TRAMP model. They can both upgrade mRNA and protein level of Nrf2 and the correlated phase II detoxification and antioxidant genes. Our work is the first to explore the epigenetic effects of E10 and F10. Although they are very close in structure, F10 but not E10 plays a major role in epigenetically restoring the decreased Nrf2 expression in TRAMP-C1 cells by reducing methylation rate of the Nrf2 promoter and decreasing HDACs level. Furthermore, only F10 but not E10 can reduce the enrichment of H3k27me3 on the Nrf2 promoter region. F10 and E10 are promising potential chemopreventive phytochemicals for PCa, and their clinical efficacy and pharmacokinetic profiles merit further study.
Acknowledgements
The authors express sincere gratitude to all of the members of Dr. Tony Kong's laboratory for their helpful discussions.
Funding Sources
This work was supported in part by institutional funds and by R01-AT007065 from NCCIH and the Office of Dietary Supplements (ODS) and R01-CA200129 from the National Cancer Institute (NCI).
Abbreviations
- Nrf2
Nuclear factor erythroid-2 related factor 2
- HO-1
heme oxygenase-1; NQO1, NAD[P] H:quinone oxidoreductase-1
- SOD
superoxide dismutase
- GST
glutathione S-transferase
- γ-GCL
γ-glutamyl cysteine ligase
- ARE
antioxidant response element
- Keap-1
Kelch-like ECHassociated protein 1
- PCa
prostate cancer
- ROS
reactive oxygen species
- DIM,
3,3'-diindolylmethane
- F10
(3E,5E)-3,5-Bis(3,4,5-trimethoxybenzylidene) -tetrahydrothiopyran-4-one
- E10
((3E,5E)-3,5-Bis(3,4,5-trimethoxybenzylidene) tetrahydropyran-4-one (E10))
- DMEM
Dulbecco's Modified Eagle Medium
- MEM
Minimum essential medium
- FBS
fetal bovine serum
- DMSO
Dimethyl sulfoxide
- 5-aza
5-azadeoxycytidine
- TSA
Trichostatin A
- SFN
sulforaphane
- BGS
Bisulfite Genomic Sequencing
- MeDIP
Methylated DNA Immunoprecipitation
Footnotes
Notes
The authors declare that there are no conflicts of interest.
References
- (1).Brawley OW (2012) Trends in prostate cancer in the United States. J Natl Cancer Inst Monogr 2012, 152–156. [DOI] [PMC free article] [PubMed] [Google Scholar]
- (2).Aryee MJ, Liu W, Engelmann JC, Nuhn P, Gurel M, Haffner MC, Esopi D, Irizarry RA, Getzenberg RH, Nelson WG, Luo J, Xu J, Isaacs WB, Bova GS, and Yegnasubramanian S (2013) DNA methylation alterations exhibit intraindividual stability and interindividual heterogeneity in prostate cancer metastases. Sci Transl Med 5, 169ra110. [DOI] [PMC free article] [PubMed] [Google Scholar]
- (3).Ferro M, Ungaro P, Cimmino A, Lucarelli G, Busetto GM, Cantiello F, Damiano R, and Terracciano D (2017) Epigenetic Signature: A New Player as Predictor of Clinically Significant Prostate Cancer (PCa) in Patients on Active Surveillance (AS). Int J Mol Sci 18. [DOI] [PMC free article] [PubMed] [Google Scholar]
- (4).Majumdar S, Buckles E, Estrada J, and Koochekpour S (2011) Aberrant DNA methylation and prostate cancer. Curr Genomics 12, 486–505. [DOI] [PMC free article] [PubMed] [Google Scholar]
- (5).Ahmed H (2010) Promoter methylation in prostate cancer and its application for the early detection of prostate cancer using serum and urine samples. Biomark Cancer 2, 17–33. [DOI] [PMC free article] [PubMed] [Google Scholar]
- (6).Kurfurstova D, Bartkova J, Vrtel R, Mickova A, Burdova A, Majera D, Mistrik M, Kral M, Santer FR, Bouchal J, and Bartek J (2016) DNA damage signalling barrier, oxidative stress and treatment-relevant DNA repair factor alterations during progression of human prostate cancer. Mol Oncol 10, 879–894. [DOI] [PMC free article] [PubMed] [Google Scholar]
- (7).Li W, Guo Y, Zhang C, Wu R, Yang AY, Gaspar J, and Kong AN (2016) Dietary Phytochemicals and Cancer Chemoprevention: A Perspective on Oxidative Stress, Inflammation, and Epigenetics. Chem Res Toxicol 29, 2071–2095. [DOI] [PubMed] [Google Scholar]
- (8).Frohlich DA, McCabe MT, Arnold RS, and Day ML (2008) The role of Nrf2 in increased reactive oxygen species and DNA damage in prostate tumorigenesis. Oncogene 27, 4353–4362. [DOI] [PubMed] [Google Scholar]
- (9).Khor TO, Huang Y, Wu TY, Shu L, Lee J, and Kong AN (2011) Pharmacodynamics of curcumin as DNA hypomethylation agent in restoring the expression of Nrf2 via promoter CpGs demethylation. Biochem Pharmacol 82, 1073–1078. [DOI] [PubMed] [Google Scholar]
- (10).Yu S, Khor TO, Cheung KL, Li W, Wu TY, Huang Y, Foster BA, Kan YW, and Kong AN (2010) Nrf2 expression is regulated by epigenetic mechanisms in prostate cancer of TRAMP mice. PLoS One 5, e8579. [DOI] [PMC free article] [PubMed] [Google Scholar]
- (11).Wu TY, Khor TO, Su ZY, Saw CL, Shu L, Cheung KL, Huang Y, Yu S, and Kong AN (2013) Epigenetic modifications of Nrf2 by 3,3'-diindolylmethane in vitro in TRAMP C1 cell line and in vivo TRAMP prostate tumors. Aaps j 15, 864–874. [DOI] [PMC free article] [PubMed] [Google Scholar]
- (12).Zhang C, Su ZY, Khor TO, Shu L, and Kong AN (2013) Sulforaphane enhances Nrf2 expression in prostate cancer TRAMP C1 cells through epigenetic regulation. Biochem Pharmacol 85, 1398–1404. [DOI] [PMC free article] [PubMed] [Google Scholar]
- (13).Huang Y, Khor TO, Shu L, Saw CL, Wu TY, Suh N, Yang CS, and Kong AN (2012) A gamma-tocopherol-rich mixture of tocopherols maintains Nrf2 expression in prostate tumors of TRAMP mice via epigenetic inhibition of CpG methylation. J Nutr 142, 818–823. [DOI] [PMC free article] [PubMed] [Google Scholar]
- (14).Zhou DY, Ding N, Du ZY, Cui XX, Wang H, Wei XC, Conney AH, Zhang K, and Zheng X (2014) Curcumin analogues with high activity for inhibiting human prostate cancer cell growth and androgen receptor activation. Mol Med Rep 10, 1315–1322. [DOI] [PubMed] [Google Scholar]
- (15).Wei X, Du ZY, Zheng X, Cui XX, Conney AH, and Zhang K (2012) Synthesis and evaluation of curcumin-related compounds for anticancer activity. Eur J Med Chem 53, 235–245. [DOI] [PubMed] [Google Scholar]
- (16).Kim BR, Hu R, Keum YS, Hebbar V, Shen G, Nair SS, and Kong AN (2003) Effects of glutathione on antioxidant response element-mediated gene expression and apoptosis elicited by sulforaphane. Cancer Res 63, 7520–7525. [PubMed] [Google Scholar]
- (17).Brykczynska U, Hisano M, Erkek S, Ramos L, Oakeley EJ, Roloff TC, Beisel C, Schubeler D, Stadler MB, and Peters AH (2010) Repressive and active histone methylation mark distinct promoters in human and mouse spermatozoa. Nat Struct Mol Biol 17, 679–687. [DOI] [PubMed] [Google Scholar]
- (18).Hambright HG, Meng P, Kumar AP, and Ghosh R (2015) Inhibition of PI3K/AKT/mTOR axis disrupts oxidative stress-mediated survival of melanoma cells. Oncotarget 6, 7195–7208. [DOI] [PMC free article] [PubMed] [Google Scholar]
- (19).Mian OY, Khattab MH, Hedayati M, Coulter J, Abubaker-Sharif B, Schwaninger JM, Veeraswamy RK, Brooks JD, Hopkins L, Shinohara DB, Cornblatt B, Nelson WG, Yegnasubramanian S, and DeWeese TL (2015) GSTP1 Loss results in accumulation of oxidative DNA base damage and promotes prostate cancer cell survival following exposure to protracted oxidative stress. Prostate. [DOI] [PMC free article] [PubMed] [Google Scholar]
- (20).Geybels MS, Zhao S, Wong CJ, Bibikova M, Klotzle B, Wu M, Ostrander EA, Fan JB, Feng Z, and Stanford JL (2015) Epigenomic profiling of DNA methylation in paired prostate cancer versus adjacent benign tissue. Prostate 75, 1941–1950. [DOI] [PMC free article] [PubMed] [Google Scholar]
- (21).Nilsson EM, Laursen KB, Whitchurch J, McWilliam A, Odum N, Persson JL, Heery DM, Gudas LJ, and Mongan NP (2015) MIR137 is an androgen regulated repressor of an extended network of transcriptional coregulators. Oncotarget. [DOI] [PMC free article] [PubMed] [Google Scholar]
- (22).Strand SH, Hoyer S, Lynnerup AS, Haldrup C, Storebjerg TM, Borre M, Orntoft TF, and Sorensen KD (2015) High levels of 5-hydroxymethylcytosine (5hmC) is an adverse predictor of biochemical recurrence after prostatectomy in ERG-negative prostate cancer. Clin Epigenetics 7, 111. [DOI] [PMC free article] [PubMed] [Google Scholar]
- (23).Edwards JR, Yarychkivska O, Boulard M, and Bestor TH (2017) DNA methylation and DNA methyltransferases. Epigenetics Chromatin 10, 23. [DOI] [PMC free article] [PubMed] [Google Scholar]
- (24).Esteller M (2007) Cancer epigenomics: DNA methylomes and histone-modification maps. Nat Rev Genet 8, 286–298. [DOI] [PubMed] [Google Scholar]
- (25).Esteller M (2008) Epigenetics in cancer. N Engl J Med 358, 1148–1159. [DOI] [PubMed] [Google Scholar]
- (26).Ellinger J, Bastian PJ, Jurgan T, Biermann K, Kahl P, Heukamp LC, Wernert N, Muller SC, and von Ruecker A (2008) CpG island hypermethylation at multiple gene sites in diagnosis and prognosis of prostate cancer. Urology 71, 161–167. [DOI] [PubMed] [Google Scholar]
- (27).Li W, Pung D, Su ZY, Guo Y, Zhang C, Yang AY, Zheng X, Du ZY, Zhang K, and Kong AN (2016) Epigenetics Reactivation of Nrf2 in Prostate TRAMP C1 Cells by Curcumin Analogue FN1. Chem Res Toxicol 29, 694–703. [DOI] [PMC free article] [PubMed] [Google Scholar]
- (28).Jung I, and Kim D (2012) Histone modification profiles characterize function-specific gene regulation. J Theor Biol 310, 132–142. [DOI] [PubMed] [Google Scholar]
- (29).Reis AH, Vargas FR, and Lemos B (2016) Biomarkers of genome instability and cancer epigenetics. Tumour Biol 37, 13029–13038. [DOI] [PubMed] [Google Scholar]
- (30).Glaser KB, Staver MJ, Waring JF, Stender J, Ulrich RG, and Davidsen SK (2003) Gene expression profiling of multiple histone deacetylase (HDAC) inhibitors: defining a common gene set produced by HDAC inhibition in T24 and MDA carcinoma cell lines. Mol Cancer Ther 2, 151–163. [PubMed] [Google Scholar]
- (31).Kouzarides T (2007) Chromatin modifications and their function. Cell 128, 693–705. [DOI] [PubMed] [Google Scholar]
- (32).Ellinger J, Kahl P, von der Gathen J, Heukamp LC, Gutgemann I, Walter B, Hofstadter F, Bastian PJ, von Ruecker A, Muller SC, and Rogenhofer S (2012) Global histone H3K27 methylation levels are different in localized and metastatic prostate cancer. Cancer Invest 30, 92–97. [DOI] [PubMed] [Google Scholar]
- (33).Ngollo M, Lebert A, Daures M, Judes G, Rifai K, Dubois L, Kemeny JL, Penault-Llorca F, Bignon YJ, Guy L, and Bernard-Gallon D (2017) Global analysis of H3K27me3 as an epigenetic marker in prostate cancer progression. BMC Cancer 17, 261. [DOI] [PMC free article] [PubMed] [Google Scholar]