

Abstract
During navigation of complex environments, the brain must continuously adapt to both external demands, such as fluctuating sensory inputs, and internal demands, such as engagement in a cognitively demanding task. Previous studies have demonstrated changes in behavior and gait with increased sensory and cognitive load, but the underlying cortical mechanisms remain largely unknown. In the present study, in a mobile brain/body imaging (MoBI) approach, 16 young adults walked on a treadmill with high-density EEG while 3-dimensional (3D) motion capture tracked kinematics of the head and feet. Visual load was manipulated with the presentation of optic flow with and without continuous mediolateral perturbations. The effects of cognitive load were assessed by the performance of a go/no-go task on half of the blocks. During increased sensory load, participants walked with shorter and wider strides, which may indicate a more restrained pattern of gait. Interestingly, cognitive task engagement attenuated these effects of sensory load on gait. Using an independent component analysis and dipole-fitting approach, we found that cautious gait was accompanied by neuro-oscillatory modulations localized to frontal (supplementary motor area, anterior cingulate cortex) and parietal (inferior parietal lobule, precuneus) areas. Our results show suppression in alpha/mu (8–12 Hz) and beta (13–30 Hz) rhythms, suggesting enhanced activation of these regions with unreliable sensory inputs. These findings provide insight into the neural correlates of gait adaptation and may be particularly relevant to older adults who are less able to adjust to ongoing cognitive and sensory demands while walking.
NEW & NOTEWORTHY The neural underpinnings of gait adaptation in humans are poorly understood. To this end, we recorded high-density EEG combined with three-dimensional body motion tracking as participants walked on a treadmill while exposed to full-field optic flow stimulation. Perturbed visual input led to a more cautious gait pattern with neuro-oscillatory modulations localized to premotor and parietal regions. Our findings show a possible brain-behavior link that might further our understanding of gait and mobility impairments.
Keywords: dual-task design, EEG, independent component analysis (ICA), mobile brain/body imaging (MoBI), power spectral density
INTRODUCTION
Although we often take walking for granted, human locomotion relies on an extensive network of spinal, brain stem, and subcortical processes (Grillner et al. 2008), with control mechanisms arising from the cortex (Takakusaki 2013). Particularly during navigation of complex or unfamiliar environments, cortical resources are essential to facilitate dynamic sensorimotor interactions (Rossignol et al. 2006) while maintaining postural stability (Winter 1995). However, whereas behavioral studies have previously explored differences in gait in response to various manipulations in processing load, much remains unknown about the cortical underpinnings of dual-task adaptations during locomotion. Only recently have approaches using scalp electroencephalography (EEG) recordings allowed for the direct investigation of electrocortical activity during gait (Gramann et al. 2011; Makeig et al. 2009). Findings indicate the recruitment of cortical sensorimotor and prefrontal regions even during steady-state walking, with direct involvement of cortical motor areas implicated in the control of leg muscle activity (Artoni et al. 2017; Petersen et al. 2012). This technique also provides the opportunity to assess cortical activity underlying different walking functions, such as adapting to the manipulation of sensory inputs (Jacobs and Horak 2007; Varraine et al. 2002) or engaging in various cognitive tasks (De Sanctis et al. 2014; Kline et al. 2014). Therefore, the aim of this study was to assess the effects of both cognitive and sensory load on gait and neuro-oscillatory activity.
A paradigm well suited to study walking while capturing the impact of cognitive and sensory demands is the dual-task walking design (Al-Yahya et al. 2011; Woollacott and Shumway-Cook 2002). Walking with and without performing a secondary task may be compared to measure the effects of added demands. Findings from previous dual-task walking studies indicate that whether or not healthy young adults will exhibit changes in cognitive performance or gait largely depends on the type and complexity of the specific tasks employed (Al-Yahya et al. 2011; Kelly et al. 2010; Lövdén et al. 2008, Woollacott and Shumway-Cook 2002; Yogev-Seligmann et al. 2008). Increased cognitive load may lead to a decline in performance on the secondary task (Szturm et al. 2013; Yogev-Seligmann et al. 2008), an effect explained in terms of an interference cost as a result of dual-tasking. Fluctuations in the motor domain as a result of dual-tasking have sometimes been interpreted as costs, for example, reductions in gait velocity (Beauchet et al. 2005; Hollman et al. 2007; Springer et al. 2006) or, when slowing down is not an option (i.e., treadmill walking), increased stride-to-stride variability (Szturm et al. 2013). However other studies have found young adults to exhibit changes in gait that may be construed as beneficial adaptations, such as reduced cadence and stride length (Al-Yahya et al. 2011), increased step width (Kline et al. 2014), and decreased variability in spatiotemporal parameters such as stride time (Lövdén et al. 2008; Wrightson et al. 2016) or step width (Grabiner and Troy 2005). These modulations have been interpreted as an adoption of a more cautions gait pattern, to maintain postural stability under increased load.
In addition to a secondary cognitive task, processing load during gait may be affected by the introduction of different sensory manipulations. Locomotion depends on the efficient integration of multiple sources of sensory information, including visual, vestibular, somatosensory, and proprioceptive inputs (Campos et al. 2012; Takakusaki 2013). Yet, walking in humans is an especially visually demanding activity, and we rely on our visual system to provide crucial sources of information during self-directed navigation (Lappe et al. 1999; Patla 1997). One aspect of visually guided locomotion is optic flow, the visual motion we experience as a result of traveling through our environment (Gibson 1950, 1958; Lappe and Grigo 1999). Optic flow is a powerful signal that can be used to control the parameters of our movements (Warren et al. 2001). For example, a change in the speed of optic flow causes people to modulate their walking speed accordingly (Prokop et al. 1997), and the direction of optic flow influences heading direction (Butler et al. 2010; Lappe and Rauschecker 1994; Warren and Hannon 1988). A number of relevant studies aimed at testing the effects of sensory input on locomotion have applied full-field optic flow stimulation while participants walk on a treadmill. By studying walking in a virtual reality environment of a moving corridor, Hollman et al. (2006) found that participants took shorter strides and wider steps, with increased variability in step width, compared with walking during the presentation of a static image (Hollman et al. 2006). In two studies, McAndrew and colleagues increased sensory load by superimposing pseudo-random mediolateral (ML) perturbations on a virtual reality landscape. Again, participants engaged in what can be described as a cautions gait pattern, taking shorter and wider steps with increased variability compared with the unperturbed optic flow condition (McAndrew et al. 2010, 2011). These results illustrate the robust effects of optic flow on locomotion, as well as the opportunity to manipulate sensory demands to measure dual-task interference on gait.
Whereas there is a well-established body of literature assessing the effects of dual-task load using behavioral designs (Woollacott and Shumway-Cook 2002), less is known about the neural correlates of these processes, particularly for designs incorporating gross motor behaviors such as walking. Over the last 10 years, EEG, with its portability, relatively low cost, and excellent temporal resolution, has emerged as the method of choice to assess electrocortical functioning during active movements (Gramann et al. 2011). When utilized in concert with body motion tracking, this approach is referred to as mobile brain/body imaging (MoBI) (Gramann et al. 2011, 2014; Makeig et al. 2009). To aid in overcoming the primary obstacle in recording EEG activity while a subject is in motion, several different analytical approaches have been successfully employed to isolate and remove movement artifacts from cortical signals, including independent component analysis (ICA) (Gwin et al. 2010; Kline et al. 2015). Recent MoBI studies have established the viability (De Sanctis et al. 2012; Gramann et al. 2010) and long-term reliability (Malcolm et al. 2017) of recording event-related potentials (ERPs) during treadmill and outdoor (De Vos et al. 2014) walking. Other studies have shown neuronal oscillatory activity localized to sensorimotor and frontal regions during steady-state walking (Gwin et al. 2011), providing the opportunity to investigate the neural underpinnings of gait under dual-task load (Sipp et al. 2013; Wagner et al. 2014). For example, Wagner et al. (2014) measured the electrocortical dynamics of participants as they steered an avatar down a virtual alley through force sensors embedded in the robotic legs of a gait orthosis. In a control condition, participants walked while tracking a visual target. Although both visual tasks were of similar load, only the avatar task required movement-related interactive feedback, which put additional load onto motor planning. The authors reported spectral power suppression within the mu (8–12 Hz) and beta (15–20 Hz) bands in supplementary motor and posterior parietal regions (Wagner et al. 2014). Furthermore, findings of reduced mu/beta power during walking compared with upright standing were reported by Seeber et al. (2014, 2015). These recent MoBI findings align well with extensive prior research showing strong evidence for mu/beta power suppression as correlates of cortical activation before and after motor initiation (Pfurtscheller et al. 1997; Pfurtscheller and Lopes da Silva 1999).
In the present study, we increased sensory load by exposing participants to full-field optic flow stimulation with and without continuous ML perturbations. In addition, we manipulated cognitive load by having participants either perform or not perform a go/no-go response inhibition task (Eimer 1993). We first hypothesized that increased load would be associated with a more variable, cautions gait pattern and would require a higher degree of motor activation indexed by mu/beta suppression. Second, a line of relevant research links bottom-up visual processing load to spectral power suppression within the alpha band over occipital-temporal regions (Pfurtscheller et al. 1994). We hypothesized that occipital alpha would be reduced as participants were exposed to optic flow as well as when participants were required to process the visual letters while performing the cognitive go/no-go task. Finally, a third area of research shows a link between attention and alpha power over parietal regions. In one study, participants covertly attended to one hemifield and detected an embedded target letter while a series of distractor letters were shown on both sides (Kelly et al. 2006). Ignoring letters in the unattended hemifield was shown to increase alpha power over the contralateral hemisphere. This and other studies support the notion that alpha power reflects active suppression of to-be-ignored stimuli (Foxe and Snyder 2011). Therefore, it was also hypothesized that optic flow with ML perturbations, representing unreliable information to sustain dynamic balance during walking, would drive alpha power increases over parietal cortex.
METHODS
Participants
Eighteen healthy young adults participated in the experiment. Data from two participants were excluded due to technical problems in streaming motion capture recordings; therefore, results reported were derived from 16 participants (5 women) with a mean age of 25.6 (4.5) yr [mean (SD)]. All participants were right-handed, had normal or corrected-to-normal vision, and reported no history of psychiatric, neurological, or musculoskeletal disorders as well as no intake of psychoactive medication. Participants were recruited from the laboratory’s existing subject pool and from flyers posted at the Albert Einstein College of Medicine. The Institutional Review Board of the Albert Einstein College of Medicine approved the experimental procedures, and all participants provided their written informed consent. All procedures were compliant with the principles laid out in the Declaration of Helsinki for the responsible conduct of research.
Stimuli and Procedure
While walking on the treadmill, participants were presented with a full-field visual display consisting of a star field (200 randomly placed white dots projected onto a black background). In the two dynamic optic flow conditions, the stars emanated outward from a central focus of expansion point, moving steadily with no visual perturbations (NOP) or oscillating with continuous perturbations in the ML direction (MLP). Optic flow was programmed from
where D(t) is the translation distance (m), A is the amplitude of displacement, and t is time (s). Sinusoidal perturbations in the ML direction were applied at amplitudes of 0 m (NOP condition) or 0.12 m (MLP condition). The frequency selected (0.4 Hz) was within the range used in previous studies of human gait (McAndrew et al. 2010; O’Connor and Kuo 2009). The star field moved in this manner throughout the duration of a 3-min walking block. A third condition was also employed in which the same number of stars was randomly presented across the visual field projection but did not move, i.e., no optic flow (static condition). On average, the field of view of the star field subtended 100° horizontally by 100° vertically.
In addition to these three visual conditions, participants were presented with a go/no-go response inhibition task. Stimuli were shown in the center of the visual field, not overlapping with the optic flow. During “task” blocks, participants engaged in the cognitive task by responding quickly and accurately to the frequently occurring go trials by clicking a wireless mouse button following the presentation of the letter “O” but withholding responses during infrequent no-go trials, designated by the presentation of the letter “X.” The probability of go and no-go trials was 0.80 and 0.20, respectively. The duration of each letter presentation was 400 ms, followed by an interstimulus interval ranging from 200 to 400 ms. A central fixation cross was shown at the beginning of each block and in between each letter presentation. The dependent measures for the go/no-go task included hit rate, the corresponding reaction times for hit trials, and correct rejection (CR) rate. Hit rate was computed as the percentage of correct responses following a go stimulus. CR rate, a measure of response inhibition performance, was determined as the percentage of correctly withheld responses following a no-go stimulus. To evaluate the effect of cognitive task load on gait and EEG spectral power, half of the blocks were designated as “no task,” in which the go/no-go stimuli were shown but participants were instructed not to respond or cognitively engage in the task. During all blocks, participants were instructed to direct their gaze toward the central fixation cross (and presentation of task-relevant letters). Images were projected centrally (InFocus XS1 DLP; 1,024 × 768 pixels) onto a black wall ~1.5 m in front of the participant. The stimulus display was programmed with Presentation software version 18.1 (Neurobehavioral Systems, Berkeley, CA).
With the two factors of visual load (static, NOP, or MLP) and cognitive task load (task performance or no-task performance), this design resulted in six different experimental conditions. Participants performed three blocks of each condition, each lasting 3 min, for a total recording time of 54 min. Blocks were conducted in a pseudo-random order and counterbalanced across participants. A practice block was performed before the main experiment was undertaken. To minimize fatigue, participants either took breaks after each block or performed no more than two to three consecutive blocks before taking a break. A self-selected walking speed was chosen at the beginning of the experiment and maintained throughout. Average walking speed was 3.9 km/h (range: 3.2–4.5 km/h). All participants walked while wearing comfortable shoes and a safety harness. See Fig. 1 for a representation of the recording setup.
Fig. 1.
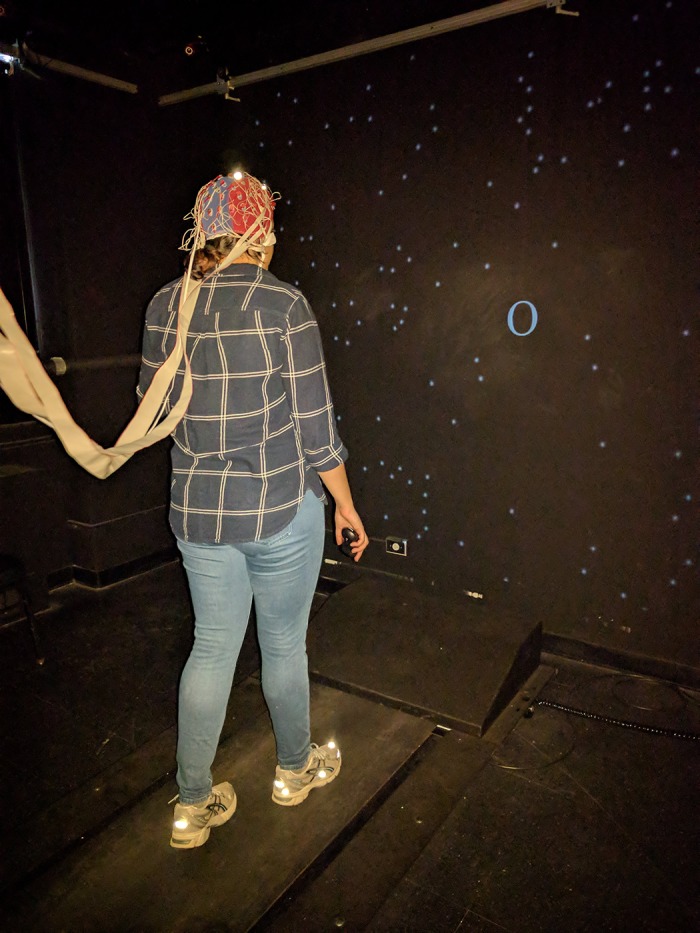
Representation of recording apparatus. A participant is shown walking on the treadmill facing the optic flow display while wearing a 72-channel EEG cap, with motion capture markers on the head and feet.
Kinematics Recordings
Three-dimensional kinematics data were collected at 100 Hz using a nine-camera Optitrack infrared motion capture system and Arena v.1.5 acquisition software (Natural Point). Each participant wore 10 reflective markers: 4 were placed on the head (attached to the EEG cap: right and left sides, front and back), and 3 markers were placed on each foot over the participants’ shoes (on the calcanei and the second and fifth distal metatarsals).
Electrophysiological Recordings
Continuous EEG was recorded with a 72-channel BioSemi ActiveTwo system (digitized at 512 Hz; pass band 0.05 to 100 Hz, 24-dB/octave). Presentation software recorded stimulus events and transmitted to BioSemi Actiview via a parallel cable. Time-synchronized acquisition of stimulus triggers, behavioral responses, EEG, and rigid body motion tracking was conducted with Lab Streaming Layer (LSL) software (Swartz Center for Computational Neuroscience, University of California, San Diego, CA; available at: https://github.com/sccn/labstreaminglayer).
Data Analysis
All EEG and kinematics data analyses were performed using custom MATLAB scripts (The MathWorks, Natick, MA) and EEGLAB (Delorme and Makeig 2004).
Kinematics.
The following dependent measures were used to assess spatiotemporal aspects of the gait cycle: mean and variability of stride time, stride length, and step width. Variability was computed as the coefficient of variation: CV% = (SD/mean) × 100 (Hausdorff 2005). Additionally, variability in head position in the ML and anteroposterior (AP) directions served as a measure of postural stability and overall variability in movement position on the treadmill. These measures were chosen to reflect commonly reported gait parameters that may characterize postural instability in virtual reality environments (Hollman et al. 2006; McAndrew et al. 2010) or under cognitive load (De Sanctis et al. 2014; Hollman et al. 2007; Nankar et al. 2017; Szturm et al. 2013; Wrightson et al. 2016). Heel strikes were computed from the heel marker trajectory, using an automated peak-picking function (MATLAB custom scripts) and confirmed by manual inspection, to identify the point where the heel marker was at the most anterior point in the AP direction (Dingwell et al. 2010; Zeni et al. 2008). Individual strides were defined as consecutive heel strikes of the same foot. Stride time was defined as the time between consecutive heel strikes of the same foot, and stride length was calculated as the sum of each pair of consecutive step lengths that made up each stride (Alton et al. 1998; Dingwell and Cusumano 2015). Step width was computed as the lateral distance between the two heel markers at the time of right heel strike (Kang and Dingwell 2008; Kline et al. 2014; Owings and Grabiner 2004). Displacement in head position was computed by averaging over all four markers. The means and SD of each of these measures were calculated over each block, for each condition, for each participant.
EEG and power spectral density.
We employed an ICA and dipole-fitting approach to preprocess EEG data and compute electrocortical dynamics, generally in line with previous MoBI work (Gwin et al. 2010, 2011; Kline et al. 2014; Sipp et al. 2013; Wagner et al. 2012, 2014). During seated tasks, ICA has long been shown to be effective at isolating various generators of task-evoked cortical activity underlying a specific cognitive function (Onton et al. 2006) from artifactual sources such as eye and muscle-related noise (Delorme et al. 2007; Jung et al. 2000). More recently, this technique has been successfully used in conjunction with procedures that model independent components (ICs) as equivalent current dipoles (Oostenveld and Oostendorp 2002), to separate and remove gait artifacts and estimate the location of resulting neural sources (Akalin Acar and Makeig 2013; Gwin et al. 2010, 2011; Kline et al. 2014). EEG data were first high-pass filtered at 1 Hz with a zero-phase finite impulse response (FIR; order 5632) filter (Winkler et al. 2015), and then all blocks for each subject were concatenated into one data set. Noisy channels were identified and removed by visual inspection and by automatic detection of channels with signals more than five times the SD of the mean across all channels (Wagner et al. 2012). Remaining channels were re-referenced to a common average reference. Continuous data were then subjected to a manual visual inspection resulting in the rejection of any sequences that contained large or nonstereotypical artifacts. Next, an extended ICA decomposition was performed using default training mode parameters (Makeig et al. 1996).
Resulting ICs were coregistered with a standard Montreal Neurological Institute (MNI) boundary element head model and fit with single equivalent current dipole models using the DIPFIT toolbox in EEGLAB (Delorme et al. 2012; Oostenveld and Oostendorp 2002). Only ICs for which the estimated dipole model was located within the brain and explained >85% of the variance of the IC scalp map were retained (Gwin et al. 2011; Sipp et al. 2013). ICs that were clearly artifactual were rejected; these could have included activity originating from eye blinks, bad electrodes, cable sway, and muscle activity noise (Snyder et al. 2015). Two experienced EEG raters, B.R.M. (first author) and P.D. (senior author), visually inspected, compared, and discussed their ratings of ICs. Rejection criteria were based on topography, spectra, component activation time course, and estimated dipole location (Jung et al. 2000). For example, to determine that probable brain ICs were not contaminated with muscle noise, spectral power plots extending out to 100 Hz were examined to determine that ICs maintained the 1/f power roll-off.
Following this procedure, an average of 10 brain-related ICs per participant (ranging from 6 to 16 ICs) were retained for further analyses. ICs were clustered across participants with EEGLAB clustering routines using the parameters of 3D dipole location, scalp topography, and power spectra (3–45 Hz) (Onton and Makeig 2006). With the use of principal components analysis, feature vectors were reduced to 10 principal components and clustered using a k-means algorithm implemented in EEGLAB (Gwin et al. 2011), with ICs further than 3 SD from any of the resulting cluster centers marked as outliers (Wagner et al. 2012). Only clusters that included ICs from at least half of the participants were retained for further analysis, resulting in the eight clusters reported in this article. However, please note that results and discussion will focus on a more limited subset of clusters in line with our hypotheses, specifically those clusters localized to premotor, parietal, and occipital regions. It should additionally be acknowledged that the clustering of spatially resolved EEG activity is an estimation of the underlying cortical network. Therefore, not finding components in a certain region might not necessarily reflect a lack of involvement from that region, but rather a variety of factors, including the particulars of data processing and recording. Finally, power spectral density (PSD) was computed using Welch’s method (Welch 1967). Periodograms were obtained in windows of 512 samples (1 s), a fast Fourier transform (FFT) length of 1,024, with 50% overlap, and windowed with a Hamming window of the same length as the segment. The subsequent periodograms were averaged over all ICs in each cluster to produce an estimation of the absolute PSD for four frequency bands of interest: theta (3–7 Hz), alpha/mu (8–12 Hz), beta (13–30 Hz), and gamma (31–45 Hz).
Statistical analyses.
Measures of cognitive task performance (reaction times, hit rate, and CR rate) were evaluated with one-way repeated-measures ANOVA, for the factor of visual load (static, NOP, and MLP). Gait and head position data were analyzed with two (task load) × three (visual load) repeated-measures ANOVA. Because walking speed has a direct relationship with stride length and stride time (Dingwell et al. 2010; Kang and Dingwell 2008), walking speed was included as a covariate in the analysis of these gait parameters. The covariate was mean-centered, i.e., deviations from the mean speed were used instead of the raw values to avoid interfering with the test of the main effects (Delaney and Maxwell 1981). For the analysis of PSD, separate two (task load) × three (visual load) repeated-measures ANOVA were performed for each IC cluster and frequency band of interest. Post hoc tests were corrected for multiple comparisons using the Tukey-Kramer procedure (Tukey 1949). Greenhouse-Geisser corrections were applied when appropriate, but original degrees of freedom are reported. Statistical analyses were performed with IBM SPSS (v. 24).
RESULTS
Go/No-Go Behavioral Performance
There was a significant effect of visual load on reaction times (RTs; F2,30 = 3.88, P = 0.03). Follow-up paired comparisons revealed longer RTs for the NOP condition [324.4 (28.8) ms] compared with the static star field [315.3 (26.9) ms; P = 0.03]. RTs elicited during the MLP condition [320.5 (31.3) ms] did not significantly differ from the other two conditions (all P > 0.05). There was no effect of visual load on hit rate (P = 0.53), demonstrating comparable performance between the static [97.8% (2.2%)], NOP [97.1% (4.7%)], and MLP [97.9% (2.0%)]. Likewise, participants exhibited similar CR rates across conditions (P = 0.92), indicating approximately equal ability to withhold responses on no-go trials during the static [70.7% (12.1%)], NOP [69.8% (11.2%)], and MLP [70.3% (14.2%)] visual conditions.
Gait and Posture
Average and variability (CV%) of stride time, stride length, and step width for all six experimental conditions are presented in Fig. 2.
Fig. 2.

Mean and variability (CV, coefficient of variation) of all gait measurements. Stride time (left), stride length (middle), and step width (right) are shown for all experimental conditions. Error bars represent SE. *P < 0.05. NOP, optic flow condition with no perturbations; MLP, optic flow condition with continuous perturbations in the mediolateral direction.
Stride time.
For average stride time, there was a main effect of task load (F1,14 = 8.51, P = 0.01), showing that participants took significantly faster strides when engaged in the task [1,179 (75) ms] compared with no-task blocks [1,189 (78) ms]. Furthermore, there was an interaction between task load and visual load (F2,28 = 3.99, P = 0.03). Post hoc comparisons indicated a significant reduction in stride time for the MLP condition relative to both the static condition (P = 0.023) and the NOP condition (P = 0.014) only during no-task blocks. No significant effects were found for stride time variability.
Stride length.
There were significant effects of task load (F1,14 = 11.85, P = 0.004) and visual load (F2,28 = 3.59, P = 0.04) on average stride length. In line with the findings outlined above for stride time, participants took overall shorter strides when engaged in the task [1,423 (115) mm] compared with no-task blocks [1,438 (122) mm]. There was also an interaction between these two factors (F2,28 = 5.43, P = 0.01), driven by significantly shorter strides taken during the MLP condition relative to the static (P = 0.009) and the NOP conditions (P = 0.033) only during no-task blocks. For stride length variability, no effects reached the level of significance.
Step width.
Visual load had a significant effect on average step width (F2,28 = 7.14, P = 0.003), reflecting the finding that compared with the static visual condition, participants walked with wider steps during both the NOP (P = 0.005) and the MLP blocks (P = 0.041). Step width variability showed a robust effect of task load (F1,14 = 9.53, P = 0.008), with participants exhibiting more variable step widths when not performing the cognitive task [10.67% (3.5%)] compared with task blocks [9.52% (2.7%)].
Head position.
Figure 3 shows the mean (SD) head position in the ML and AP directions. In the ML direction, there was a main effect of cognitive task load (F1,15 = 8.56, P = 0.01), indicating more stability in lateral head position when participants performed the cognitive task [26.7 (9.2) mm] in contrast to when they walked without engaging in the task [29.6 (10.8) mm].
Fig. 3.

Average variability in head position in the mediolateral (ML) direction (left) and anteroposterior (AP) direction (right) for all experimental conditions. Error bars represent SE. *P < 0.05. NOP, optic flow condition with no perturbations; MLP, optic flow condition with continuous perturbations in the ML direction.
There was also a main effect of task load for head position variability in the AP direction (F1,15 = 10.12, P = 0.006), similarly indicating decreased variability when participants performed the task [33.5 (18.0) mm] compared with when they only walked [44.8 (19.2) mm]. Additionally, there was an interaction between cognitive and visual load (F2,30 = 7.33, P = 0.003). Post hoc comparisons revealed a trend toward reduced AP head position variability with increased visual load (P = 0.09) during no-task blocks.
Power Spectral Density
Eight clusters were localized to cortical areas and were composed of ICs from at least half of the participants. Table 1 lists the number of ICs and subjects included in each cluster and the approximate anatomical location (Brodmann area and Talairach coordinates) of cluster centroids. Figure 4 illustrates the location of each of the ICs belonging to each cluster, plotted on the MNI brain. Note that Figs. 5–7 serve to depict detailed information (average topography, IC dipole locations, and average power spectral density) of electrocortical clusters found over regions that were relevant to our hypotheses. Additionally, bar plots highlighting significant modulations for specific frequency bands are limited to frequencies that are central to our hypotheses.
Table 1.
Clusters of independent electrocortical sources
| Functional Area | Brodmann Area | Talairach Coordinates (x, y, z) | No. of Subjects and ICs |
|---|---|---|---|
| Medial occipital lobe, lingual gyrus | BA17 | 11, −94, −10 | 12 (14 ICs) |
| Right occipital | BA19 | 47, −73, −1 | 11 (12 ICs) |
| Left occipital | BA19 | −43, −71, 14 | 12 (14 ICs) |
| Left superior temporal gyrus | BA22 | −47, −17, −6 | 10 (12 ICs) |
| Right inferior parietal lobule | BA40 | 43, −34, 36 | 8 (10 ICs) |
| Parietal lobe, precuneus | BA7 | 12, −62, 34 | 11 (15 ICs) |
| Supplementary motor area | BA6 | −6, −16, 45 | 14 (23 ICs) |
| Limbic lobe, anterior cingulate | BA24 | 1, 25, 22 | 14 (15 ICs) |
Data indicate the approximate location (Brodmann area and Talairach coordinates) of cluster centroids for all clusters located in the cortex and containing independent components (ICs) from more than half of the participants.
Fig. 4.

Approximate locations of electrocortical sources: medial right and left occipital cortex clusters (yellow), left superior temporal gyrus (brown), inferior parietal lobule (light blue), precuneus (red), supplementary motor area (dark blue), and anterior cingulate cortex (green).
Fig. 5.

Occipital cortex clusters. Scalp topography, dipole location (blue dots indicate the location of each independent component, red dots represent the cluster centroid), and average power spectral density of right (A) and left (B) occipital clusters. Error bars represent SE. *P < 0.05. NOP, optic flow condition with no perturbations; MLP, optic flow condition with continuous perturbations in the ML direction.
Fig. 7.

Frontal cortex clusters. Scalp topography, dipole location (blue dots indicate the location of each independent component, red dots represent the cluster centroid), and average power spectral density of clusters localized to the supplementary motor area (A) and the anterior cingulate cortex (B). Error bars represent SE. *P < 0.05. NOP, optic flow condition with no perturbations; MLP, optic flow condition with continuous perturbations in the ML direction.
Occipital cortex clusters.
Figure 5 shows scalp topography, IC dipole locations, and average PSD for two clusters over right and left occipital cortex. Topographies show lateralized distributions over right and left occipital scalp regions. Bar plots emphasize significant modulations in alpha and beta frequencies for the right occipital cluster and for the alpha band in the left-lateralized cluster.
The right occipital cluster, composed of 12 ICs, exhibited robust differences in spectral power attributable to visual load in theta (F2,22 = 8.94, P = 0.008) and alpha bands (F2,22 = 21.50, P < 0.001). Post hoc comparisons revealed reduced power for the NOP and MLP optic flow conditions compared with the static condition (all P < 0.046). The beta range also exhibited an effect of visual load (F2,22 = 4.18, P = 0.05), with reduced power during the NOP compared with the static condition (P = 0.015). Furthermore, there was a strong effect of performing the cognitive task on alpha power (F1,11 = 14.15, P = 0.003), with decreased spectral power in alpha associated with increased task load. Finally, a significant interaction between task load and visual load was found for the gamma band (F2,22 = 4.96, P = 0.02), with a significant reduction in power for the NOP relative to the static condition (P = 0.011), specifically during no-task blocks.
For the IC cluster located in left occipital cortex made up of 14 ICs, modulations in spectral power were observed only in the alpha frequency range. There was a robust effect of visual load (F2,26 = 10.76, P = 0.004), with a reduction in alpha power observed for both dynamic conditions (all P < 0.04) compared with the static condition. Finally, for the cluster of 14 ICs located over medial occipital cortex, no effects reached the level of significance.
Temporal and parietal cortex clusters.
For the cluster localized to the left superior temporal gyrus composed of 12 ICs, visual load had a significant effect on the spectral power of both the theta (F2,22 = 7.00, P = 0.02) and alpha bands (F2,22 = 9.65, P = 0.001). Both showed reductions in power associated with increased optical flow input (all P < 0.05), with no differences between the two dynamic conditions (all P > 0.05). Figure 6 shows scalp topography, dipole location, and power spectra for the two parietal clusters. Topographies show that both parietal clusters are distributed over the right scalp region. For the cluster of 10 ICs localized to the right inferior parietal lobule (IPL), the only significant modulation in spectral power was observed for the factor of visual load in the alpha band (F2,18 = 5.94, P = 0.01).
Fig. 6.

Parietal cortex clusters. Scalp topography, dipole location (blue dots indicate the location of each independent component, red dots represent the cluster centroid), and average power spectral density of inferior parietal lobule (A) and precuneus (B) clusters. Error bars represent SE. *P < 0.05. NOP, optic flow condition with no perturbations; MLP, optic flow condition with continuous perturbations in the ML direction.
The precuneus cluster (made up of 15 ICs) exhibited significant modulations in spectral power for the alpha (F1,14 = 21.07, P < 0.001) and beta bands (F1,14 = 13.16, P = 0.003) as a result of the cognitive task, with a relative reduction during task engagement. Additionally, visual load affected all frequency bands of interest: theta (F2,28 = 20.09, P < 0.001), alpha (F2,28 = 15.63, P = 0.001), beta (F2,28 = 10.33, P < 0.001), and gamma (F2,28 = 3.66, P = 0.04). Post hoc comparisons revealed power reductions within theta, alpha, and beta bands during both optic flow conditions relative to the static condition (all P < 0.01). In the gamma range, MLP produced reduced power compared with the static star field (P = 0.012). Finally, there was an interaction between task load and visual condition for the alpha band (F2,28 = 5.94, P = 0.007). Post hoc paired comparisons failed to reach levels of significance after adjustment for multiple comparisons.
Frontal cortex clusters.
The final two clusters localized to supplementary motor area (SMA) and anterior cingulate cortex are depicted in Fig. 7. Scalp maps reveal a rather central distribution. For the SMA cluster of 23 ICs, significant changes in spectral power were found in the theta range linked to cognitive load (F1,22 = 9.41, P = 0.006), with increased power when participants performed the cognitive task compared with when they did not. Significant effects of visual load on spectral power were observed in the theta (F2,44 = 5.01, P = 0.02), alpha (F2,44 = 29.52, P < 0.001), and beta bands (F2,44 = 17.20, P < 0.001). Post hoc comparisons revealed reduced spectral power within alpha band during both NOP and MLP conditions (all P < 0.004) relative to the static. Additionally, for frequencies in the alpha range, there was a significant interaction between task load and visual condition (F2,44 = 5.77, P = 0.01), driven by consistent power suppression across both NOP and MLP relative to the static condition, only during the no-task blocks (all P < 0.029). For the cluster of 15 ICs localized to anterior cingulate cortex, significant changes in spectral power were observed only in the lower frequencies. In the theta range, spectral power significantly increased during performance of the go/no-go task compared with no-task blocks (F1,14 = 11.61, P = 0.004). Visual load significantly affected spectral power in both the theta (F2,28 = 10.16, P < 0.001) and alpha frequency ranges (F2,28 = 10.13, P < 0.001). This effect was indicative of greater power for the static visual condition compared with both the NOP (all P < 0.01) and MLP conditions (all P < 0.009).
DISCUSSION
The objective of the current dual-task walking study was to examine changes in gait and cortical activity in response to sensory and cognitive load. During two dynamic visual conditions, a pattern of optic flow created by the movement of a star field radiating outward generated a sense of forward movement. Participants walked while either performing or not performing a cognitive go/no-go task. The optic flow was motionless projected onto the wall (static), moved steadily with no perturbations (NOP), or oscillated with continuous mediolateral perturbations (MLP). We hypothesized that increases in sensory load from static, NOP to MLP would result in increases in stride variability and sensorimotor activation. Increased activation of sensorimotor regions was indexed by suppression of spectral power in the mu and beta bands (Neuper et al. 2006; Pfurtscheller and Lopes da Silva 1999). Furthermore, we hypothesized that visual processing load (dynamic star field as well as the go/no-go letters) would lead to power suppression within the alpha band over occipital-temporal regions (Pfurtscheller et al. 1994). Finally, we hypothesized that sensory load, particularly as participants were challenged to sustain dynamic balance during the MLP condition, would lead to higher alpha power over parietal cortex, because higher power within the alpha band over these regions has been proposed as an attentional mechanism to suppress task-irrelevant information (Foxe et al. 1998; Foxe and Snyder 2011).
We found effects of sensory load on gait and head position as well as on spectral power in the alpha- and beta-frequency bands. Participants took shorter strides and wider steps with increased sensory load. In addition, average head position variability in the AP direction decreased as the amount of sensory load increased. The latter finding was only robust during the no-task condition. These findings are somewhat inconsistent with our hypotheses, namely, that gait would become more variable and unstable under increased load. Instead, our young adult participants adjusted their gait by taking wider steps and maintaining a more central position on the treadmill, thereby engaging in possibly a more effortful strategy to counteract the effects of unreliable sensory load and uphold postural control.
What Are the Neural Underpinnings of Gait Adaptation Associated with Incongruent Sensory Information?
We report power modulations in neuro-oscillatory activity localized to SMA, right IPL, and the precuneus, regions previously implicated in motor planning and intention as well as spatial processing of visually guided actions (Halsbandet al. 1993; Kravitz et al. 2011). For the premotor region (SMA), spectral power reduction was observed in mu and beta bands associated with the dynamic optic flow compared with the static condition. We also observed suppression in the theta band during the MLP condition relative to both the static and NOP conditions. Prior studies have shown mu/beta desynchronization in sensorimotor and premotor regions during the preparation and execution of upper and lower limb movements (Pfurtscheller et al. 1997; Pfurtscheller and Lopes da Silva 1999), and MoBI studies have revealed that power modulation of mu/beta rhythms are also observable during steady-state walking (Seeber et al. 2014; Severens et al. 2012; Wagner et al. 2014, 2016). For example, Wagner et al. (2016) investigated gait adaptation by requiring participants to match their cadence to an auditory pacing tone. After a shift in pacing tempo, beta power suppression was observed in SMA and parietal regions. In addition, Oliveira et al. (2017) manipulated visual input by having participants walk with eyes open and eyes closed. Shifting or increasing load onto nonvisual sensory modalities reduced stride time and resulted in significant reductions in theta power, particularly during the double-support phase of gait (Oliveira et al. 2017). In line with previous findings, we suggest that our results show that healthy participants may adjust their gait in response to incongruent sensory inputs and that gait adaptation is accompanied by greater neural excitation in premotor regions. This brain-behavior link may provide significant insight into gait adaptation deficits in aging (Malcolm et al. 2015) and in patients with neurological gait disorders (Duffell et al. 2017; Zijlstra et al. 1998).
Also of importance are the effects of cognitive load. When performing the inhibitory control task, participants exhibited decreased variability in step width and head position in both directions. The significant interaction between cognitive and sensory load for AP head position variability might suggest that performing the go/no-go task attenuated the effects of sensory load. Prior dual-task walking findings seem to go along with these results, given that Grabiner and Troy (2005) also observed decreased step width variability and a more conservative gait under cognitive load. Additionally, Lövdén et al. (2008) observed that gait variability decreased when young adults performed a moderately difficult cognitive task. They contend that an external focus of attention is beneficial to motor performance and that there will be no cross-domain competition resulting in costs, as long as cognitive load remains moderate (Lövdén et al. 2008). Of note, we also found increased theta power while participants performed the go/no-go task. If and how coupling of cognitive-motor processes are linked to our finding of increased theta power is an open question.
For the posterior parietal regions (right IPL and precuneus), power in alpha, beta, and gamma bands were reduced during increased sensory load conditions, consistent with previous MoBI investigations (Gwin et al. 2011; Lau et al. 2014; Wagner et al. 2012, 2014). Furthermore, other studies have underscored the role of posterior regions for multisensory guidance of movements as well as spatial processing of visually guided actions (Kravitz et al. 2011; Limanowski and Blankenburg 2016; Marigold and Drew 2017). For example, Marigold and Drew (2017) recoded from area 7 of the posterior parietal cortex (PPC) in cats walking on a treadmill and stepping over a moving obstacle. They found distinct populations that signaled time to contact with the obstacle (Marigold and Drew 2017). Based on these and other findings, the PPC has been proposed as a sensorimotor interface involved in multisensory integration of ongoing movements (Buneo et al. 2002; Limanowski and Blankenburg 2016). Our findings showing alpha and beta power suppression may indicate PPC activation to resolve unreliable visual information and may signify increased cortical activation in areas involved in maintaining gait stability (Clayton et al. 2015).
For the occipital regions, we found strong effects of sensory and cognitive load on spectral power in alpha as well as other frequency bands. In line with previous findings, we showed that alpha suppression occurred when participants were exposed to the dynamic star field as well as when they were required to process the go/no-go task letters. Alpha power suppression over occipital regions is assumed to reflect cortical excitation related to various stages of stimulus processing (Pfurtscheller et al. 1996). Interestingly, presentation of go/no-go letters per se did not evoke right occipital alpha suppression; it occurred only when participants were required to perform the go/no-go task. In contrast, presentation of the dynamic star field evoked alpha suppression even when there was no explicit requirement to process the optic flow. The go/no-go letters were presented centrally with a visual angle of 4°. In contrast, the optic flow stimulus was projected on the wall and extended 100° in the horizontal and vertical directions. Our findings seem to support differential deployment of attention or gating for these two types of visual inputs.
Furthermore, numerous studies by our group have established alpha power increases over parietal regions as a mechanism of attentional inhibition of to-be-ignored information (Foxe et al. 1998; Foxe and Snyder 2011; Kelly et al. 2006; Snyder and Foxe 2010; Worden et al. 2000). In the present study, we hypothesized that alpha power would increase while participants were exposed to the dynamic star field as a means to suppress unreliable sensory information that would otherwise compromise gait stability. Instead, our findings showed parietal alpha power decreases during optic flow exposure. We speculate that attentional modulation of alpha might be relatively subtle and therefore masked by parietal alpha modulation related to multisensory control of movement (Kravitz et al. 2011).
There are a few methodological issues that should be considered when interpreting the results of this study. One is that participants walked on a treadmill as opposed to overground. Some studies reported similar kinematic and kinetic parameters between treadmill vs overground gait (Lee and Hidler 2008; Riley et al. 2007). However, others have found significant differences (Alton et al. 1998; Dingwell et al. 2001), including a reduction in variability of several spatiotemporal measures during treadmill walking (Hollman et al. 2016; Wrightson and Smeeton 2017). Additionally, in a study with older adults, there was found to be a greater effect of somatosensory feedback on prefrontal cortex activation during treadmill compared with overground walking (Clark et al. 2014). Therefore, this aspect of our design may have had an influence on the lack of significant differences in stride time and stride length variability across task conditions. However, although slowing down may not be an option, it is the case that meaningful adjustments of motoric behavior may be assayed with treadmill walking, as our results clearly demonstrate. Also, the advantages of using treadmill walking in dual-task paradigms, including the ability to acquire data across hundreds of strides in precisely controlled environments, makes for a more valid between-groups comparison. Nevertheless, questions if and how treadmill findings generalize to overground walking are valid. An additional limitation is that our participants walked at a relatively slow walking speed (1.1 m/s) compared with the average adult overground walking speed of ~1.4 m/s (Bohannon 1997). However, we must take into account that they performed this experiment while walking in low light, in a harness, with EEG wires tethered to an overhead platform. Moreover, other mobile EEG studies have reported similar or even slower walking speeds. For example, for walking overground, Beurskens et al. (2016) found that, on average, young adults walked 1.3 m/s while engaged in an auditory oddball task and at ~1.1 m/s when concurrently engaged in an additional motor task. For treadmill walking, Gwin et al. (2010) had young participants walk at 0.8 and 1.25 m/s, and Kline et al. (2014) found no changes in either cognitive task performance or electrocortical activity across four different walking speeds ranging from 0.4 to 1.6 m/s.
Conclusions
By utilizing an ICA and clustering approach to isolate cortical sources supporting dual-task walking, this study has provided insights into the neural underpinnings of gait adaptation. We found that the ability to adopt a more cautions pattern of gait was accompanied by mean spectral power modulation in frontoparietal activity clusters, regions previously implicated in motor planning and sensory guidance of movement. These findings may be relevant for applications such as neurorehabilitation, for example, to decode user intentions from EEG in brain-computer interfaces (Kilicarslan et al. 2013; Wagner et al. 2012). Additionally, valuable information may be gained in relation to monitoring the neural correlates underlying disease progression and rehabilitation in diseases such as multiple sclerosis and Parkinson’s disease (Boyd et al. 2007; Kelly et al. 2012). Finally, older adults often have difficulty adapting to additional demands during locomotion (Beurskens and Bock 2012) and frequently show evidence of decline in proprioceptive, vestibular, and somatosensory processing (Goble et al. 2009; Hay et al. 1996), factors that may increase fall risk (Ayers et al. 2014; Setti et al. 2011). MoBI approaches in virtual reality environments (e.g., introducing visual perturbations) could be employed in combination with gait training strategies to successfully challenge walking abilities, with the aim of reducing fall risk in vulnerable populations.
GRANTS
The primary source of funding for this work was provided by Einstein-Montefiore Institute for Clinical and Translational Research Pilot Grant UL1-TR000086 and the Sheryl & Daniel R. Tishman Family Foundation. Participant recruitment was performed by the Human Clinical Phenotyping Core at Einstein, a facility of the Rose F. Kennedy Intellectual and Developmental Disabilities Research Center, which is funded by Eunice Kennedy Shriver National Institute of Child Health and Human Development Grant P30 HD071593.
DISCLOSURES
No conflicts of interest, financial or otherwise, are declared by the authors.
AUTHOR CONTRIBUTIONS
J.J.F., J.S.B., and P.D.S. conceived and designed research; B.R.M. performed experiments; B.R.M. and J.S.B. analyzed data; B.R.M., J.J.F., S.M., and P.D.S. interpreted results of experiments; B.R.M. prepared figures; B.R.M. drafted manuscript; J.J.F., J.S.B., S.M., and P.D.S. edited and revised manuscript; B.R.M., J.J.F., J.S.B., S.M., and P.D.S. approved final version of manuscript.
ACKNOWLEDGMENTS
We express sincere gratitude to the participants for giving time to this effort.
REFERENCES
- Akalin Acar Z, Makeig S. Effects of forward model errors on EEG source localization. Brain Topogr 26: 378–396, 2013. doi: 10.1007/s10548-012-0274-6. [DOI] [PMC free article] [PubMed] [Google Scholar]
- Al-Yahya E, Dawes H, Smith L, Dennis A, Howells K, Cockburn J. Cognitive motor interference while walking: a systematic review and meta-analysis. Neurosci Biobehav Rev 35: 715–728, 2011. doi: 10.1016/j.neubiorev.2010.08.008. [DOI] [PubMed] [Google Scholar]
- Alton F, Baldey L, Caplan S, Morrissey MC. A kinematic comparison of overground and treadmill walking. Clin Biomech (Bristol, Avon) 13: 434–440, 1998. doi: 10.1016/S0268-0033(98)00012-6. [DOI] [PubMed] [Google Scholar]
- Artoni F, Fanciullacci C, Bertolucci F, Panarese A, Makeig S, Micera S, Chisari C. Unidirectional brain to muscle connectivity reveals motor cortex control of leg muscles during stereotyped walking. Neuroimage 159: 403–416, 2017. doi: 10.1016/j.neuroimage.2017.07.013. [DOI] [PMC free article] [PubMed] [Google Scholar]
- Ayers EI, Tow AC, Holtzer R, Verghese J. Walking while talking and falls in aging. Gerontology 60: 108–113, 2014. doi: 10.1159/000355119. [DOI] [PMC free article] [PubMed] [Google Scholar]
- Beauchet O, Dubost V, Herrmann FR, Kressig RW. Stride-to-stride variability while backward counting among healthy young adults. J Neuroeng Rehabil 2: 26, 2005. doi: 10.1186/1743-0003-2-26. [DOI] [PMC free article] [PubMed] [Google Scholar]
- Beurskens R, Bock O. Age-related deficits of dual-task walking: a review. Neural Plast 2012: 131608, 2012. doi: 10.1155/2012/131608. [DOI] [PMC free article] [PubMed] [Google Scholar]
- Beurskens R, Steinberg F, Antoniewicz F, Wolff W, Granacher U. Neural correlates of dual-task walking: effects of cognitive versus motor interference in young adults. Neural Plast 2016: 8032180, 2016. doi: 10.1155/2016/8032180. [DOI] [PMC free article] [PubMed] [Google Scholar]
- Bohannon RW. Comfortable and maximum walking speed of adults aged 20–79 years: reference values and determinants. Age Ageing 26: 15–19, 1997. doi: 10.1093/ageing/26.1.15. [DOI] [PubMed] [Google Scholar]
- Boyd LA, Vidoni ED, Daly JJ. Answering the call: the influence of neuroimaging and electrophysiological evidence on rehabilitation. Phys Ther 87: 684–703, 2007. doi: 10.2522/ptj.20060164. [DOI] [PubMed] [Google Scholar]
- Buneo CA, Jarvis MR, Batista AP, Andersen RA. Direct visuomotor transformations for reaching. Nature 416: 632–636, 2002. doi: 10.1038/416632a. [DOI] [PubMed] [Google Scholar]
- Butler JS, Smith ST, Campos JL, Bülthoff HH. Bayesian integration of visual and vestibular signals for heading. J Vis 10: 23, 2010. doi: 10.1167/10.11.23. [DOI] [PubMed] [Google Scholar]
- Campos JL, Butler JS, Bülthoff HH. Multisensory integration in the estimation of walked distances. Exp Brain Res 218: 551–565, 2012. doi: 10.1007/s00221-012-3048-1. [DOI] [PubMed] [Google Scholar]
- Clark DJ, Christou EA, Ring SA, Williamson JB, Doty L. Enhanced somatosensory feedback reduces prefrontal cortical activity during walking in older adults. J Gerontol A Biol Sci Med Sci 69: 1422–1428, 2014. doi: 10.1093/gerona/glu125. [DOI] [PMC free article] [PubMed] [Google Scholar]
- Clayton MS, Yeung N, Cohen Kadosh R. The roles of cortical oscillations in sustained attention. Trends Cogn Sci 19: 188–195, 2015. doi: 10.1016/j.tics.2015.02.004. [DOI] [PubMed] [Google Scholar]
- De Sanctis P, Butler JS, Green JM, Snyder AC, Foxe JJ. Mobile brain/body imaging (MoBI): High-density electrical mapping of inhibitory processes during walking. Conf Proc IEEE Eng Med Biol Soc 2012: 1542–1545, 2012. [DOI] [PubMed] [Google Scholar]
- De Sanctis P, Butler JS, Malcolm BR, Foxe JJ. Recalibration of inhibitory control systems during walking-related dual-task interference: a mobile brain-body imaging (MOBI) study. Neuroimage 94: 55–64, 2014. doi: 10.1016/j.neuroimage.2014.03.016. [DOI] [PMC free article] [PubMed] [Google Scholar]
- De Vos M, Gandras K, Debener S. Towards a truly mobile auditory brain-computer interface: exploring the P300 to take away. Int J Psychophysiol 91: 46–53, 2014. doi: 10.1016/j.ijpsycho.2013.08.010. [DOI] [PubMed] [Google Scholar]
- Delaney HD, Maxwell SE. On using analysis of covariance in repeated measures designs. Multivariate Behav Res 16: 105–123, 1981. doi: 10.1207/s15327906mbr1601_6. [DOI] [PubMed] [Google Scholar]
- Delorme A, Makeig S. EEGLAB: an open source toolbox for analysis of single-trial EEG dynamics including independent component analysis. J Neurosci Methods 134: 9–21, 2004. doi: 10.1016/j.jneumeth.2003.10.009. [DOI] [PubMed] [Google Scholar]
- Delorme A, Palmer J, Onton J, Oostenveld R, Makeig S. Independent EEG sources are dipolar. PLoS One 7: e30135, 2012. doi: 10.1371/journal.pone.0030135. [DOI] [PMC free article] [PubMed] [Google Scholar]
- Delorme A, Sejnowski T, Makeig S. Enhanced detection of artifacts in EEG data using higher-order statistics and independent component analysis. Neuroimage 34: 1443–1449, 2007. doi: 10.1016/j.neuroimage.2006.11.004. [DOI] [PMC free article] [PubMed] [Google Scholar]
- Dingwell JB, Cusumano JP. Identifying stride-to-stride control strategies in human treadmill walking. PLoS One 10: e0124879, 2015. doi: 10.1371/journal.pone.0124879. [DOI] [PMC free article] [PubMed] [Google Scholar]
- Dingwell JB, Cusumano JP, Cavanagh PR, Sternad D. Local dynamic stability versus kinematic variability of continuous overground and treadmill walking. J Biomech Eng 123: 27–32, 2001. doi: 10.1115/1.1336798. [DOI] [PubMed] [Google Scholar]
- Dingwell JB, John J, Cusumano JP. Do humans optimally exploit redundancy to control step variability in walking? PLOS Comput Biol 6: e1000856, 2010. doi: 10.1371/journal.pcbi.1000856. [DOI] [PMC free article] [PubMed] [Google Scholar]
- Duffell LD, Jordan SJ, Cobb JP, McGregor AH. Gait adaptations with aging in healthy participants and people with knee-joint osteoarthritis. Gait Posture 57: 246–251, 2017. doi: 10.1016/j.gaitpost.2017.06.015. [DOI] [PubMed] [Google Scholar]
- Eimer M. Effects of attention and stimulus probability on ERPs in a go/nogo task. Biol Psychol 35: 123–138, 1993. doi: 10.1016/0301-0511(93)90009-W. [DOI] [PubMed] [Google Scholar]
- Foxe JJ, Simpson GV, Ahlfors SP. Parieto-occipital approximately 10 Hz activity reflects anticipatory state of visual attention mechanisms. Neuroreport 9: 3929–3933, 1998. doi: 10.1097/00001756-199812010-00030. [DOI] [PubMed] [Google Scholar]
- Foxe JJ, Snyder AC. The role of alpha-band brain oscillations as a sensory suppression mechanism during selective attention. Front Psychol 2: 154, 2011. doi: 10.3389/fpsyg.2011.00154. [DOI] [PMC free article] [PubMed] [Google Scholar]
- Gibson JJ. The perception of visual surfaces. Am J Psychol 63: 367–384, 1950. doi: 10.2307/1418003. [DOI] [PubMed] [Google Scholar]
- Gibson JJ. Visually controlled locomotion and visual orientation in animals. Br J Psychol 49: 182–194, 1958. doi: 10.1111/j.2044-8295.1958.tb00656.x. [DOI] [PubMed] [Google Scholar]
- Goble DJ, Coxon JP, Wenderoth N, Van Impe A, Swinnen SP. Proprioceptive sensibility in the elderly: degeneration, functional consequences and plastic-adaptive processes. Neurosci Biobehav Rev 33: 271–278, 2009. doi: 10.1016/j.neubiorev.2008.08.012. [DOI] [PubMed] [Google Scholar]
- Grabiner MD, Troy KL. Attention demanding tasks during treadmill walking reduce step width variability in young adults. J Neuroeng Rehabil 2: 25, 2005. doi: 10.1186/1743-0003-2-25. [DOI] [PMC free article] [PubMed] [Google Scholar]
- Gramann K, Gwin JT, Bigdely-Shamlo N, Ferris DP, Makeig S. Visual evoked responses during standing and walking. Front Hum Neurosci 4: 202, 2010. doi: 10.3389/fnhum.2010.00202. [DOI] [PMC free article] [PubMed] [Google Scholar]
- Gramann K, Gwin JT, Ferris DP, Oie K, Jung TP, Lin CT, Liao LD, Makeig S. Cognition in action: imaging brain/body dynamics in mobile humans. Rev Neurosci 22: 593–608, 2011. doi: 10.1515/RNS.2011.047. [DOI] [PubMed] [Google Scholar]
- Gramann K, Jung TP, Ferris DP, Lin CT, Makeig S. Toward a new cognitive neuroscience: modeling natural brain dynamics. Front Hum Neurosci 8: 444, 2014. doi: 10.3389/fnhum.2014.00444. [DOI] [PMC free article] [PubMed] [Google Scholar]
- Grillner S, Wallén P, Saitoh K, Kozlov A, Robertson B. Neural bases of goal-directed locomotion in vertebrates–an overview. Brain Res Brain Res Rev 57: 2–12, 2008. doi: 10.1016/j.brainresrev.2007.06.027. [DOI] [PubMed] [Google Scholar]
- Gwin JT, Gramann K, Makeig S, Ferris DP. Removal of movement artifact from high-density EEG recorded during walking and running. J Neurophysiol 103: 3526–3534, 2010. doi: 10.1152/jn.00105.2010. [DOI] [PMC free article] [PubMed] [Google Scholar]
- Gwin JT, Gramann K, Makeig S, Ferris DP. Electrocortical activity is coupled to gait cycle phase during treadmill walking. Neuroimage 54: 1289–1296, 2011. doi: 10.1016/j.neuroimage.2010.08.066. [DOI] [PubMed] [Google Scholar]
- Halsband U, Ito N, Tanji J, Freund HJ. The role of premotor cortex and the supplementary motor area in the temporal control of movement in man. Brain 116: 243–266, 1993. doi: 10.1093/brain/116.1.243. [DOI] [PubMed] [Google Scholar]
- Hausdorff JM. Gait variability: methods, modeling and meaning. J Neuroeng Rehabil 2: 19, 2005. doi: 10.1186/1743-0003-2-19. [DOI] [PMC free article] [PubMed] [Google Scholar]
- Hay L, Bard C, Fleury M, Teasdale N. Availability of visual and proprioceptive afferent messages and postural control in elderly adults. Exp Brain Res 108: 129–139, 1996. doi: 10.1007/BF00242910. [DOI] [PubMed] [Google Scholar]
- Hollman JH, Brey RH, Robb RA, Bang TJ, Kaufman KR. Spatiotemporal gait deviations in a virtual reality environment. Gait Posture 23: 441–444, 2006. doi: 10.1016/j.gaitpost.2005.05.005. [DOI] [PubMed] [Google Scholar]
- Hollman JH, Kovash FM, Kubik JJ, Linbo RA. Age-related differences in spatiotemporal markers of gait stability during dual task walking. Gait Posture 26: 113–119, 2007. doi: 10.1016/j.gaitpost.2006.08.005. [DOI] [PubMed] [Google Scholar]
- Hollman JH, Watkins MK, Imhoff AC, Braun CE, Akervik KA, Ness DK. A comparison of variability in spatiotemporal gait parameters between treadmill and overground walking conditions. Gait Posture 43: 204–209, 2016. doi: 10.1016/j.gaitpost.2015.09.024. [DOI] [PubMed] [Google Scholar]
- Jacobs JV, Horak FB. Cortical control of postural responses. J Neural Transm (Vienna) 114: 1339–1348, 2007. doi: 10.1007/s00702-007-0657-0. [DOI] [PMC free article] [PubMed] [Google Scholar]
- Jung TP, Makeig S, Westerfield M, Townsend J, Courchesne E, Sejnowski TJ. Removal of eye activity artifacts from visual event-related potentials in normal and clinical subjects. Clin Neurophysiol 111: 1745–1758, 2000. doi: 10.1016/S1388-2457(00)00386-2. [DOI] [PubMed] [Google Scholar]
- Kang HG, Dingwell JB. Separating the effects of age and walking speed on gait variability. Gait Posture 27: 572–577, 2008. doi: 10.1016/j.gaitpost.2007.07.009. [DOI] [PubMed] [Google Scholar]
- Kelly SP, Lalor EC, Reilly RB, Foxe JJ. Increases in alpha oscillatory power reflect an active retinotopic mechanism for distracter suppression during sustained visuospatial attention. J Neurophysiol 95: 3844–3851, 2006. doi: 10.1152/jn.01234.2005. [DOI] [PubMed] [Google Scholar]
- Kelly VE, Eusterbrock AJ, Shumway-Cook A. A review of dual-task walking deficits in people with Parkinson’s disease: motor and cognitive contributions, mechanisms, and clinical implications. Parkinsons Dis 2012: 918719, 2012. doi: 10.1155/2012/918719. [DOI] [PMC free article] [PubMed] [Google Scholar]
- Kelly VE, Janke AA, Shumway-Cook A. Effects of instructed focus and task difficulty on concurrent walking and cognitive task performance in healthy young adults. Exp Brain Res 207: 65–73, 2010. doi: 10.1007/s00221-010-2429-6. [DOI] [PMC free article] [PubMed] [Google Scholar]
- Kilicarslan A, Prasad S, Grossman RG, Contreras-Vidal JL. High accuracy decoding of user intentions using EEG to control a lower-body exoskeleton. Conf Proc IEEE Eng Med Biol Soc 2013: 5606–5609, 2013. doi: 10.1109/EMBC.2013.6610821. [DOI] [PMC free article] [PubMed] [Google Scholar]
- Kline JE, Huang HJ, Snyder KL, Ferris DP. Isolating gait-related movement artifacts in electroencephalography during human walking. J Neural Eng 12: 046022, 2015. doi: 10.1088/1741-2560/12/4/046022. [DOI] [PMC free article] [PubMed] [Google Scholar]
- Kline JE, Poggensee K, Ferris DP. Your brain on speed: cognitive performance of a spatial working memory task is not affected by walking speed. Front Hum Neurosci 8: 288, 2014. doi: 10.3389/fnhum.2014.00288. [DOI] [PMC free article] [PubMed] [Google Scholar]
- Kravitz DJ, Saleem KS, Baker CI, Mishkin M. A new neural framework for visuospatial processing. Nat Rev Neurosci 12: 217–230, 2011. doi: 10.1038/nrn3008. [DOI] [PMC free article] [PubMed] [Google Scholar]
- Lappe M, Bremmer F, van den Berg AV. Perception of self-motion from visual flow. Trends Cogn Sci 3: 329–336, 1999. doi: 10.1016/S1364-6613(99)01364-9. [DOI] [PubMed] [Google Scholar]
- Lappe M, Grigo A. How stereovision interacts with optic flow perception: neural mechanisms. Neural Netw 12: 1325–1329, 1999. doi: 10.1016/S0893-6080(99)00061-1. [DOI] [PubMed] [Google Scholar]
- Lappe M, Rauschecker JP. Heading detection from optic flow. Nature 369: 712–713, 1994. doi: 10.1038/369712a0. [DOI] [PubMed] [Google Scholar]
- Lau TM, Gwin JT, Ferris DP. Walking reduces sensorimotor network connectivity compared to standing. J Neuroeng Rehabil 11: 14, 2014. doi: 10.1186/1743-0003-11-14. [DOI] [PMC free article] [PubMed] [Google Scholar]
- Lee SJ, Hidler J. Biomechanics of overground vs. treadmill walking in healthy individuals. J Appl Physiol (1985) 104: 747–755, 2008. doi: 10.1152/japplphysiol.01380.2006. [DOI] [PubMed] [Google Scholar]
- Limanowski J, Blankenburg F. Integration of visual and proprioceptive limb position information in human posterior parietal, premotor, and extrastriate cortex. J Neurosci 36: 2582–2589, 2016. doi: 10.1523/JNEUROSCI.3987-15.2016. [DOI] [PMC free article] [PubMed] [Google Scholar]
- Lövdén M, Schaefer S, Pohlmeyer AE, Lindenberger U. Walking variability and working-memory load in aging: a dual-process account relating cognitive control to motor control performance. J Gerontol B Psychol Sci Soc Sci 63: P121–P128, 2008. doi: 10.1093/geronb/63.3.P121. [DOI] [PubMed] [Google Scholar]
- Makeig S, Bell AJ, Jung TP, Sejnowski TJ. Independent component analysis of electroencephalographic data. Adv Neural Inf Process Syst 8: 145–151, 1996. [Google Scholar]
- Makeig S, Gramann K, Jung TP, Sejnowski TJ, Poizner H. Linking brain, mind and behavior. Int J Psychophysiol 73: 95–100, 2009. doi: 10.1016/j.ijpsycho.2008.11.008. [DOI] [PMC free article] [PubMed] [Google Scholar]
- Malcolm BR, Foxe JJ, Butler JS, De Sanctis P. The aging brain shows less flexible reallocation of cognitive resources during dual-task walking: a mobile brain/body imaging (MoBI) study. Neuroimage 117: 230–242, 2015. doi: 10.1016/j.neuroimage.2015.05.028. [DOI] [PMC free article] [PubMed] [Google Scholar]
- Malcolm BR, Foxe JJ, Butler JS, Mowrey WB, Molholm S, De Sanctis P. Long-term test-retest reliability of event-related potential (ERP) recordings during treadmill walking using the mobile brain/body imaging (MoBI) approach. Brain Res (in press), 2017. doi: 10.1016/j.brainres.2017.05.021. [DOI] [PMC free article] [PubMed] [Google Scholar]
- Marigold DS, Drew T. Posterior parietal cortex estimates the relationship between object and body location during locomotion. eLife 6: e28143, 2017. doi: 10.7554/eLife.28143. [DOI] [PMC free article] [PubMed] [Google Scholar]
- McAndrew PM, Dingwell JB, Wilken JM. Walking variability during continuous pseudo-random oscillations of the support surface and visual field. J Biomech 43: 1470–1475, 2010. doi: 10.1016/j.jbiomech.2010.02.003. [DOI] [PMC free article] [PubMed] [Google Scholar]
- McAndrew PM, Wilken JM, Dingwell JB. Dynamic stability of human walking in visually and mechanically destabilizing environments. J Biomech 44: 644–649, 2011. doi: 10.1016/j.jbiomech.2010.11.007. [DOI] [PMC free article] [PubMed] [Google Scholar]
- Nankar M, Szturm T, Marotta J, Shay B, Beauchet O, Allali G. The interacting effects of treadmill walking and different types of visuospatial cognitive task: discriminating dual task and age effects. Arch Gerontol Geriatr 73: 50–59, 2017. doi: 10.1016/j.archger.2017.07.013. [DOI] [PubMed] [Google Scholar]
- Neuper C, Wörtz M, Pfurtscheller G. ERD/ERS patterns reflecting sensorimotor activation and deactivation. Prog Brain Res 159: 211–222, 2006. doi: 10.1016/S0079-6123(06)59014-4. [DOI] [PubMed] [Google Scholar]
- O’Connor SM, Kuo AD. Direction-dependent control of balance during walking and standing. J Neurophysiol 102: 1411–1419, 2009. doi: 10.1152/jn.00131.2009. [DOI] [PMC free article] [PubMed] [Google Scholar]
- Oliveira AS, Schlink BR, Hairston WD, König P, Ferris DP. Restricted vision increases sensorimotor cortex involvement in human walking. J Neurophysiol 118: 1943–1951, 2017. doi: 10.1152/jn.00926.2016. [DOI] [PMC free article] [PubMed] [Google Scholar]
- Onton J, Makeig S. Information-based modeling of event-related brain dynamics. Prog Brain Res 159: 99–120, 2006. doi: 10.1016/S0079-6123(06)59007-7. [DOI] [PubMed] [Google Scholar]
- Onton J, Westerfield M, Townsend J, Makeig S. Imaging human EEG dynamics using independent component analysis. Neurosci Biobehav Rev 30: 808–822, 2006. doi: 10.1016/j.neubiorev.2006.06.007. [DOI] [PubMed] [Google Scholar]
- Oostenveld R, Oostendorp TF. Validating the boundary element method for forward and inverse EEG computations in the presence of a hole in the skull. Hum Brain Mapp 17: 179–192, 2002. doi: 10.1002/hbm.10061. [DOI] [PMC free article] [PubMed] [Google Scholar]
- Owings TM, Grabiner MD. Variability of step kinematics in young and older adults. Gait Posture 20: 26–29, 2004. doi: 10.1016/S0966-6362(03)00088-2. [DOI] [PubMed] [Google Scholar]
- Patla AE. Understanding the roles of vision in the control of human locomotion. Gait Posture 5: 54–69, 1997. doi: 10.1016/S0966-6362(96)01109-5. [DOI] [Google Scholar]
- Petersen TH, Willerslev-Olsen M, Conway BA, Nielsen JB. The motor cortex drives the muscles during walking in human subjects. J Physiol 590: 2443–2452, 2012. doi: 10.1113/jphysiol.2012.227397. [DOI] [PMC free article] [PubMed] [Google Scholar]
- Pfurtscheller G, Lopes da Silva FH. Event-related EEG/MEG synchronization and desynchronization: basic principles. Clin Neurophysiol 110: 1842–1857, 1999. doi: 10.1016/S1388-2457(99)00141-8. [DOI] [PubMed] [Google Scholar]
- Pfurtscheller G, Neuper C, Andrew C, Edlinger G. Foot and hand area mu rhythms. Int J Psychophysiol 26: 121–135, 1997. doi: 10.1016/S0167-8760(97)00760-5. [DOI] [PubMed] [Google Scholar]
- Pfurtscheller G, Neuper C, Mohl W. Event-related desynchronization (ERD) during visual processing. Int J Psychophysiol 16: 147–153, 1994. doi: 10.1016/0167-8760(89)90041-X. [DOI] [PubMed] [Google Scholar]
- Pfurtscheller G, Stancák A Jr, Neuper C. Event-related synchronization (ERS) in the alpha band–an electrophysiological correlate of cortical idling: a review. Int J Psychophysiol 24: 39–46, 1996. doi: 10.1016/S0167-8760(96)00066-9. [DOI] [PubMed] [Google Scholar]
- Prokop T, Schubert M, Berger W. Visual influence on human locomotion. Modulation to changes in optic flow. Exp Brain Res 114: 63–70, 1997. doi: 10.1007/PL00005624. [DOI] [PubMed] [Google Scholar]
- Riley PO, Paolini G, Della Croce U, Paylo KW, Kerrigan DC. A kinematic and kinetic comparison of overground and treadmill walking in healthy subjects. Gait Posture 26: 17–24, 2007. doi: 10.1016/j.gaitpost.2006.07.003. [DOI] [PubMed] [Google Scholar]
- Rossignol S, Dubuc R, Gossard JP. Dynamic sensorimotor interactions in locomotion. Physiol Rev 86: 89–154, 2006. doi: 10.1152/physrev.00028.2005. [DOI] [PubMed] [Google Scholar]
- Seeber M, Scherer R, Wagner J, Solis-Escalante T, Müller-Putz GR. EEG beta suppression and low gamma modulation are different elements of human upright walking. Front Hum Neurosci 8: 485, 2014. [Erratum in Front Hum Neurosci 9: 542, 2015]. doi: 10.3389/fnhum.2014.00485. [DOI] [PMC free article] [PubMed] [Google Scholar]
- Seeber M, Scherer R, Wagner J, Solis-Escalante T, Müller-Putz GR. High and low gamma EEG oscillations in central sensorimotor areas are conversely modulated during the human gait cycle. Neuroimage 112: 318–326, 2015. doi: 10.1016/j.neuroimage.2015.03.045. [DOI] [PubMed] [Google Scholar]
- Setti A, Burke KE, Kenny RA, Newell FN. Is inefficient multisensory processing associated with falls in older people? Exp Brain Res 209: 375–384, 2011. doi: 10.1007/s00221-011-2560-z. [DOI] [PubMed] [Google Scholar]
- Severens M, Nienhuis B, Desain P, Duysens J. Feasibility of measuring event related desynchronization with electroencephalography during walking. Conf Proc IEEE Eng Med Biol Soc 2012: 2764–2767, 2012. doi: 10.1109/EMBC.2012.6346537. [DOI] [PubMed] [Google Scholar]
- Sipp AR, Gwin JT, Makeig S, Ferris DP. Loss of balance during balance beam walking elicits a multifocal theta band electrocortical response. J Neurophysiol 110: 2050–2060, 2013. doi: 10.1152/jn.00744.2012. [DOI] [PMC free article] [PubMed] [Google Scholar]
- Snyder AC, Foxe JJ. Anticipatory attentional suppression of visual features indexed by oscillatory alpha-band power increases: a high-density electrical mapping study. J Neurosci 30: 4024–4032, 2010. doi: 10.1523/JNEUROSCI.5684-09.2010. [DOI] [PMC free article] [PubMed] [Google Scholar]
- Snyder KL, Kline JE, Huang HJ, Ferris DP. Independent component analysis of gait-related movement artifact recorded using EEG electrodes during treadmill walking. Front Hum Neurosci 9: 639, 2015. doi: 10.3389/fnhum.2015.00639. [DOI] [PMC free article] [PubMed] [Google Scholar]
- Springer S, Giladi N, Peretz C, Yogev G, Simon ES, Hausdorff JM. Dual-tasking effects on gait variability: the role of aging, falls, and executive function. Mov Disord 21: 950–957, 2006. doi: 10.1002/mds.20848. [DOI] [PubMed] [Google Scholar]
- Szturm T, Maharjan P, Marotta JJ, Shay B, Shrestha S, Sakhalkar V. The interacting effect of cognitive and motor task demands on performance of gait, balance and cognition in young adults. Gait Posture 38: 596–602, 2013. doi: 10.1016/j.gaitpost.2013.02.004. [DOI] [PubMed] [Google Scholar]
- Takakusaki K. Neurophysiology of gait: from the spinal cord to the frontal lobe. Mov Disord 28: 1483–1491, 2013. doi: 10.1002/mds.25669. [DOI] [PubMed] [Google Scholar]
- Tukey JW. Comparing individual means in the analysis of variance. Biometrics 5: 99–114, 1949. doi: 10.2307/3001913. [DOI] [PubMed] [Google Scholar]
- Varraine E, Bonnard M, Pailhous J. Interaction between different sensory cues in the control of human gait. Exp Brain Res 142: 374–384, 2002. doi: 10.1007/s00221-001-0934-3. [DOI] [PubMed] [Google Scholar]
- Wagner J, Makeig S, Gola M, Neuper C, Müller-Putz G. Distinct β band oscillatory networks subserving motor and cognitive control during gait adaptation. J Neurosci 36: 2212–2226, 2016. doi: 10.1523/JNEUROSCI.3543-15.2016. [DOI] [PMC free article] [PubMed] [Google Scholar]
- Wagner J, Solis-Escalante T, Grieshofer P, Neuper C, Müller-Putz G, Scherer R. Level of participation in robotic-assisted treadmill walking modulates midline sensorimotor EEG rhythms in able-bodied subjects. Neuroimage 63: 1203–1211, 2012. doi: 10.1016/j.neuroimage.2012.08.019. [DOI] [PubMed] [Google Scholar]
- Wagner J, Solis-Escalante T, Scherer R, Neuper C, Müller-Putz G. It’s how you get there: walking down a virtual alley activates premotor and parietal areas. Front Hum Neurosci 8: 93, 2014. doi: 10.3389/fnhum.2014.00093. [DOI] [PMC free article] [PubMed] [Google Scholar]
- Warren WH, Hannon DJ. Direction of self-motion is perceived from optical-flow. Nature 336: 162–163, 1988. doi: 10.1038/336162a0. [DOI] [Google Scholar]
- Warren WH Jr, Kay BA, Zosh WD, Duchon AP, Sahuc S. Optic flow is used to control human walking. Nat Neurosci 4: 213–216, 2001. doi: 10.1038/84054. [DOI] [PubMed] [Google Scholar]
- Welch PD. The use of fast Fourier transform for the estimation of power spectra: a method based on time averaging over short, modified periodograms. IEEE Trans Audio Electroacoust 15: 70–73, 1967. doi: 10.1109/TAU.1967.1161901. [DOI] [Google Scholar]
- Winkler I, Debener S, Müller KR, Tangermann M. On the influence of high-pass filtering on ICA-based artifact reduction in EEG-ERP. Conf Proc IEEE Eng Med Biol Soc 2015: 4101–4105, 2015. doi: 10.1109/EMBC.2015.7319296. [DOI] [PubMed] [Google Scholar]
- Winter DA. Human balance and posture control during standing and walking. Gait Posture 3: 193–214, 1995. doi: 10.1016/0966-6362(96)82849-9. [DOI] [Google Scholar]
- Woollacott M, Shumway-Cook A. Attention and the control of posture and gait: a review of an emerging area of research. Gait Posture 16: 1–14, 2002. doi: 10.1016/S0966-6362(01)00156-4. [DOI] [PubMed] [Google Scholar]
- Worden MS, Foxe JJ, Wang N, Simpson GV. Anticipatory biasing of visuospatial attention indexed by retinotopically specific alpha-band electroencephalography increases over occipital cortex. J Neurosci 20: RC63, 2000. doi: 10.1523/JNEUROSCI.20-06-j0002.2000. [DOI] [PMC free article] [PubMed] [Google Scholar]
- Wrightson JG, Ross EZ, Smeeton NJ. The effect of cognitive-task type and walking speed on dual-task gait in healthy adults. Mot Contr 20: 109–121, 2016. doi: 10.1123/mc.2014-0060. [DOI] [PubMed] [Google Scholar]
- Wrightson JG, Smeeton NJ. Walking modality, but not task difficulty, influences the control of dual-task walking. Gait Posture 58: 136–138, 2017. doi: 10.1016/j.gaitpost.2017.07.042. [DOI] [PubMed] [Google Scholar]
- Yogev-Seligmann G, Hausdorff JM, Giladi N. The role of executive function and attention in gait. Mov Disord 23: 329–342, 2008. doi: 10.1002/mds.21720. [DOI] [PMC free article] [PubMed] [Google Scholar]
- Zeni JA Jr, Richards JG, Higginson JS. Two simple methods for determining gait events during treadmill and overground walking using kinematic data. Gait Posture 27: 710–714, 2008. doi: 10.1016/j.gaitpost.2007.07.007. [DOI] [PMC free article] [PubMed] [Google Scholar]
- Zijlstra W, Rutgers AW, Van Weerden TW. Voluntary and involuntary adaptation of gait in Parkinson’s disease. Gait Posture 7: 53–63, 1998. doi: 10.1016/S0966-6362(97)00037-4. [DOI] [PubMed] [Google Scholar]