

Abstract
Objective
Urinary proteomics is primarily applied to the study of renal and urogenital tract disorders. Here are reported two distinct successful examples of this approach for the discovery of early urinary biomarkers of kidney-related dysfunctions: diabetic nephropathy (DN), a well-known complication of diabetes frequently leading to dialysis, and drug-induced nephrotoxicity, a possible condition caused by medication-overuse headache (MOH). Early detection of kidney disorders based on selective biomarkers could permit to diagnose patients at the initial stage of the disease, where the therapy may be suspended or prevent disease advancement.
Methods
Urine samples were first concentrated and desalted. Subsequently, they were subjected to two-dimensional gel electrophoresis (2-DE) coupled to mass spectrometry (MS) for protein identification. Furthermore, some proteins were verified by Western blot and ELISA test.
Results
In diabetes-related study, 11 differentially expressed proteins were detected (8 up-regulated and 3 down-regulated) in type 2 diabetic (T2D) and T2DN patients compared to the healthy control subjects. In the MOH study, a total of 21 over-excreted proteins were revealed in urine of non-steroidal anti-inflammatory drugs (NSAIDs) and mixtures abusers vs controls. Particularly, 4 proteins were positively validated by immunob-lotting and EUSA.
Conclusion
Urinary proteomics allows non-invasive assessment of renal diseases at an early stage by the identification of characteristic protein pattern.
Key words: urinary proteomics, biomarkers, diabetic nephropathy, drug-induced nephrotoxicity
INTRODUCTION
Proteomics is the study of protein expression in a definite tissue, cell type or biological body fluid. The comparison of protein patterns between healthy subjects and patients with a given pathological condition can be useful to identify specific diagnostics or prognostics biomarkers of diseases. Particularly, urinary proteomics has rapidly developed and has been extensively applied in the field of early diagnostics and differentiation of renal damage (1).
Urine is a valuable source of proteins and peptides; it has the advantage of being obtained non-invasively, easily and frequently, and in a large quantity. It has been defined as a fluid biopsy of the kidney and urogenital tract, thus providing considerable information about these organs. Consequently, many changes in kidney and urogenital tract function may be detected in the urinary proteome (2).
Urine proteomics studies were conducted in the search for early biomarkers of renal changes in:
MATERIALS AND METHODS
Subjects
1) Diabetic nephropathy
Diabetic patients were enrolled from the “Division of Nephrology, Dialysis and Renal Transplantation” of the University-Hospital of Modena and Reggio Emilia, Italy: 10 normoal-buminuric patients with type 2 diabetes (T2D), 12 T2DN patients with microalbuminuria (range 130-280 mg/mL) and/or proteinuria (>10 mg/dL), and a control group of 12 healthy volunteer subjects with a history of regular renal function.
The duration of diabetes was similar in the two patients groups. Moreover, all groups were matched for age and gender (3).
2) Drug-induced nephrotoxicity
A total of 87 MOH patients were recruited from the “Headache and Drug Abuse Center”, University-Hospital of Modena and Reggio Emilia, Italy. They were divided into three groups, according to the type of the primary abused drug, as follows: 31 patients who consumed exclusively triptans, 27 non-steroidal anti-inflammatory drugs (NSAIDs) and 29 taking mixtures. Healthy volunteers (n=30) were enrolled as controls. Each group was matched for age and gender; moreover, patients showed similar MOH duration, days with headache/month and about daily drug intake. Kidney diseases and urogenital tract dysfunctions, together with other important illness, were considered as exclusion criteria (5).
Both studies were in compliance with the ethical principles for medical research involving human subjects, in accordance with the Declaration of Helsinki. Written informed consent were received from both, patients and healthy subjects.
Urine proteomics analysis
Morning midstream urine samples were collected and immediately centrifuged at 800 g for 10 min at +4C°, to remove cell debris and contaminants. Commonly, human urine has a very diluted protein concentration and, at the same time, a high-salt content, which hampers the proteomicanalysis. Sample preparation is therefore a pivotal step in urinary proteomics, especially during two-dimensional polyacrylamide gel electrophoresis (2-DE) (2). In order to concentrate proteins, eliminating the interfering salts, urine samples were treated with filter devices, 3 kDa MW-cut off (Merck Millipore). Subsequently, total protein content was estimated by the spectrophotometric Bradford method, and 100 mg of protein was premixed with a specific lysis buffer. The first-dimension separation (isoelec-trofocalization) was performed using IPG strips 17 cm long, wide pH range 3-10 (Bio-Rad), while in the second-dimension separation, 8-16% polyacrylamide gradient gels were used, that finally were staining with a silver-nitrate staining protocol. Afterwards, gels images were acquired with a calibrated densitometer (GS800 model, Bio-Rad) and analyzed by a specific image analysis software (PDQuest, Bio-Rad), to reveal differentially expressed protein spots among the patients and control groups (3, 5). The spots of interest were cut from the gels and subjected to trypsin digestion. Peptides were finally extracted and analyzed by the mass spectrometry using a quadrupole-time of flight-liquid chromatography mass spectrometer (Q-ToF-LC/MS, Agilent-Technologies).
In the second study (drug-induced nephrotoxicity), the results obtained by proteomic analysis were further confirmed and validated by Western blot and ELISA test (6).
RESULTS AND DISCUSSION
1) Diabetic nephropathy
Comparing the urinary proteomic profiles obtained by 2-DE analysis, 11 differential proteins were identified that progressively changed between controls and T2D and T2DN patients. Precisely, 8 proteins were significantly up-regulated: transthyretin precursor, Ig k chain C region, Ig k chain V-II region Cum, Ig k-chain V-III region SIE, carbonic anhydrase 1, retinol binding protein, beta-2-microglobulin precursor and beta-2-glycoprotein 1.
Except for the last one, all the other proteins were in the low MW range (<30 kDa). Three proteins were found down-regulated: prostatic acid phosphatase precursor, ribonuclease 2 and kallikrein-3 (Table 1).
Table 1.
Differentially expressed proteins detected in T2D and T2DN patients by MS
| Protein name | Acc. number(a) | MW (kDa) | Function |
|---|---|---|---|
| Up-regulated proteins | |||
| Transthyretin precursor | P02766 | 16.0 | Hormone-binding |
| Ig Kappa chain C-region | P01834 | 11.8 | Immune response |
| Ig Kappa chain V-ll region Cum | P01614 | 12.8 | Antigen-binding |
| Ig Kappa chain V-ll region SIE | P01620 | 11.9 | Immune response |
| Carbonic anhydrase 1 | P00915 | 28.8 | Miscellaneous |
| Plasma retinol-binding protein | P02753 | 23.3 | Transport |
| Beta-2-microglobulin precursor | P61769 | 13.8 | Immune response |
| Beta-2-glycoprotein 1 | P02749 | 39.6 | Binding protein |
| Down-regulated proteins | |||
| Prostatic acid phosphatase precursor | P15309 | 44.9 | Dephosphorylation |
| Ribonuclease 2 | P10153 | 18.9 | Miscellaneous |
| Kallikrein-3 | P07288 | 29.3 | Hydrolysis |
(a) Primary accession number from the SwissProt database.
Proteomic analysis allowed to detect alterations of urinary proteins in both T2DN and T2D normoalbuminuric patients. Thus, this protein pattern might be of potential interest to identify diabetic patients prone to develop nephropathy, contributing to a better understanding of diabetic-related renal damage. The strength of proteomics in this research area has been confirmed also by recently published review articles (7, 8).
2) Drug-induced nephrotoxicity
In this study both qualitative and quantitative differences in urine of MOH patients were studied and revealed. Interestingly, by 2-DE combined with MS analysis, 21 over-excreted proteins and a significantly higher number of total protein spots were identified in the urine of NSAIDs, mixtures and triptans abusers compared to the controls (Table 2).
Table 2.
Differentially expressed proteins identified by Q-ToF-LC/MS
| Protein name | Acc. number(a) | MW (kDa) | Over-expression vs controls(b) | ||
|---|---|---|---|---|---|
| Mixtures | NSAIDs | Triptans | |||
| Low-MW proteins | |||||
| Prostaglandin-H2-D-isomerase | P41222 | 18.7 | X | X | X |
| Ig kappa chain C region | P01834 | 11.8 | X | X | NS |
| Perlecan (fragment) | P98160 | 479.2 | X | X | X |
| Transthyretin | P02766 | 15.9 | NS | X | NS |
| Proactivator polypeptide | P07602 | 9.11 | X | X | X |
| Nuclear transport factor 2 | P61970 | 14.6 | X | X | X |
| Fatty acid-binding protein | Q01469 | 15.5 | NS | X | X |
| Beta-2-microglobulin | P61769 | 11.7 | NS | X | X |
| Protein S100-A11 | P31949 | 11.8 | NS | X | X |
| Non-secretory ribonuclease | P10153 | 18.9 | X | X | NS |
| Cystatin-C | P01034 | 13.3 | X | X | NS |
| Protein S100-A8 | P05109 | 10.8 | X | X | X |
| Medium - MW proteins | |||||
| Alpha-1-antitrypsin | P01009 | 46.9 | X | X | NS |
| Actin, cytoplasmic! | P60709 | 42.1 | X | X | X |
| Alpha-1-microglobulin | P02760 | 39.9 | X | X | NS |
| Apolipoprotein H | P02749 | 38.3 | NS | X | NS |
| Serpin B3 | P29508 | 44.6 | X | X | X |
| Annexin Al | P04083 | 38.6 | X | X | X |
| High - MW proteins | |||||
| Serum albumin | P02768 | 66.5 | X | X | NS |
| Uromodulin | P07911 | 69.7 | X | X | X |
| Inter-α-trypsin inhibitor heavy chain H4 | Q14624 | 70.6 | X | X | NS |
(a) Primary accession number from the SwissProt database
(b) Expression difference calculated by the PDQuest software: x: significant, NS: not-significant
Some differentially expressed proteins detected by proteomic analysis were found to be strongly related to renal injury (9), as assessed by an extensive literature review. Particularly, 4 proteins were validated by Western blot: prostaglandin-H2 D-synthase (PTGDS), uromodulin (UROM), alpha-1-microglobulin (AMBP) and cystatin-C (CYSC), as shown in Figure 1.
Figure 1.
Western blot analysis
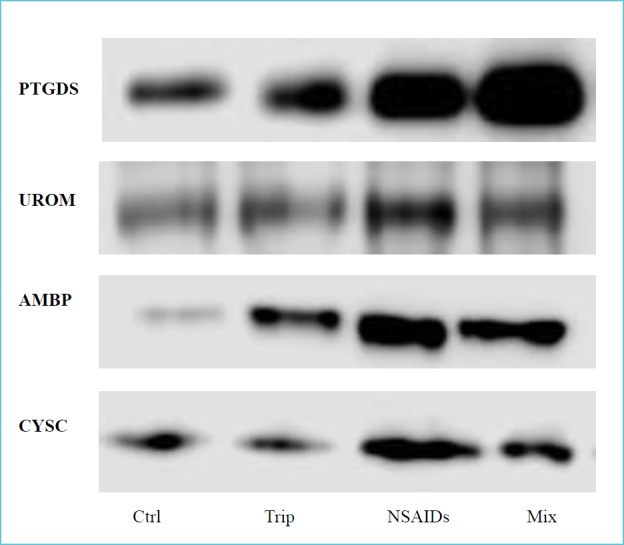
The protein expression was evaluated on urine samples in controls (Ctrl), triptans (Trip), NSAIDs and mixtures group (Mix). For each protein tested the signal is higher in NSAIDs and mixtures abusers compared to controls.
Immunoblotting allowed to confirm previous data of over-expression of these proteins in urine of MOH patients (especially NSAIDs and mixtures abusers) vs normal controls (6).
Finally, PTGDS was further quantified by the ELISA test (Figure 2), which proved its significant increase in all MOH groups: mixtures (681 ± 218 ng/mL), NSAIDs (572 ± 135 ng/mL,) and triptans (450 ± 116 ng/mL), compared to the controls (303 ± 130 ng/mL). These data points, expressed as mean ± standard deviation, were in strict accordance with MS and Western blot results (6).
Figure 2.
ELISA test of PTGDS protein
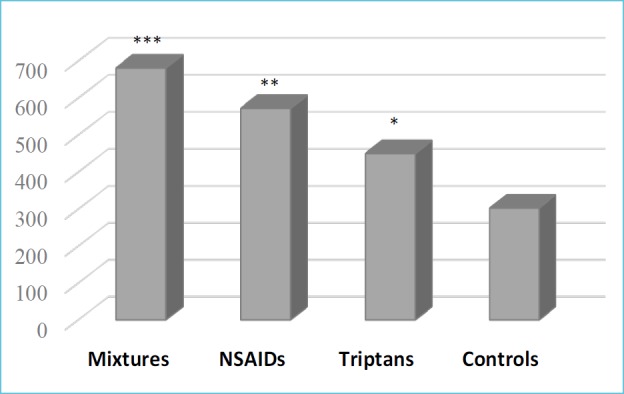
Significant difference was estimated by the Student’s t-test (*p<0.01, **p<0.0001, ***p<1.00-06 vs controls).
The results of this study allowed to define the urinary protein profile of MOH, in relation to the type of drug abused. The use of powerful proteomic methodologies could permit to identify promising candidate biomarkers of kidney dysfunctions, and consequently those chronic headache patients at risk to develop drug-induced nephrotoxicity.
CONCLUSIONS
In conclusion, urinary proteomics proved to be a suitable tool in nephro-toxicological research. Actually, its application may be useful in the search of early biomarkers, providing important diagnostics and prognostics indications.
Additionally, the study of the urinary proteome can offer significant data for a better understanding of renal pathophysiology.
REFERENCES
- 1.Pejcic M, Stojnev S, Stefanovic V. Urinary proteomics – a tool for biomarker discovery. Renal Failure 2010; 32:259-268. [DOI] [PubMed] [Google Scholar]
- 2.Kalantari S, Jafari A, Moradpoor R, Ghasemi E, Khalkhal E. Human urine proteomics: analytical techniques and clinical applications in renal diseases. Int J Proteomics 2015; ID 782798 [DOI] [PMC free article] [PubMed] [Google Scholar]
- 3.Bellei E, Rossi E, Lucchi L, Uggeri S, Albertazzi A, To-masi A, lannone A. Proteomic analysis of early urinary biomarkers of renal changes in type 2 diabetic patients. Proteomics Clin Appl 2008; 2:478-491. [DOI] [PubMed] [Google Scholar]
- 4.Bellei E, Cuoghi A, Monari E, Bergamini S, Fantoni LI, Zappaterra M, Guerzoni S, Bazzocchi A, Tomasi A, Pini LA. Proteomic analysis of urine in medication-overuse headache patients: possible relation with renal damages. J Headache Pain 2012; 13:45-52. [DOI] [PMC free article] [PubMed] [Google Scholar]
- 5.Bellei E, Monari E, Cuoghi A, Bergamini S, Guerzoni S, Ciccarese M, Ozben T, Tomasi A, Pini LA. Discovery by a proteomic approach of possible early biomarkers of drug-induced nephrotoxicity in medication-overuse headache. J Headache Pain 2013; 14:6. [DOI] [PMC free article] [PubMed] [Google Scholar]
- 6.Bellei E, Monari E, Bergamini S, Cuoghi A, Tomasi A, Guerzoni S, Ciccarese M, Pini LA. Validation of potential candidate biomarkers of drug-induced nephrotoxicity and allodynia in medication-overuse headache. J Headache Pain 2015; 16:77. [DOI] [PMC free article] [PubMed] [Google Scholar]
- 7.Pena MJ, Nischak H, Heerspink HJI. Proteomics for prediction of disease progression and response to therapy in diabetic kidney disease. Diabetologia 2016; 59:1819-1831. [DOI] [PMC free article] [PubMed] [Google Scholar]
- 8.Moresco RN, Mainardi de Carvalho JA. Applying proteomics to diagnosis of diabetic kidney disease. Exp Rev Proteomics 2017; 14:841-843. [DOI] [PubMed] [Google Scholar]
- 9.Dieterle F, Perentes E, Cordier A, Roth DR, Verdes P, Grenet O, Pantano S, Moulin P, Wahl D, Mahl A, End P, Staedtler F, Legay F, Carl K, Laurie D, Chibout SD, Vonder-scher J, Maurer G. Urinary clusterin, cystatin C, β2-microglobulin and total protein as markers to detect drug-induced kidney injury. Nat Biotechnol 2010; 25:463-469. [DOI] [PubMed] [Google Scholar]