

Abstract
Phyllanthus emblica Linn. is the most important medicinally useful tree crop in Asian Subcontinent and is severely infested by Betousa stylophora Swinhoe, known as shoot gall maker (SGM). This pest tunnels the shoots of seedlings and actively growing branches of trees and develops gall, leading to stunted growth, unusual branching and death of actively growing shoots. Our study revealed that trees possessing smooth bark were free from the attack of this pest than those with rough bark surface. Unfortunately, this character is not detectable either at seedling stage or during early growth of trees in the orchard. RAPD genetic fingerprinting of trees possessing smooth and rough bark revealed distinguishable and highly reproducible DNA banding pattern between the two genotypes. Of the 20 RAPD primers tested, five of them produced distinguishable RAPD bands between rough and smooth barked genotypes of P. emblica. Trees with smooth bark produced five unique RAPD bands with molecular weight ranging from 350 bp to 1500 bp and those with rough bark produced six RAPD bands (350 bp–650 bp) to utilize these DNA bands as potential DNA marker for screening tolerant genotypes of this crop against SGM. The utility of this finding in genetic improvement of this tree crop against SGM is discussed.
Keywords: Amla, Indian Gooseberry, Phyllanthus emblica, Shoot gall maker, RAPD marker, Genetic improvement, Tolerant germplasm
1. Introduction
Phyllanthus emblica Linn (Syn. Emblica officinalis Gaertn), commonly known as ‘amla’ and ‘Indian Gooseberry’ is one of the popular horticultural fruit crops in Asian Subcontinent for its rich source of vitamin C and medicinal values [1]. Establishment of orchards and sustainable yield is seriously hampered by shoot gall maker (SGM) as this pest attacks seedlings and trees of all the commercial varieties during June–December [2]. Severe infestation of P. emblica by SGM often leads to significant level of crop loss since this pest attacks young crop bearing branches [3]. Genetic improvement of Indian Gooseberry against SGM by conventional breeding methods is extremely difficult due to complex genetic nature of this tree in addition to very tiny flower [4], [5], [6]. Thus, search for natural selection is one of the approaches for developing new varieties with tolerance to SGM.
The types of bark texture among different genotypes of a species form well defined and differential microhabitats for pests to complete their life cycle. Smooth textured bark on tree was reported to be an important trait as an anatomical defense against epiphytic vegetation and insect pests [7]. Smooth bark makes it harder for epiphytes and insects to grip on the surface of the trunk, including the primary and actively growing branches [8]. The density and diversity of insects on the bark surface in trees species is primarily influenced by bark texture [9]. It was demonstrated that bark with rough surface has greater diversity of micro and macro-insects and contrastingly, smooth barked trees harbor either less or no insects [10]. It was reported that structure and color of the bark play a crucial role in tolerant mechanism of several tree species [11], [12], [13].
Thicker bark with crevices provides ambient microclimates for the pests to complete their life cycle than the thinner bark [14], [15]. Trees with thinner bark receive strong solar radiation due to poor or lack of insulation, leading to unfavorable temperature for the survival of pest on the bark [16], [17]. Natural forest comprises tree species with different bark types and they provide ambient microclimates for the survival of a variety of arthropod communities [8]. In our survey, population of P. emblica possessing smooth bark surface were generally free from the attack of SGM while trees with rough bark surface were severely infested. Unfortunately, this trait was not detectable either at seedling stage or at early establishment of plants in the field. However, visual differentiation of smooth and rough barked trees could be noticed only after 6–7 years of age after the field establishment. This study reports the influence of bark texture on the incidence of SGM. Trees possessing smooth and rough bark surface were evaluated for tree health and yield. RAPD markers were developed for discrimination between smooth and rough barked genotypes. Utilization of these DNA markers for management of SGM and genetic improvement of P. emblica is discussed.
2. Experimental
2.1. Study area
The selected study area comprised of six different geographical locations which includes Sengottai, Tenkasi, Ambasamudram, Kalakkad, Mundanthurai and Alangulam in Tirunelveli District of Tamilnadu which form an extreme part of southern part of India (Fig. 1). These areas are situated close to the Southern Western Ghats lying in the Northern half of Tirunelveli District, Tamilnadu State, between latitudes 8°30′–8°59′N and longitudes 77°10–77°35′E. The annual rainfall and temperature recorded in these places were highly variable from 85 to 215 cm and 26 °C to 36 °C, respectively. However rainfall pattern in these areas was not evenly distributed throughout the year. These areas receive maximum rainfall during September and October–December during South–West Monsoon and North–East Monsoon, respectively. Extensive field observation was carried out in all the study areas during June–December, which records highest incidence of SGM.
Figure 1.
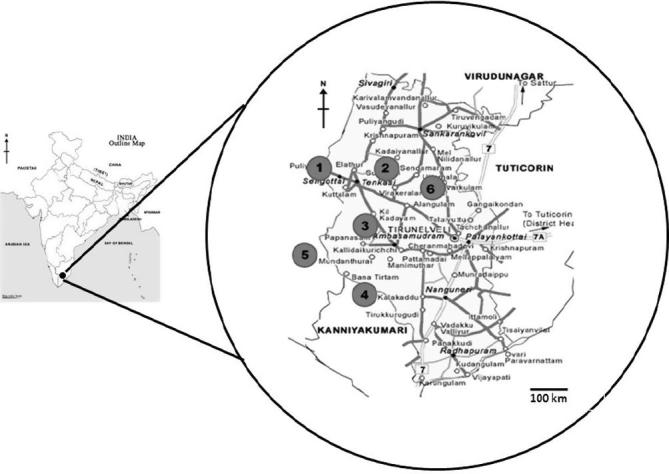
Study area: Map showing the location of sampling and study areas in Tirunelveli District, Tamilnadu in the Western Ghats region of Southern part of India (1. Sengottai, 2. Tenkasi, 3. Ambasamudram, 4. Kalakkad, 5. Mundanthurai, 6. Alangulam).
2.2. Field observations
The orchards subjected to field observations were randomly cultivated with P. emblica possessing rough and smooth bark surface (Fig. 2). Observation was carried out on the incidence of SGM in all the selected geographical locations, each comprising 400 well grown 15 years old trees. There were 17 parameters comprising vegetative and reproductive features were included in this study. Observation on tree shape, internodal length, leaf size, fruit size, fruit yield were recorded and analyzed in order to correlate these parameters with SGM incidence. In addition, percentage of SGM incidence, number of shoot galls per tree, defoliation, rejuvenation of young shoots after infestation, bark thickness with crevices and overall tree health was recorded. Data on the incidence of SGM were analyzed critically to associate with smooth and rough barked trees.
Figure 2.

Morphology of rough and smooth barked trees of P. emblica. (a) Rough barked trees shows irregular splitting of brown color bark with many small and widen crevices, (b) ash color of smooth and shiny bark with white patches without any peeling or crevices.
2.3. Isolation of genomic DNA
Genomic DNA was extracted from frozen leaf tissues of P. emblica by Cetyl Trimethyl Ammonium Bromide (CTAB) method with minor modification [18]. About 0.1 g of leaf tissue was ground into fine powder under liquid N2 using sterile/chilled mortar and pestle. The powder samples were added into 1 ml of extraction buffer (100 mM Tris, pH 8.0, 1.4 M NaCl, 20 mM EDTA, pH 8.0, 2% CTAB, 0.3% β - Mercaptoethanol and 1% PVP of Sigma-Aldrich, Mumbai, India) in a centrifuge tube and incubated at 60 °C for 60 min in heating block (Thermo Fisher Scientific, Mumbai, India). Samples were allowed to attain RT, and equal volumes of (24:1) chloroform and isoamyl alcohol (HiMedia Laboratories, Mumbai, India) were added and gently mixed to form an emulsion. Samples were spin at 12,000 rpm for 10 min in centrifuge (Kubota, Japan).
After centrifugation, supernatant was gently taken out without disturbing the debris at the bottom layer. The supernatant was washed once again with chloroform and isoamyl alcohol (24:1) and subjected to another round of centrifugation at 12,000 rpm for 10 min. Supernatant was taken out and added with 2/3 volume of the isopropanol (Hi Media Laboratories, Mumbai, India) and incubated at −80 °C (Cryo Scientific Systems Private Limited, Chennai, India) for 60 min. Samples were centrifuged at 12,000 rpm for 12 min, and the supernatant was carefully removed without disturbing DNA pellet and washed with 20 μl of 70% ethanol before centrifugation at 12,000 rpm for 5 min. Ethanol was removed by pipetting, and the final DNA pellet was vacuum dried for 15 min. DNA pellet was resuspended in 50 μl of 0.1 × TE buffer, pH 8 (10 mM Tris, 1 mM EDTA) and stored at −20 °C (Blue Star, India). DNA was run in 0.8% agarose gel (Sigma-Aldrich, Mumbai, India) to determine the quality of DNA.
2.4. Screening of RAPD primers
About 20 RAPD primers (OPAG15; OPAR10; OPAS09; OPAL12; OPU06; OPN02;OPBH04; OPAJ14; OPO14; OPAP20; OPAX 06; OPF 14; OPC 11; OPAD 15; OPO 09; OPK 05; OPI 08; OPS 10; OPP 20; OPAN 05) procured from Genei (Bangalore, India) were initially tested for screening suitable primers. DNA isolated from mixed leaf samples collected randomly from smooth and rough barked trees were used as a template DNA. The PCR mixture consists of 10 × Taq buffer (2.5 μl), 1.6 mM MgCl2 (0.6 μl), 200 mM dNTP’s(0.5 μl), 0.15 U of Taq DNA Polymerase, primer (10 pmol), template DNA (25 ng). The final volume was made up to 25 μl using nuclease free water. The condition for PCR amplification was 94 °C for 4 min (Initial denaturation), 94 °C for 1 min (Denaturation), followed by 30 cycles (Annealing) at 37 °C for 1 min, 72 °C for 2 min (Extension) and 72 °C for 6 min (Final extension). Amplified DNA samples with all the 25 primers were run in 0.8% agarose gel, and RAPD fragments generated in this experiment were documented using gel documentation (Chemi - Doc Machine, Gel Logic 2200 PRO, USA).
2.5. Molecular distinction between smooth and rough barked trees by RAPD marker
Screening of primers was done based on the maximum number of observed bands from the previous experiment. Based on the number, density and reproducibility of bands, only five primers (OPAG 15, OPAR 10, OPAS 09, OPAL 12 and OPU 06) were used further to develop RAPD fingerprints between the smooth and rough barked trees. In this experiment, leaf samples from 10 different trees each from smooth and rough barked trees of six different locations (Fig. 1) were used. Fingerprints of rough and smooth barked genotypes were developed, and unique DNA bands observed between them were scored as DNA marker for their distinction.
2.6. Statistical analysis
To document the characteristic feature of smooth and rough barked trees, 400 individual trees were observed for each parameter and statistically analyzed. The level of significance was determined by analysis of variance (ANOVA) using SPSS version 16.0.
3. Results
3.1. Characteristic features of rough and smooth barked trees
Primary branches of rough barked trees of P. emblica were semi-spread in nature whereas trees with smooth barked surface were typically characterized with upright growth habit (Table 1). Internodes of rough barked trees were significantly shorter as compared to smooth barked trees. High density of dead branches due to severe infestation by SGM was seen in rough barked trees. Contrastingly, actively growing shoots of smooth barked trees were not infested by SGM. Fruit set of rough barked trees was poor with 21% where as smooth barked trees shown 58% fruit setting. The size of the berry was significantly smaller with 1.12 cm and 1.72 cm length and width, respectively where as smooth barked trees yielded larger fruits with 3.10 cm and 4.02 cm length and width, respectively. Fruit yield per tree in rough barked trees was poor with 21.15 kg/tree where as smooth barked trees were found to yield more crops with 106.09 kg fresh fruits/tree.
Table 1.
Phenotypic observations of P. emblica possessing rough and smooth bark. Data represent the mean values of four replications, each with 100 trees.
| Characteristics | Rough barked trees | Smooth barked trees |
|---|---|---|
| Tree shape | Spready | Upright |
| Vegetative growth | Poor | Good |
| Inter nodes (cm) | 0.63 ± 0.05 | 1.19 ± 0.13* |
| Leaf length (cm) | 1.45 ± 0.26 | 1.2 ± 0.17* |
| Leaf width (cm) | 0.46 ± 0.12 | 0.48 ± 0.15* |
| Dead branches/tree | 35–40 | – |
| Fruit set | 21% | 58% |
| Fruit retention | 2% | 15% |
| Fruit length (cm) | 1.12 ± 0.02 | 3.10 ± 0.22* |
| Fruit width (cm) | 1.72 ± 0.017 | 4.02 ± 0.09* |
| Fruit size | Small | Large |
| Fruit yield/Tree (kg) | 21.15 ± 4.03 | 106.09 ± 9.02* |
Mean values are significant at p ≤ 0.05.
3.2. Tree health and incidence of SGM in rough and smooth barked trees
Trees with rough barked surface often showed severe infestation of SGM with unusual branching. Contrastingly, trees with smooth barked surface did not show any visible symptom of infestation of SGM. Rough barked trees had thicker bark with 1.1 cm width, while trees with smooth bark had thinner bark with only 0.31 cm width. Rough barked trees with severe infestation of SGM shed their leaves heavily from actively growing branches. About 60.2% populations of rough barked trees were affected by SGM as compared to 7.16% in case of smooth barked trees. The number of galls in rough barked trees was ranged from 25 to 40 and 2 to 3 in case of smooth barked trees (Table 2).
Table 2.
Tree health and incidence of shoot gall maker in rough and smooth barked trees of P. emblica. Data collected from four replications each with 100 trees.
| Characteristics | Rough barked trees | Smooth barked trees |
|---|---|---|
| Tree health | Poor, secondary and tertiary branches were often dead with severe infestation with unusual branching | Trees healthy with rare occurrence of infestation without affecting shoot growth |
| Bark thickness (cm) | 1.11 ± 0.19 | 0.31 ± 0.05* |
| Foliage | Dense in unaffected branches | Sparse |
| Rejuvenation | Infested branches dead without rejuvenation | Galls seen with very less incidence without affecting the growth |
| Defoliation (%) | 80–90% of the leaves defoliated in SGM infested branches | No defoliation. Older leaves were retained |
| SGM Incidence (%) | 60.2 | 7.16 |
| No. of galls/tree | 25–40 | 2–3 |
Mean values are significant at p ≤ 0.05.
3.3. Screening of RAPD primers
The random decamer oligonucleotide primers used for screening were based on the published work [19]. Of the 20 primers, nine primers were from A series, two were from O series and the remaining nine primers each from B, P, U, N, K, F, C, S and I series. All the 20 primers had produced a total 104 RAPD fragments (Table 3). Primers of A series had produced more amplification fragments ranging from 3 to 7 as compared to other series. Among the nine A series primer, only 3 primers (OPAG 15, OPAJ 14, OPAD 15) had produced maximum number of DNA fragments with the molecular weights ranged from 350 to 3000 bp. The other series of primer (OPU 06) was also considered due to maximum number of amplicons produced. In this study, only five primers (OPAG 15, OPAR 10, OPAS 09, OPAL 12, OPU 06) had produced consistent banding pattern with 6–11 bands with the molecular weight ranging from 350 to 2500 bp (Fig. 3). Thus, these primers were further used to distinct the trees possessing smooth and rough barked trees.
Table 3.
Screening of primers for development of RAPD markers. The name of the primer series with nucleotide sequences, GC content and number of amplified fragments by each primer with their size ranges are presented.
| Primer series | Nucleotide sequences (5′–3′) | GC (%) | No. of bands | Size range (bp) |
|---|---|---|---|---|
| OPAG 15 | CCCACACGCA | 70 | 07 | 350–800 |
| OPAR 10 | TGGGGCTGTC | 60 | 05 | 300–800 |
| OPAS 09 | TGGAGTCCCC | 70 | 06 | 300–1000 |
| OPAL 12 | CCCAGGCTAC | 70 | 03 | 400–1200 |
| OPU 06 | ACCTTTGCGG | 60 | 09 | 400–2500 |
| OPN 02 | ACCAGGGGCA | 70 | 08 | 350–2500 |
| OPBH04 | CCCGGATACA | 60 | 06 | 500–1500 |
| OPAJ 14 | ACCGATGCTG | 60 | 07 | 600–1200 |
| OPO14 | AGCATGGCTC | 60 | 07 | 500–1500 |
| OPAP20 | CCCGGATACA | 60 | 05 | 700–900 |
| OPAX06 | AGGCATCGTG | 60 | 04 | 700–900 |
| OPF14 | TGCTGCAGGT | 60 | 05 | 500–2500 |
| OPC11 | AAAGCTGCGG | 60 | 03 | 500–900 |
| OPAD15 | TTTGCCCCGT | 60 | 07 | 350–3000 |
| OPO09 | TCCCACGCAA | 60 | 07 | 350–3000 |
| OPK05 | TCTGTCGAGG | 60 | 06 | 600–850 |
| OPI08 | TTTGCCCGGT | 60 | 01 | 700 |
| OPS10 | ACCGTTCCAG | 60 | 03 | 500–900 |
| OPP20 | GACCCTAGTC | 70 | 00 | – |
| OPAN 05 | GGGTGCAGTT | 60 | 05 | 500–1500 |
Figure 3.

Screening of primers for development of RAPD markers associated with smooth and rough barked trees of P. emblica. Selected 20 primers [nine from A series (OPAG 15, OPAR 10, OPAS 09, OPAL 12, OPAP20, OPAX06, OPAN 05, OPAJ 14 and OPAD15); two from O series (OPO14 and OPO09) and remaining 9 primers each from B (OPBH04), P (OPP20), U (OPU 06), N (OPN 02), K (OPK05), F (OPF14), C (OPC11), S (OPS10) and I (OPI08) series] showing varying number of bands.
3.4. Development of unique RAPD marker associated with smooth barked trees
About 10 plants each from smooth and rough barked trees when amplified with five selective primers, genotype specific unique bands were observed (Table 4). Primer OPAG15 had produced two unique amplicons with molecular weights 450 bp and 550 bp in rough barked trees. Similar primer had produced another two unique amplicons with 350 bp, 750 bp from smooth barked trees. OPAR 10 had produced two amplicons with 350 bp and 450 bp in rough barked trees but these bands were absent in smooth barked trees. OPAS 09 produced only one unique amplicon with the molecular weight 350 bp in smooth barked trees but absent in rough barked trees. OPAL 12 had produced three unique amplicons, one with 650 bp in rough barked trees and two (700 bp, 1500 bp) in smooth barked trees. OPU 06 had produced only one unique band (580 bp) in rough barked trees (Fig. 4).
Table 4.
Distinction of smooth and rough barked trees of P. emblica based on unique RAPD bands. Five selective primers amplified six unique bands from rough barked (Susceptible) trees and five unique bands from smooth barked (Tolerant) trees.
| Primer code | No. of bands amplified in |
Unique bands (bp) belong to |
||
|---|---|---|---|---|
| Rough barked genotype | Smooth barked genotype | Rough barked genotype | Smooth barked genotype | |
| OPAG15 | 6 (300–900) | 5 (350–900) | 450, 550 | 350, 750 |
| OPAR10 | 6 (320–1000) | 4 (300–1000) | 350, 450 | – |
| OPAS 09 | 8 (400–3000) | 9 (350–3000) | – | 350 |
| OPAL12 | 6 (450–1000) | 5 (700–1500) | 650 | 700, 1500 |
| OPU-06 | 6 (500–2000) | 7 (500–2000) | 580 | – |
Numbers indicated within parenthesis are molecular weight (bp) ranges amplified by each primer in rough and smooth barked trees.
Figure 4.

RAPD pattern showing distinction between susceptible (S) trees having rough bark and tolerant (T) trees having smooth bark in P. emblica; Primers OPAG 15, OPAS 09 and OPAL 12 showing unique ampilcons with the molecular weights of 750 bp, 350 bp and 700 bp, respectively in smooth barked trees (shown in arrow mark).
4. Discussion
P. emblica is one of the most important horticultural crops for its rich source of vitamin C [20] besides for its diverse medicinal uses [21]. Although genetic diversity of P. emblica among the cultivated and wild genotypes was documented [5], progress on genetic improvement of P. emblica against pest and diseases is very slow due to its long juvenile phase, perennial growth, complex taxonomy and tiny flower size [2]. The present strategy for genetic improvement of P. emblica relies only on natural selection. Cultivation of P. emblica facing a serious problem due to its susceptibility to SGM [2] and severe infestation of P. emblica even devastates the entire orchards [2]. Control of this pest involves application of health hazardous pesticides such as monocrotophos, chlorphyriphos, carbaryl and quinalphos [22], [23]. Search for tolerant genotypes of P. emblica against SGM is one of the approaches to overcome this pest [4], [24]. Morphological characteristics have been used as markers for screening tolerant phenotypes against insect pests in many agricultural crops [25], [26]. In our study, trees of P. emblica with smoother bark were largely free from SGM, and this finding supports the earlier reports in Fagus sylvatica L. [16] and Pinus nigra [12]. In this study, trees with smooth bark were generally free from the incidence of SGM, and a set of RAPD markers were identified for genotype possessing smooth bark.
The reduction in size of fruits and yield in rough barked trees could be due to poor transportation of water and mineral nutrients to actively growing cropping branches as a result of shoot gall formation by SGM. High incidence of SGM (30–40 infested branches/tree), followed by complete defoliation and death of trees was observed only in rough barked trees. Contrastingly, smooth barked trees were relatively free from the incidence of SGM. Thus, the absence of SGM incidence was associated with smoothness of bark in P. emblica. Our finding supports the hypothesis that smooth textured bark can be an anatomical defense against epiphytic vegetation and insect pests [8]. Bark with rough surface has shown to host greater diversity of insect pests than smooth barks [10]. Trees with smooth bark surface play a crucial role to defend against insect pests and pathogen with specific biochemical [27], [28] and anatomical structure [7], [29]. But this observation has received a little consideration to be utilized as morphological marker for screening resistant/tolerant trees against insect pests [30], [31].
In P. emblica, trees with smooth bark texture were completely free from SGM attack as this makes it harder for the pest to grip on tree surface and reduce the ability to remain on the trunk and branches [8]. Our finding was further supported by the demonstration that smooth bark can limit attacks by insects on trees even for pests specialized in attacking tree stem [8]. Unfortunately, seedlings of P. emblica at nursery stage did not reveal any difference in bark texture. The rough and smooth nature of bark among the population of P. emblica could be clearly detected only after 6–7 years of establishment in the field. The RAPD markers developed in this study could clearly distinguish the trees of P. emblica possessing smooth and rough barks. In our study, five primers (OPAG 15, OPAR 10, OPAS 09, OPAL 12 and OPU 06) had produced a total of five unique bands with molecular weights ranging from 350 bp to 1500 bp, and these bands were detected only in smooth barked trees. As these DNA bands are easily scorable and highly reproducible upon repeated experiments, they can be used as a potential DNA marker for early screening of P. emblica possessing smooth bark which is tolerant against SGM. Screening of such genotype using these DNA markers ensures the distribution of SGM tolerant genotypes for establishment of orchards.
RAPD markers are often unreliable as compared to other molecular markers due to poor reproducibility [46]. However, this technique is cheaper to develop DNA marker and highly useful if results are reproducible. Despite the development of many improved DNA markers, a series of report revealing the utility of RAPD markers for a variety of application in P. emblica such as species identification [47], varietal characterization (19) and analysis of genetic relationship (45). It was claimed that a set of only four decamer primers could distinguish all the Indian varieties of P. emblica which was otherwise difficult to differentiate using morphological markers (19). Recently, RAPD primers have shown to produce 56.18% polymorphism with high polymorphic information content (PIC) of 83.1% for distinction of different varieties of P. emblica [48]. In our study, RAPD primers included for screening had produced DNA bands from very low to high molecular weight ranging from 300 bp to 3000 bp.
Although, the number of primers screened was only five, they could clearly differentiate the smooth and rough barked genotypes of P. emblica and produced six bands unique to rough barked trees and five bands unique to smooth barked trees without any overlapping of band size between them. These RAPD markers were dense and easily scorable in addition to high reproducibility for utilization as efficient DNA marker. RAPD analysis is a simple and rapid method [32] and is well suited for characterization of plant genetic resources [33]. The DNA fingerprints generated by the arbitrary primers provide sufficient information for detection of DNA polymorphism [34], [35]. RAPD markers are dominant in nature, non-locus specific [36], [37] and extensively used for genetic diversity analysis within the species of crop plants. Despite of its poor reproducibility [38], RAPD marker become handy in marker assisted selection of many crops such as apple [39], tree legumes [40], Terminalia bellirica [41], Melientha suavis [42] and Acacia [38].
In P. emblica, RAPD or ISSR markers are utilized for detection of gamma induced mutants [43], assessment of genetic variability among the cultivars [19], [44], genetic relationship of Phyllanthus species [20], [45] and molecular identity of cultivars [21]. The present work reports the utility of RAPD marker associated with shoot gall maker tolerant genotypes of P. emblica. This is the first report on development of RAPD marker linked with tolerant genotype of P. emblica against one of the deadly pests (SGM) in this crop. We also report that the RAPD marker tightly linked with smooth and rough barked trees of P. emblica are highly unique upon repeated PCR experiments with both types of trees. Due to consistent banding pattern and reproducible result, these DNA markers are expected to be useful in genetic improvement of this crop.
P. emblica is a perennial tree and requires intensive cultivation during early stage of field establishment as this tree is associated with more than 30 insects and mites which feed on a variety of plant parts [3] and causing severe crop loss in both traditional and non-traditional areas. However, trees with smooth bark are identifiable only after later stage of establishment in the field, and no reliable marker has been developed for predicting this trait at seedling stage. The present finding is expected to be highly useful to complement in genetic improvement of P. emblica through conventional breeding approaches. Selection of tolerant varieties against pests and diseases is one of the important components in integrated pest management (IPM). In our finding, P. emblica with smooth bark is considered as potential germplasm in IPM, and RAPD markers identified in trees possessing smooth bark can be integrated with conventional methods of genetic improvement of P. emblica against SGM.
5. Conclusions
In conclusion, a reliable method has been developed for discrimination of tolerant and susceptible genotypes of P. emblica against SGM by RAPD marker. This marker could be further validated into a potential SCAR marker.
Acknowledgments
This work is financially supported by the University Grants Commission, Government of India, New Delhi under the project ‘Collection, conservation and molecular characterization of wild and hybrid derivatives of Amla (Phyllanthus emblica) germplasm in Tirunelveli District, Tamilnadu (No.53-244/2007(SR) dated 24 December 2007). Part of this work is supported by Department of Science & Technology under Promotion of University Research and Scientific Excellence (DST-PURSE), Govt of India, New Delhi.
Acknowledgments
Author contributions
Authors equally contributed to the present paper.
Footnotes
Peer review under responsibility of National Research Center, Egypt.
References
- 1.Shankar. Indian Horticult 1969;13: 9-11-15.
- 2.Pathak RK. International Plant Genetic Resources Institute; 2003.
- 3.Bharpoda T.M., Koshiya D.J., Korat D.M. J Agric Sci. 2009;22:314–318. [Google Scholar]
- 4.Pareek OP. Exploitation of underutilized fruits, Udaipur, Rajasthan, India; 2001. p. 116–18.
- 5.Rai M., Gupta P.N., Pathak R.K., Rana R.S. Indian J Plant Genetic Resour. 1993;6:117–123. [Google Scholar]
- 6.Dhandhar DG, Shukla AK. In: Proceedings on production and utilization of amla, Tamil Nadu, India; 2003.
- 7.Black H.L., Harper K.T. Biotropica. 1979;11:240. [Google Scholar]
- 8.Ferrenberg S., Mitton J.B. Funct Ecol. 2014;28:837–845. [Google Scholar]
- 9.Cramer M.B. Bryologist. 1975;78:44–56. [Google Scholar]
- 10.Wardle D.A., Yeates G.W., Barker G.M., Bellingham P.J., Bonner K.I., Williamson W.M. Science. 2003;301:1717–1720. doi: 10.1126/science.1087809. [DOI] [PubMed] [Google Scholar]
- 11.Wood D.L. Annu Rev Entomol. 1982;27:411–446. [Google Scholar]
- 12.Roland H., Csaba S. Acta Biol Debrecina. 2002;24:87–101. [Google Scholar]
- 13.Hanely M.E., Lamont B.B., Fairbenks M.M., Rafferty C.M. Perspectives in plant ecology. Evol System. 2007;8:57–178. [Google Scholar]
- 14.Putnam RJ, Wratten SD. University of California Press, Berkeley and Los angeles, California; 1984.
- 15.Nicolai V. Oecologia. 1989;80:421–430. doi: 10.1007/BF00379046. [DOI] [PubMed] [Google Scholar]
- 16.Nihlgard B. Oikos. 1972;23:69–81. [Google Scholar]
- 17.Pavlov M.B. Gottbodenkundl Ber. 1973;29:193–210. [Google Scholar]
- 18.Bharatha Nandhini R.M., Rahul R.N., Thilaga S., Surya Prakash Rao N., Ganesh D. South Afr J Botany. 2013;88:334–340. [Google Scholar]
- 19.Chaurasia A.K., Subramaniam V.R., Krishna B., Sane P.V. Physiol Mol Biol Plants. 2009;15:169–173. doi: 10.1007/s12298-009-0019-5. [DOI] [PMC free article] [PubMed] [Google Scholar]
- 20.Manissorn J., Ruangrungsi N., Phadungcharoen T., Sukrong S. J Health Res. 2010;24:73–79. [Google Scholar]
- 21.Meshram P.B., Soni K.K. J Horticult Forest. 2011;3:190–194. [Google Scholar]
- 22.Haseeb M., Abbas S.R., Srivastava R.P., Sharma S. NarendraDev J Agric Res. 1990;5:116–119. [Google Scholar]
- 23.Haseeb M., Abbas S.R., Srivastava R.P., Sharma S. Plant Proc Sci. 2000;8:85–88. [Google Scholar]
- 24.Shukla AK. In: Proceedings on production and utilization in amla, Tamil Nadu, India; 2003.
- 25.Niles G.A. J Econ Entomol. 1980;68:743–746. [Google Scholar]
- 26.Leghari M.L., Kalroo A.M., Leghari A.M. J Biol Sci. 2001;4:1506–1508. [Google Scholar]
- 27.Krabel D., Petercord R. Tree Physiol. 2000;20:485–491. doi: 10.1093/treephys/20.7.485. [DOI] [PubMed] [Google Scholar]
- 28.Petrakis P.V., Spanos K., Feest A., Daskalakou E. Int J Mol Sci. 2011;12:2769–2782. doi: 10.3390/ijms12052769. [DOI] [PMC free article] [PubMed] [Google Scholar]
- 29.Franceschi V.R., Krokene P., Christiansen E., Krekling T. New Phytol. 2005;167:353–376. doi: 10.1111/j.1469-8137.2005.01436.x. [DOI] [PubMed] [Google Scholar]
- 30.Farjon A, Brill EJ. Leiden, Netherlands; 1984.
- 31.Biswas C., Johri B.M. Biotropica. 1997;11:240. [Google Scholar]
- 32.Williams J.G.K., Kubelik A., Livak K.J., RafalskI J.A., Tingey S.V. Nucl Acids Res. 1990;18:6531–6535. doi: 10.1093/nar/18.22.6531. [DOI] [PMC free article] [PubMed] [Google Scholar]
- 33.Anderson W.R., Fairbanks D.J. Diversity. 1990;6:51–53. [Google Scholar]
- 34.Byrne M., Murrell J.C., Allen B., Moran G.F. Theor Appl Genet. 1995;91:869–875. doi: 10.1007/BF00223894. [DOI] [PubMed] [Google Scholar]
- 35.Verhaegen D., Plomion C. Genome. 1996;39:1051–1061. doi: 10.1139/g96-132. [DOI] [PubMed] [Google Scholar]
- 36.Kesseli R.V., Paran H., Michelmore R.W. Genetics. 1994;136:1435–1446. doi: 10.1093/genetics/136.4.1435. [DOI] [PMC free article] [PubMed] [Google Scholar]
- 37.Karp A., Seberg O., Buiatti M. Ann Bot. 1996;78:143–149. [Google Scholar]
- 38.Nanda R.M., Nayak S., Rout G.R. Biologia, Bratislava. 2004;59:115–120. [Google Scholar]
- 39.Wunsch A, Hormaza JI. Euphytica 2002;125: 59–67.
- 40.Gomez S.M., Ramasubramanian T., Mohankumar S. J Botany. 2011;43:1879–1883. [Google Scholar]
- 41.Bharti S., Vijaya K. Asian J Plant Sci Res. 2013;3:21–27. [Google Scholar]
- 42.Prathepha P. Science Asia. 2000;26:213–218. [Google Scholar]
- 43.Selvi B.S., Ponnuswami V., Sumathi T. Adv Nat Appl Sci. 2008;2:129–134. [Google Scholar]
- 44.Rane A.A., Bharat K., Vinay H., Sathyanarayana B.N. Int J Curr Res. 2012;4(07):032–036. [Google Scholar]
- 45.Rout G.R., Senapati S.K., Aparajita S. Czech J Genet Plant Breed. 2010;46:135–141. [Google Scholar]
- 46.Bhagyawant Sameer S. J Biosci Med. 2016;4:1–9. [Google Scholar]
- 47.Jain N., Shasany A.K., Sundaresan V., Rajkumar S., Darokar M.P., Bagchil G.D. Curr Sci. 2003;85:1454–1458. [Google Scholar]
- 48.Singh S.K., Meghwal P.R., Pathak R. Proc Natl Acad Sci India, Sect Biol Sci. 2015;85(4):971–978. [Google Scholar]