

Abstract
Luciferin analogues that display bioluminescence at specific wavelengths can broaden the scope of imaging and biological assays, but the need to design and synthesize many new analogues can be time-consuming. Employing a collection of previously synthesized and characterized aminoluciferin analogues, we demonstrate that computational TD-DFT methods can accurately reproduce and further explain the experimentally measured fluorescence wavelengths. The best computational approach yields a correlation with experiment of r=0.98, which we expect to guide and accelerate the further development of luciferin analogues.
Graphical Abstract
For a collection of aminoluciferin analogues, we demonstrate that computational methods can accurately reproduce and further explain experimentally observed fluorescence.
Introduction
Firefly luciferase uses d-luciferin, ATP and oxygen to generate an oxyluciferin molecule in the excited state (Figure 1). Subsequent relaxation to the ground state emits the photon that is observed in this characteristic bioluminescent reaction.[1] The firefly luciferase/d-luciferin pair is extensively used as a biological reporter,[2,3] but in vivo applications are hampered by tissue absorbing the yellow/green emission of the wild type enzyme and substrate. Therefore, efforts have been made to either engineer luciferase or to design luciferin analogues that display bioluminescence at longer wavelengths.[4–12]
Figure 1:
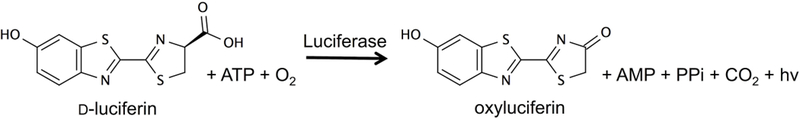
Luciferase catalytic reaction.
White and McElroy first showed that replacing the 6′-hydroxyl of luciferin with an amino group red-shifts the emission wavelength,[13] and we subsequently demonstrated that more strongly electron-donating alkylamino groups display even larger red-shifts.[14] Cyclic aminoluciferins were also designed to restrict the flexibility of the alkylamino group within the luciferase active site, ensuring overlap of the nitrogen lone pair with the conjugated system.[14] More recently we introduced several variations of these cyclic aminoluciferins to further probe substrate selectivity and modulate the emission wavelength.[15]
A number of theoretical investigations into the properties of d-luciferin and oxyluciferin have been reported previously.[16] Ren and Goddard first determined equilibrium geometries on the excited state, needed for the calculation of emission wavelengths.[17] Chen and Lindh examined the effect of the medium on the spectra.[18] More recently, a larger number of luciferin/oxyluciferin analogues have been studied, but comparison with experimentally measured emission wavelengths has been relatively limited.[19–22]
In this work we consider a collection of aminoluciferin analogues that we previously synthesized and characterized, to assess whether computational methods are (1) able to reproduce the experimentally measured wavelengths, and (2) can provide further insights into the emission mechanisms. Here we limit our scope to the fluorescence of luciferin analogues in solution to avoid the complexity and uncertainty of the luciferase environment. Although the respective oxyluciferin is the light-emitting compound in the bioluminescent reaction, the parent luciferin in solution provides a reasonable model for studying the modifications in the benzothiazole moiety, with emission wavelengths showing a correlation of r=0.90 for the series of analogues considered here.[15]
Results and Discussion
Eleven previously-reported luciferase substrates were included in this computational study (Figure 2).[14,15] Fluorescence wavelengths were obtained in phosphate-buffered saline (PBS) solution and are summarized in Table 1.[15] The fluorescence of all the alkylated aminoluciferins is red-shifted compared with both d-luciferin and 6′-aminoluciferin (1a), and the fluorescence of these aminoluciferins has been shown to correlate well with their respective bioluminescence emission wavelengths.
Figure 2:
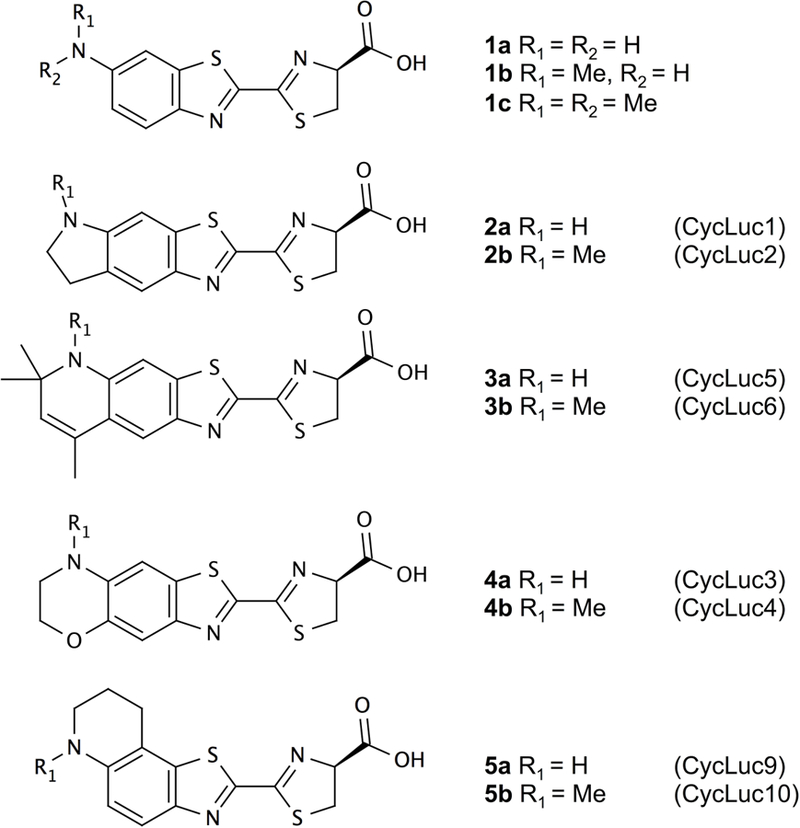
Luciferin analogues tested in this work, with in parentheses the identifiers used in [14] and [15].
Table 1:
Experimental[15] and calculated emissions (nm).
| TD-B3LYP PCM | TD-B3LYP NE-PCM | TD-CAM-B3LYP PCM | TD-CAM-B3LYP NE-PCM | TD-B3LYP | ||||||||||||||
|---|---|---|---|---|---|---|---|---|---|---|---|---|---|---|---|---|---|---|
| Compound | Exp. | Pa | Ca | Ua | Ba | Pa | Ca | Ua | Ba | Pa | Ca | Ua | Ba | Pa | Ca | Ua | Ba | Pa |
| 1a | 517 | 474 | 451 | 460 | 451 | 505 | 520 | 494 | 496 | 440 | 417 | 427 | 419 | 454 | 478 | 445 | 449 | 402 |
| 1b | 532 | 486 | 461 | 470 | 462 | 517 | 544 | 507 | 513 | 448 | 424 | 434 | 426 | 464 | 494 | 454 | 461 | 411 |
| 1c | 554 | 508 | 477 | 489 | 479 | 556 | 602 | 549 | 554 | 459 | 431 | 443 | 434 | 484 | 522 | 474 | 481 | 429 |
| 2a | 540 | 498 | 473 | 483 | 474 | 511 | 545 | 505 | 513 | 460 | 434 | 445 | 436 | 469 | 502 | 460 | 468 | 414 |
| 2b | 556 | 515 | 486 | 498 | 488 | 531 | 575 | 525 | 536 | 469 | 441 | 454 | 444 | 482 | 521 | 473 | 482 | 428 |
| 3a | 559 | 530 | 497 | 511 | 500 | 568 | 630 | 555 | 572 | 470 | 441 | 454 | 444 | 490 | 534 | 481 | 490 | 448 |
| 3b | 567 | 540 | 505 | 519 | 508 | 588 | 663 | 574 | 595 | 474 | 443 | 456 | 446 | 501 | 553 | 490 | 502 | 458 |
| 4a | 531 | 496 | 471 | 481 | 472 | 511 | 549 | 501 | 516 | 454 | 429 | 440 | 431 | 469 | 503 | 459 | 468 | 449 |
| 4b | 544 | 511 | 483 | 494 | 485 | 535 | 585 | 525 | 542 | 461 | 434 | 446 | 437 | 483 | 524 | 472 | 483 | 450 |
| 5a | 554 | 509 | 477 | 490 | 480 | 555 | 590 | 548 | 546 | 463 | 435 | 447 | 438 | 486 | 519 | 477 | 480 | 430 |
| 5b | 576 | 532 | 495 | 511 | 499 | 592 | 643 | 588 | 585 | 476 | 444 | 458 | 448 | 508 | 549 | 499 | 502 | 449 |
| Correlation | 0.94 | 0.91 | 0.92 | 0.92 | 0.92 | 0.92 | 0.94 | 0.93 | 0.95 | 0.93 | 0.94 | 0.94 | 0.97 | 0.95 | 0.98 | 0.96 | 0.65 | |
| Avg. abs. error | 39 | 69 | 57 | 67 | 15 | 38 | 18 | 15 | 87 | 114 | 102 | 112 | 67 | 30 | 77 | 69 | 115 | |
| RMS error | 40 | 69 | 57 | 67 | 17 | 48 | 21 | 17 | 87 | 115 | 103 | 112 | 67 | 31 | 77 | 70 | 116 | |
| Slope | 0.81 | 1.00 | 0.89 | 0.94 | 0.51 | 0.35 | 0.52 | 0.50 | 1.51 | 1.89 | 1.67 | 1.83 | 1.04 | 0.72 | 1.07 | 1.01 | 0.60 | |
| Intercept | 136 | 70 | 110 | 93 | 271 | 342 | 268 | 276 | -147 | -273 | -198 | -252 | 46 | 173 | 46 | 63 | 289 | |
| Fitted avg. abs. error | 5 | 6 | 6 | 6 | 4 | 6 | 4 | 5 | 4 | 5 | 5 | 5 | 3 | 4 | 3 | 4 | 10 | |
| Fitted RMS error | 6 | 7 | 6 | 7 | 6 | 6 | 5 | 6 | 5 | 6 | 6 | 6 | 4 | 5 | 3 | 4 | 13 | |
P: protonated carboxylate moiety; C: charged (negative) carboxylate moiety; U: unidentate sodium counterion; B: bidentate sodium counterion (see Figure 4)
We assessed whether time-dependent density functional theory (TD-DFT) could reproduce the magnitude and trend of the experimentally measured fluorescence values. We considered various functional and solvation model combinations (see Methods). For each compound, and at each level of theory, we first determined the lowest energy conformation on the S1 potential energy surface, which was suggested to be the light emitting state.[23] The excited state equilibrium geometry was then used to calculate the emission wavelength. However, for 1b we found two conformations of the alkylamino group that differed by less than 1 kcal/mol, and could therefore not be distinguished. The predicted emission wavelengths of the two conformations differ by 12 nm (for the best performing method), and for the lowest-energy conformation it is a slight outlier with all computational methods tested. We therefore used the alternative 1b conformation in the remainder of the analyses. Kakiuchi and Hirano reported a similar near-degeneracy for the two conformations in the ground state, but found a smaller difference of 5 nm when the S0 → S1 absorption was considered.[22] In Figure 3 we show the experimentally measured emission wavelengths against the predicted wavelengths with the best performing level of theory, with the outlier indicated.
Figure 3:
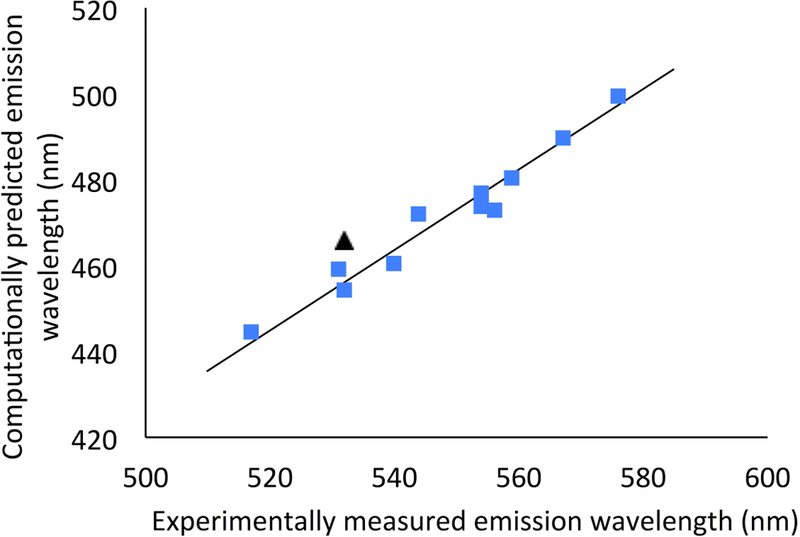
Experimental and best predicted (TD-CAM-B3LYP NE-PCM with unidentate counterion) emission wavelengths, with the other conformation for 1b indicated as black triangle.
Without inclusion of solvent effects, and assuming a protonated carboxylate moiety, the B3LYP functional showed a correlation of r=0.65 with experiment (Table 1). We then included solvent effects through the Polarizable Continuum Model (PCM), testing both the standard PCM and the non-equilibrium PCM (NE-PCM) formalisms, and using the B3LYP and CAM-B3LYP functionals. We considered the carboxylate group protonated, charged, or charged with either an unidentate (interacting with a single carboxylate oxygen) or a bidentate sodium counterion (bridging the carboxylate oxygens), as shown in Figure 4. For all approaches, the correlation improves to r>0.9 compared with the gas-phase calculation of r=0.65. For each combination of functional and solvation model, calculations with a neutral total charge (protonated carboxylate group or charged carboxylate group complexed with a counterion) always performed better or equal to those with an uncompensated carboxylate charge. However, the results were inconclusive regarding the carboxylate protonation state. When the B3LYP NE-PCM formalism was used, a carboxylate group with counterion showed a better correlation (r=0.94) with experiment than a protonated carboxylate group (r=0.92), while this was reversed when the standard PCM formalism was used (r=0.94 and r=0.92 for the protonated carboxylate group and charged carboxylate group with counterion, respectively).
Figure 4:
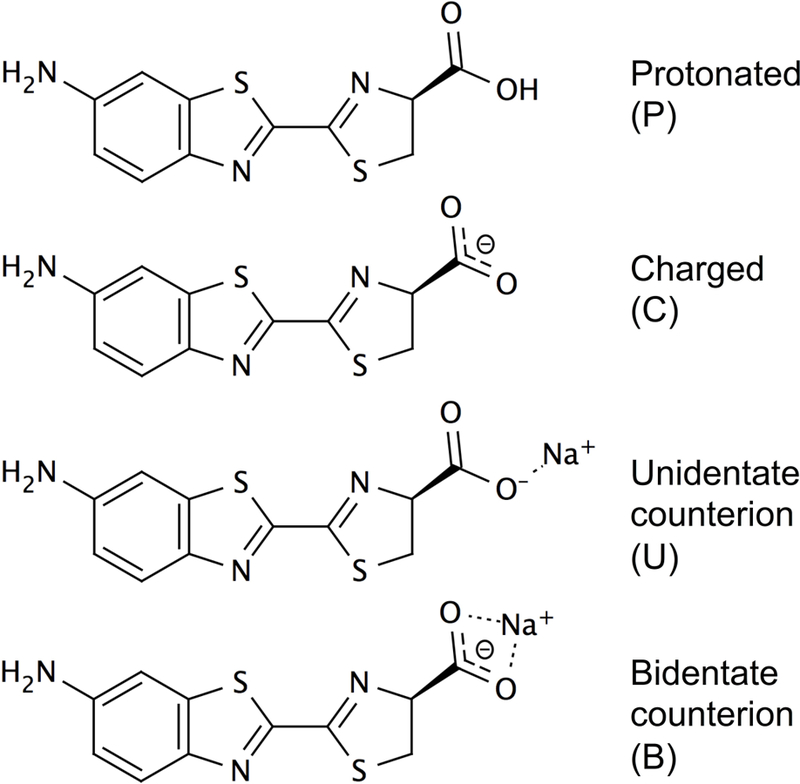
Carboxylate charge states considered, shown here for 1a.
Next we determined the best-performing combination of functional and PCM model. For the B3LYP functional we did not see a different performance between the standard and the non-equilibrium formalisms of PCM, with both showing a best correlation of r=0.94. In contrast, when we used the CAM-B3LYP functional, we obtained a better performance of r=0.98 with the non-equilibrium formalism of PCM, compared with r<=0.95 for the standard PCM formalism. CAM-B3LYP with NE-PCM is also the best performance of all approaches tested here. At this level of theory, the correlation with experiment was slightly better assuming a charged carboxylate with counterion compared with the protonated carboxylate group. As CAM-B3LYP with the non-equilibrium PCM formalism and an unidentate counterion performed the best, we used this approach in the computational analysis that follows.
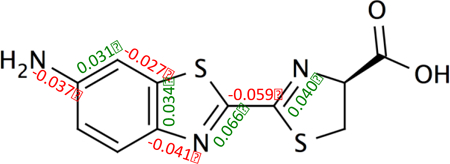
In Table S1-S3 we show the S0 and S1 equilibrium bond lengths and their differences, and in Figure 5 indicate the eight bond lengths that had the largest average S0 to S1 change. The bond length alternation is asymmetric in the benzothiazole. This supported by the HOMO and LUMO orbitals, with changes in nodes coinciding with the major changes in average bond lengths (shown for 1a in Figure S1).
Figure 5:
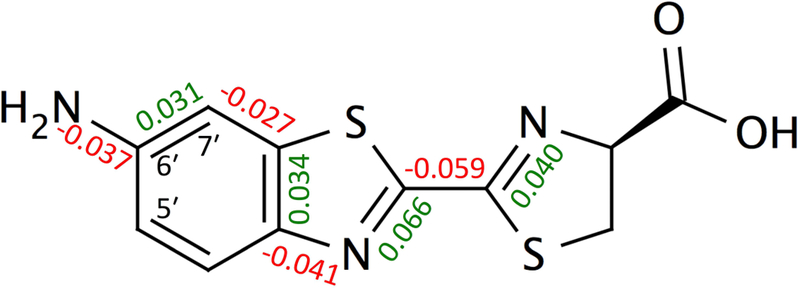
Bond lengths with the largest average difference between the S0 and S1 states (Å), and atom labels referred to in the text.
Next, we considered the effect of the modifications on the emission wavelengths. The effect of each modification is shown in Figure 6 using computational data, with experimental values in parentheses. The slope of each vector in Figure 6 represents the effect of the structural modification on the emission wavelength. Overall, we see that the computational shifts match the experimental shifts well, and from here on we report the computationally obtained values. We first consider the addition of the electron-donating methyl groups, which introduced red-shifts between 10 and 24 nm. Surprisingly, addition of the second methyl group to the amino group of 1a yielded a shift double that of the first methyl group: 21 nm vs. 10 nm. We speculate that this could be due to the specific orientation. Note that for 2b, 3b, and 4b, the methyl substituents are positioned cis with respect to the carboxylate group, and the shift (10–14 nm) resembles that of the first methyl addition (10 nm), whereas for 5b the methyl group is positioned trans with respect to the carboxylate group, and the shift (24 nm) resembles that of the addition of the second methyl to the amino group (21 nm). Indeed, our calculations suggest that the methyl orientation of 1b is preferentially positioned cis in the excited state, thus the second methyl group, introduced in 1c, is positioned in the same orientation as the methyl group of 5b. It is possible that hyperconjugation from the methyl group is more efficient when the conjugated system is extended linearly (as in 5b) than for a non-linear configuration (2b, 3b, and 4b).
Figure 6:
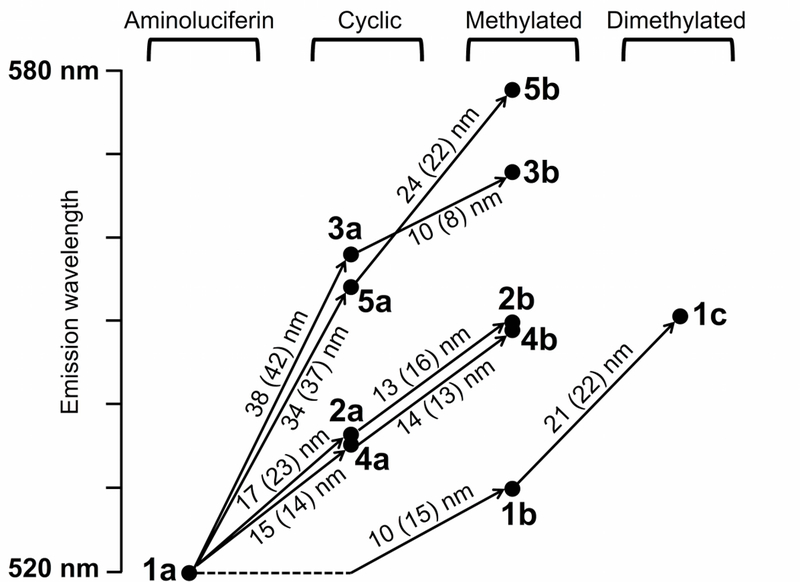
Predicted effects of luciferin modifications on emission wavelengths (nm), using the scaled best prediction. Equivalent experimental shifts are shown in parentheses.
The red-shifts from the cyclic extensions to the amino group 2a-5a can be explained in part by the alkyl substituents, similar to the methylated compounds 1b and 1c. Indeed, 2a and 1b are both monoalkylated and showed red-shifts, but with different magnitude due to the orientation of the substitution. Extending the conjugated system, as in 3a, introduced a further red-shift. The ether oxygen of 4a however, has an electron-π-donating effect, and the resulting emission wavelength was similar to 2a. The amino groups of the cyclic compounds 2a, 3a, and 4a can be methylated, yielding further red-shifts of 10–14 nm, similar to addition of the methyl to the amino group of 1a (10 nm). Finally, 5b showed the largest red-shift of all substrates tested. This is likely due to the combined effect of the orientation of the methyl group, and the attachment of the cyclic structure to the 7′ position of the benzothiazole. Larger differences between the ground and excited states are predicted at the 7′ position compared to the 5′ position where the other cyclic compounds are attached (Figures 2 and 5).
In Figure S2 we show the HOMO and LUMO orbital energies. As orbital energies are not available for the NE-PCM models, we used the best performing computational approach with standard PCM. The wavelength shifts are mostly due to changes in the HOMO orbital energies, with the LUMO orbital energies showing much less variation. This agrees with the density of the LUMO orbital shifted from the benzothiazole moiety with respect to the HOMO orbital.
Conclusions
Using a series of aminoluciferin analogues, we showed that TD-DFT with the non-equilibrium solvation formalism is able to accurately predict the relative magnitude of fluorescence wavelengths, with a correlation of r=0.98. The calculations provided further insight in the orientation of the flexible methyl orientation of 6′-MeNHLH2 (1b) and its effect on the emission wavelength. We showed that the excitation is asymmetric in the benzothiazole, which suggests that 5′ and 7′-substituents will differentially affect emission wavelengths (see Figure 5 for atom labels). We expect that our benchmarked computational approaches will aid the further spectral tuning of luciferin-derived compounds.
Methods
We used DFT for the ground states, and TD-DFT for the excited states.[26] We considered the B3LYP[27] and CAM-B3LYP[28] functionals. The 6–31+G(d) basis sets were used throughout. These approaches were shown successful in other studies on similar systems.[16,18,29–31]
The effect of the solvent (water) was included using the PCM approach.[32] We applied the standard linear response formalism,[33] as well as the state specific non-equilibrium formalism. The latter separates the slow and fast components of the reaction field, providing a more accurate description of the effect of the solvent on the transition energies.[34,35]
Emissions were calculated from excited state geometries optimized using TD-DFT.[36] The optimizations were performed using the same conditions (functional, basis sets, solvation, luciferin charge) as the corresponding emission calculations. We used all plausible conformations as starting points for the geometry optimizations, including various placements of the counterions. All calculations were carried out using the Gaussian 09 package.[37]
Supplementary Material
Acknowledgements
This work was supported by funding from the US National Institutes of Health (R01EB013270).
References
- [1].Fraga H, Photochem. Photobiol. Sci 2008, 7, 146. [DOI] [PubMed] [Google Scholar]
- [2].Fan F, Wood KV, Assay Drug Dev Technol 2007, 5, 127. [DOI] [PubMed] [Google Scholar]
- [3].Prescher JA, Contag CH, Curr Opin Chem Biol 2010, 14, 80. [DOI] [PubMed] [Google Scholar]
- [4].Takakura H, Sasakura K, Ueno T, Urano Y, Terai T, Hanaoka K, Tsuboi T, Nagano T, Chem Asian J 2010, 5, 2053. [DOI] [PubMed] [Google Scholar]
- [5].Steinhardt RC, Rathbun CM, Krull BT, Yu JM, Yang Y, Nguyen BD, Kwon J, McCutcheon DC, Jones KA, Furche F, Prescher JA, Chembiochem 2017, 18, 96. [DOI] [PMC free article] [PubMed] [Google Scholar]
- [6].Adams ST, Mofford DM, Reddy GSKK, Miller SC, Angew. Chem. Int. Ed. Engl 2016, 55, 4943. [DOI] [PMC free article] [PubMed] [Google Scholar]
- [7].Branchini BR, Southworth TL, Khattak NF, Michelini E, Roda A, Analytical Biochemistry 2005, 345, 140. [DOI] [PubMed] [Google Scholar]
- [8].Branchini BR, Ablamsky DM, Davis AL, Southworth TL, Butler B, Fan F, Jathoul AP, Pule MA, Analytical Biochemistry 2010, 396, 290. [DOI] [PubMed] [Google Scholar]
- [9].Iwano S, Obata R, Miura C, Kiyama M, Hama K, Nakamura M, Amano Y, Kojima S, Hirano T, Maki S, Niwa H, Tetrahedron 2013, 69, 3847. [Google Scholar]
- [10].Adams ST, Miller SC, Curr Opin Chem Biol 2014, 21, 112. [DOI] [PMC free article] [PubMed] [Google Scholar]
- [11].Sharma DK, Adams ST, Liebmann KL, Miller SC, Org. Lett 2017, 19, 5836. [DOI] [PMC free article] [PubMed] [Google Scholar]
- [12].Jathoul AP, Grounds H, Anderson JC, Pule MA, Angew. Chem. Int. Ed. Engl 2014, 53, 13059. [DOI] [PMC free article] [PubMed] [Google Scholar]
- [13].White EH, Wörther H, Seliger HH, McElroy WD, J Am Chem Soc 1966, 88, 2015. [Google Scholar]
- [14].Reddy GR, Thompson WC, Miller SC, J Am Chem Soc 2010, 132, 13586. [DOI] [PMC free article] [PubMed] [Google Scholar]
- [15].Mofford DM, Reddy GR, Miller SC, J Am Chem Soc 2014, 136, 13277. [DOI] [PMC free article] [PubMed] [Google Scholar]
- [16].Da Silva LP, Esteves Da Silva JCG, J Chem Theory Comput 2011, 7, 809. [DOI] [PubMed] [Google Scholar]
- [17].Ren A, Goddard J, Journal of Photochemistry and Photobiology B: Biology 2005, 81, 163. [DOI] [PubMed] [Google Scholar]
- [18].Chen S-F, Yue L, Liu Y-J, Lindh R, Int J Quantum Chem 2011, 111, 3371. [Google Scholar]
- [19].Ran XQ, Zhou X, Goddard JD, ChemPhysChem 2015, 16, 396. [DOI] [PubMed] [Google Scholar]
- [20].García-Iriepa C, Gosset P, Berraud-Pache R, Zemmouche M, Taupier G, Dorkenoo KD, Didier P, Léonard J, Ferre N, Navizet I, J Chem Theory Comput 2018, 14, 2117. [DOI] [PubMed] [Google Scholar]
- [21].Li Z-S, Min C-G, Ren A-M, Zou L-Y, Xu Z, J Photoch Photobio A 2012, 243, 7. [Google Scholar]
- [22].Kakiuchi M, Ito S, Yamaji M, Viviani VR, Maki S, Hirano T, Photochem. Photobiol 2016, 93, 486. [DOI] [PubMed] [Google Scholar]
- [23].Hirano T, Hasumi Y, Ohtsuka K, Maki S, Niwa H, Yamaji M, Hashizume D, J Am Chem Soc 2009, 131, 2385. [DOI] [PubMed] [Google Scholar]
- [24].Laurent AD, Jacquemin D, Int J Quantum Chem 2013, 113, 2019. [Google Scholar]
- [25].Viviani VR, Cell. Mol. Life Sci 2002, 59, 1833. [DOI] [PMC free article] [PubMed] [Google Scholar]
- [26].Adamo C, Jacquemin D, Chemical Society Reviews 2013, 42, 845. [DOI] [PubMed] [Google Scholar]
- [27].Stephens PJ, Devlin FJ, Chabalowski CF, Frisch MJ, J. Phys. Chem 1994, 98, 11623. [Google Scholar]
- [28].Yanai T, Tew DP, Handy NC, Chem Phys Lett 2004, 393, 51. [Google Scholar]
- [29].Yu M, Ohmiya Y, Naumov P, Liu Y-J, Photochem. Photobiol 2017, 540. [DOI] [PubMed]
- [30].Milne BF, Physical Chemistry Chemical Physics 2014, 16, 24971. [DOI] [PubMed] [Google Scholar]
- [31].Cheshmedzhieva D, Ivanova P, Stoyanov S, Tasheva D, Dimitrova M, Ivanov I, Ilieva S, Physical Chemistry Chemical Physics 2011, 13, 18530. [DOI] [PubMed] [Google Scholar]
- [32].Mennucci B, Cancès E, Tomasi J, J Phys Chem B 1997, 101, 10506. [Google Scholar]
- [33].Cossi M, Barone V, J Chem Phys 2001, 115, 4708. [Google Scholar]
- [34].Improta R, Barone V, Scalmani G, Frisch MJ, J Chem Phys 2006, 125, 054103. [DOI] [PubMed] [Google Scholar]
- [35].Improta R, Scalmani G, Frisch MJ, Barone V, J Chem Phys 2007, 127, 074504. [DOI] [PubMed] [Google Scholar]
- [36].Scalmani G, Frisch MJ, Mennucci B, Tomasi J, Cammi R, Barone V, J Chem Phys 2006, 124, 94107. [DOI] [PubMed] [Google Scholar]
- [37].Frisch MJ, Trucks GW, Schlegel BH, Scuseria GE, Robb MA, Cheeseman JR, Scalmani G, Barone V, Mennucci B, Petersson GA, Nakatsjuji H, Caricato M, Li X, Hratchian HP, Izmaylov AF, Bloino J, Zheng G, Sonnenberg JL, Hada M, Ehara M, Toyota K, Fukuda R, Hasawaga J, Ishida M, Nakajima T, Honda Y, Kitao O, Hakai H, Vreven T, Montgomery JA, Peralta JE, Ogliaro F, Bearpark MJ, Heyd JJ, Brothers E, Kudin K, Staroverov VN, Kobayashi R, Normand J, Raghavachari K, Rendell A, Burant JC, Iyengar S, Tomasi J, Cossi M, Rega N, Millam JM, Klene M, Knox JE, Cross JB, Bakken V, Adamo C, Jaramillo J, Gomperts R, Stratmann RE, Yazyev O, Austin AJ, Cammi R, Pomelli C, Ochterski JW, Martin RL, Morokuma K, Zakrzewski VG, Voth G, Salvador P, Dannenberg JJ, Dapprich S, Daniels AD, Farkas O, Foresman JB, Ortiz JV, Ciolowski J, Fox FJ, Gaussian 09 Revision A.02 Wallingford, CT: 2009. [Google Scholar]
Associated Data
This section collects any data citations, data availability statements, or supplementary materials included in this article.