Abstract
Objective
The objective of this study is to evaluate the role of diffusion-weighted imaging (DWI) in assessment of the activity of Crohn disease (CD) and to explore differences between DWI in 3 T and 1.5 T.
Methods
Postcontrast magnetic resonance enterography with DWI of 72 patients with pathological proof of CD was retrospectively evaluated for restricted diffusion qualitatively and quantitavely in 3 T (n = 40) and 1.5 T (n = 32). Magnetic resonance activity score of 7 or higher was used as reference of activity.
Results
Fifty-five patients had active lesions. Diffusion-weighted imaging hyperintensity showed sensitivity (100%, 100%) and specificity (88.89%, 100%) in 1.5/3 T for activity assessment. Mean ± SD apparent diffusion coefficient for active lesions was 1.21 ± 0.42 and 1.28 ± 0.59 × 10⁻³ mm2/s in 1.5 and 3 T, respectively. The proposed cutoff values of 1.35 and 1.38 × 10⁻³ mm2/s in 1.5 and 3 T, respectively, had sensitivity (80%, 93%), specificity (100%, 90%), accuracy (88%, 93%), and no significant difference in accuracy between 1.5/3 T (P = 0.48).
Conclusions
Diffusion-weighted imaging hypersensitivity and apparent diffusion coefficient values accurately assessed the activity of CD. No significant statistical difference in diagnostic accuracy was detected between 1.5 and 3 T.
Key Words: Crohn disease, diffusion hypersensitivity, ADC, disease activity
Crohn disease (CD) is a chronic relapsing and destructive disorder that can affect the entire digestive tract.1 Although colonoscopy is considered the criterion standard diagnostic tool to assess colonic disease activity,2 as it allows direct visualization of mucosa and biopsy taking,3,4 it is not suitable for assessment of small bowel disease. On the other hand, capsule endoscopy can assess severity of small bowel inflammation in CD,5 but because of its small field of view, it cannot assess the length of inflamed segment reliably; another limitation is that it cannot assess strictures. Hence emerges the role of cross-sectional imaging as magnetic resonance enterography (MRE) and computed tomography enterography, which offers better assessment of the small bowel involvement6 including transmural inflammation and strictures as well as complicating fistulae.7–9
Recently, the treatment target of the disease has changed from treating symptoms to achieve mucosal healing, which is associated with higher rates of clinical remissions, less surgical interference, and less hospitalization duration.6,10 In other words, this means that clinicians are now targeting to discover subclinical flare in patients with little or no symptoms, which necessitates repeated diagnostic tests to detect early relapse.11 Cross sectional-imaging could serve as an alternative or an adjunct to ileocolonoscopy in evaluation of mucosal healing.12,13 This makes MRE more preferable than computed tomography in follow-up of these patients to avoid the hazards of ionizing radiation. Repeated computed tomography enterography examinations over time taking in consideration the young age of CD population may entail increased risk of malignancy.14
Several studies have reported good correlation between disease activity and different scores derived from MRE features including mural thickness, wall edema, ulcers, and contrast enhancement.15 Unfortunately, recently, the issue of gadolinium deposition in the globus palidus and dentate nucleus of the brain after repeated injections was raised.16 Although the clinical significance of gadolinium deposition is still unclear,16 the need for noncontrast MRE technique to assess disease activity is warranted.
Diffusion-weighted imaging (DWI) is an imaging technique that relies on the differences in the motion of water molecules between tissues. It has been established as an important tool in the detection of early ischemic changes in clinical settings.17 Diffusion-weighted imaging is also capable of detection of inflammatory lesions.18 Several studies stated the promising role DWI in diagnosis and assessment of the activity of CD in comparison with colonoscopy and MRE.11,19–32 Furthermore, DWI has been included in the routine MRE examination in many institutions including ours, but till now, there is still debate about which is better to do MRE with DWI using 1.5 or 3 T units. To our knowledge, few reports8,33 had compared 1.5 T and 3 T MRE as regard assessment of disease activity but no studies had compared the DWI and apparent diffusion coefficient (ADC) values derived from 1.T and 3 T.
The aim of this study is (1) to evaluate the role of DWI in assessment of the activity of CD and (2) explore the difference between DWI in 3 T and 1.5 T.
MATERIALS AND METHODS
This study was carried on after approval from the local ethical committee of Dar Al-Shifa Hospital, and the need for informed consent was waived owing to the retrospective nature of the study. However, informed consents for magnetic resonance imaging (MRI) contrast intake were available for all patients.
Study Population
During the period from April 2014 to April 2017, 72 patients were enrolled in this retrospective study. Inclusion criteria were as follows: (a) patients who had previous histopathological proof of CD from small intestine or the colon and who had clinical suspicion of active disease or came for follow-up after medical treatment and (b) patients who had MRE with DWI.
Exclusion criteria were as follows: (a) incomplete patients' files, (b) patients who did not take gadolinium owing to severe renal failure (creatinine clearance, <30 mL/min), (c) patients who had surgical treatment for CD, and (d) patients who are under the age of 18 years.
Imaging
Magnetic resonance enterography was performed using 1.5 T (Magnetom Aera Siemens) and 3 T (Magnetom Skyra Siemens) systems as per usual clinical practice.
Patient Preparation
Patients are instructed to be fasting at least 4 hours before examination. No bowel cleansing was done.
Patients received oral contrast (1200 mL of 2.5% mannitol solution) over 60 minutes to distend the small bowel before MRI examination.
No intravenous spasmolytic agent or water rectal enema was given.
Image Acquisition
Patients were placed prone in the magnet, and a large field of view (FOV) phased-array body coil was used.
First, a half fourier acquired single shot turbo spin echo localizer was acquired, followed by breath hold axial/coronal T2 half fourier acquired single shot turbo spin echo (FOV, 350/480 mm; number of slices, 40/35; slice thickness, 5/4; repetition time, 1300/1200 ms; echo time, 91/92 ms; image matrix, 320; average, 1; flip angle, 180/176 degrees), True FISP fat sat axial and coronal (FOV, 350/480 mm; number of slices, 50/65; slice thickness, 3; repetition time, 4.4 ms; echo time, 2.3 ms; image matrix, 256; average, 1; flip angle, 60 degrees), and T1 VIBE Dixon FLASH fat sat axial and coronal (FOV, 350/480 mm; number of slices, 40/35; slice thickness, 3; repetition time, 6.68 ms; echo time 1, 2.39 ms; echo time 2, 4.77 ms; image matrix, 320/352; average, 1; flip angle, 10 degrees).
Diffusion-weighted imaging sequences were acquired before contrast injection. Free breathing axial diffusion MRI was performed using an echo-planar imaging sequence, and spectrally adiabatic inversion recovery was applied for fat suppression (FOV, 380 mm; number of slices, 30; slice thickness, 6 mm; repetition time, 3200 ms; echo time, 53 ms; concatenations, 2; base resolution, 134; phase resolution, 100%). Four b values (0, 50, 400, and 800) were obtained in 3 T and 1.5 T.
Finally, postcontrast T1 VIBE Dixon axial and coronal 45 and 70 seconds after injection of 0.1 mmol/kg of Dotarem (gadoterate meglumine, Guerbet LLC) at flow rate of 3 mm/s was acquired using automatic injector.
The acquisition time of the entire examination for each patient was approximately 30 minutes.
Image Analysis
Image analysis was performed by 2 experienced radiologists (8 and 5 years of experience) who were unaware to clinical symptoms, laboratory results, or results of colonoscopy. Analysis was done using a dedicated postprocessing software (Carestream Pacs). For any discrepancies in the data analysis between the 2 radiologists, a joint reading session was performed to obtain consensus.
The small bowel was divided into jejunum, proximal ileum, distal ileum, and terminal ileum (defined as 20 cm of the distal end of the ileum nearest to the ileocecal valve). The colon was divided into 6 segments: cecum, ascending colon, transverse colon, descending colon, sigmoid colon, and rectum.
For all evaluations, a standardized data sheet was used to record inflammatory changes in each bowel segment that included the following characters: (a) wall thickness (>3 mm in small bowel and >6 mm in the colon, (b) mucosal ulcers (defined as deep depressions in the mucosal surface of the thickened loop), (c) presence of mural edema (high signal intensity on T2-weighted sequences of the bowel wall relative to the signal of the nearby psoas muscle), (d) enlarged regional mesenteric lymph nodes, (e) presence of fistula or abscess, and (f) relative contrast enhancement (RCE); wall signal intensity was calculated at same segment before and after contrast enhancement, and then RCE was calculated using the formula: RCE = [(wall signal intensity [WSI] postgadolinium − WSI pregadolinium)/(WSI pregadolinium)] × 100 × (SD noise pregadolinium/SD noise postgadolinium).15,34
Then, the segment with the most severe lesions was used to calculate the magnetic resonance index of activity (MaRIA) score (=1.5 × wall thickening [mm] + 0.02 × RCE [enhancement] +5 × edema + 10 × ulcers),15,34 and modified modified magnetic resonance index of activity (mMaRIA) score was calculated excluding the data of RCE.
Clermont score was calculated using the following formula: Clermont = −1.32 × ADC (10–3 mm2/s) + 1.646 × wall thickness (mm) + 8.306 × ulcers + 5.613 × edema + 5.039.32
Diffusion-weighted images and ADC maps were assessed separately in sessions held 2 weeks apart from the assessment of MRE images. Radiologists were blind to clinical and MRE findings. Restricted diffusion was defined as a high signal intensity in DWI in 800 b value images combined with low signal intensity and low values in ADC images.
Graded qualitative assessment of small and large bowel diffusion-weighted images was done by both readers in consensus using the method described by Oto et al19 as follows; 0, definitely absent (imperceptible wall, both in signal and in thickness); 1, probably absent (normal thickness, signal intensity and thickness are similar to the surrounding bowel segments); 2, probably present (normal wall thickness, but signal intensity is bright on DWI and dark on ADC map); and 3, definitely present (bowel wall thickness >3 mm, and bright signal intensity on DWI and dark on ADC map). Scores of 0 and 1 were considered as indicating normal bowel wall, and scores of 2 and 3 were considered as indicating bowel wall inflammation on DWI.
Quantitative analysis used measurement of ADC in the axial plane by a region of interest placed on the area displaying the most restricted diffusion and showing the maximum mural thickening. The mean of the 2 ADC values was accepted as the ADC value of the segment.
Laboratory Test
Complete blood picture and leukocytic count as well as C-reactive protein and serum creatinine levels were obtained for patients older than 60 years, diabetics, and those with a history of organ transplant.
Statistical Analysis
Quantitative variables are given as means and SD or as medians in the case of an abnormal distribution. Proportions are expressed as percentages and 95% confident intervals (CIs).
Differences in quantitative measures were tested by Student test. Qualitative variables were compared using χ2 test. A P value of 0.05 was considered significant. A threshold was determined by calculating receiver operating characteristic (ROC) curves. The sensitivity, specificity, accuracy, positive predictive value, and negative predictive value of graded qualitative DWI (considering grades 2 and 3 active disease) using MaRIA as reference (active disease ≥7).
The mean of the ADC values estimated by 2 readers was used in subsequent analysis. Comparison of diagnostic accuracy was performed using χ2 comparison.
The correlations between MaRIA, mMaRIA score, and ADC values obtained at 3 T and 1.5 T were calculated by Pearson rank correlation test. A MaRIA score of 7 or greater was considered as indicator of active disease. The correlation between ADC values and other parametric variables was calculated using Pearson rank correlation test. Spearman correlation test is used when correlation is calculated with nonparametric variables. Correlation r values <0.3 were considered as weak to low correlation, 0.3 to 0.49 as low to moderate correlation, 0.5 to 0.69 as moderate correlation, and ≥0.7 as strong correlation. An area under the curve of 0.6 to 0.7 was considered poor, and 0.9 to 1 as excellent.
Analysis was performed using SPSS software version 20 (SPSS Inc, Chicago).
RESULTS
Patient Population
This study included 72 cases, in which 40 were males, the mean ± SD age was 30.9 ± 7.8 years, and 40 patients were scanned in 3 T and 32 in 1.5 T. The examination was well tolerated by all patients.
MRE Findings
Magnetic resonance enterography examination was considered adequate for diagnosis in all patients by the 2 radiologists with good bowel distension. High image quality was reported in all MRE examinations; none of the radiologists considered the images as of poor quality.
There was no difference in the choice of the segment that showed severe involvement in each patient among the 2 observers. Active lesions were reported in 55 patients (76%) defined as a MaRIA score of 7 or higher.
Disease location was terminal ileum in 20 patients (36.4%), distal ileum in 14 patients, proximal ileum in 4 patients, jejunum in 1 patient, cecum in 1 patient, descending colon in 7 patients, sigmoid in 5 patients, and rectum in 3 patients. No lesion was found in 17 patients (23.6%).
There was no difference in determination of most affected site between the 2 radiologists. Mural edema was detected in 55 patients, ulcers were detected in 40 patients, abscess in 5 cases, fistula in 10 cases, stricture in 4 patients, mesenteric lymph nodes in 48 patients, and ascites in 5 patients. Magnetic resonance enterography findings are listed in Table 1, and examples are given in Figure 1 and Figure 2.
TABLE 1.
MRE Findings and Characteristics
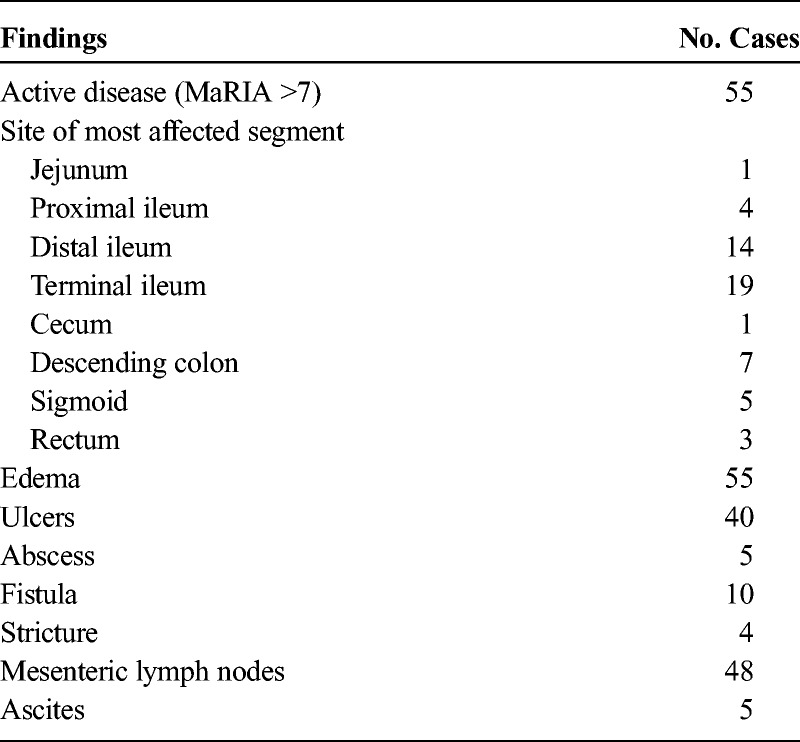
FIGURE 1.
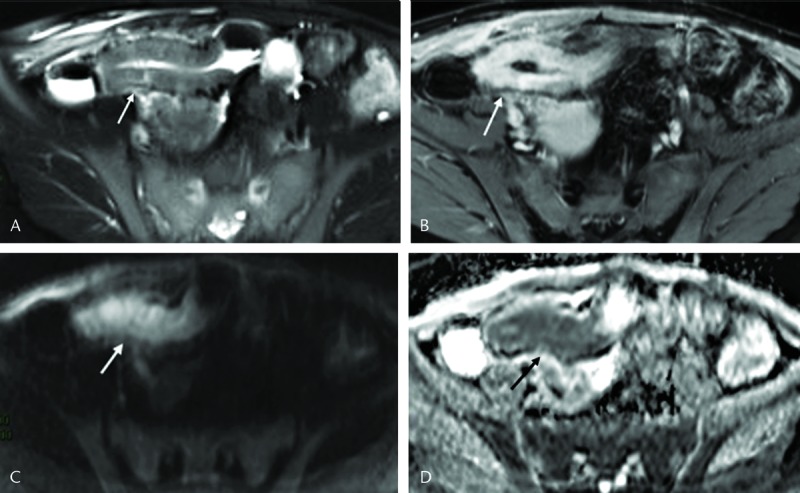
A 19-year-old female with active CD of terminal ileum. A, The axial T2- and (B) contrast-enhanced T1-weighted images show marked mural T2 hyperintensity and contrast enhancement with thickened bowel wall in the terminal ileum (white arrows). Grade 3 hyperintensity on the axial diffusion-weighted MRI with b = 800 s/mm2 (white arrow in C) and hypointensity on corresponding ADCs map (black arrow in D). The mean ADC in the inflamed bowel wall to be 0.66 × 10⁻³ mm2/s.
FIGURE 2.
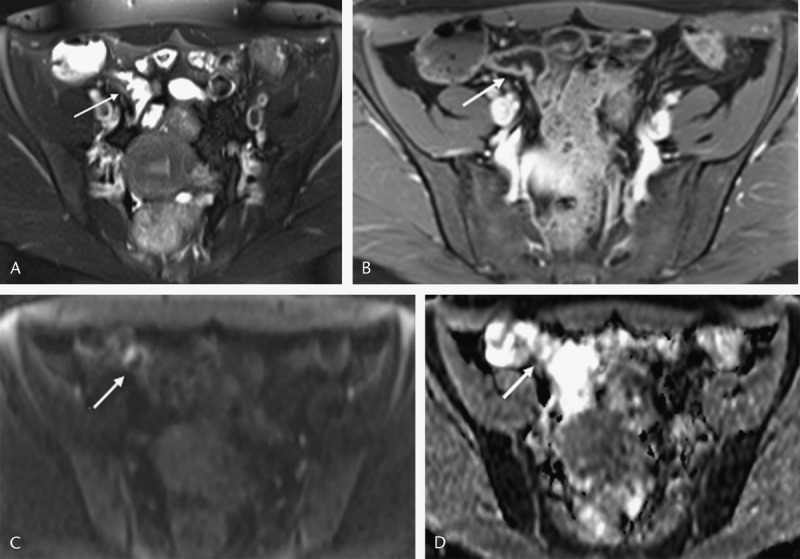
A 31-year-old female with inactive CD. A, The axial T2- and (B) contrast-enhanced T1-weighted images showed mural thickness of terminal ileum (3 mm). Grade 2 hyperintensity on the axial diffusion-weighted MRI with b = 800 s/mm2 (white arrow in C), yet no significant hypointensity on corresponding ADCs map (white arrow in D). The mean ADC in the inflamed bowel wall to be 1.8 × 10⁻³ mm2/s.
There was no significant difference between mean MaRIA and mMaRIA estimated from MRE performed at 1.5 T and 3 T (P = 0.87 and 0.67, respectively).
Diffusion-Weighted Images Hypersensitivity (Qualitative Criteria)
As regard diffusion hypersensitivity, all cases with inactive disease showed grade 1 hypersensitivity in 3 T magnetic resonance (MR) images, whereas only 1 case with inactive disease showed grade 2 hypersensitivity in 1.5, and the rest of the cases showed grade 1. All cases with active disease (defined as MaRIA score ≥7) showed either grade 2 or 3 hypersensitivity in 3 T and 1.5 T images.
There was significant strong correlation between graded DWI hypersensitivity and MaRIA (r = 0.74, P = 0.00) in 1.5 MR and (r = 0.8, P = 0.00) in 3 T MR. There was also strong correlation with mMaRIA (r = 0.77, P = 0.00) at 1.5 T and moderate correlation mMaRIA (r = 0.66, P = 0.00) at 3 T.
Diffusion-weighted imaging hyperintensity had sensitivity of 100% (CI, 85.2–100) and 100% (CI, 88.4–100), specificity of 88.89% (CI, 51.8–99.7) and 100% (CI, 69.2–100), negative predictive value of 95%.8 (CI, 78.4–99.3) and 100% positive predictive value of 100% and 100% in detecting active disease in 1.5 T and 3 T respectively. Area under the ROC curve was 0.99 and 1 in 1.5 T and 3 T, respectively (Figs. 3, 4).
FIGURE 3.
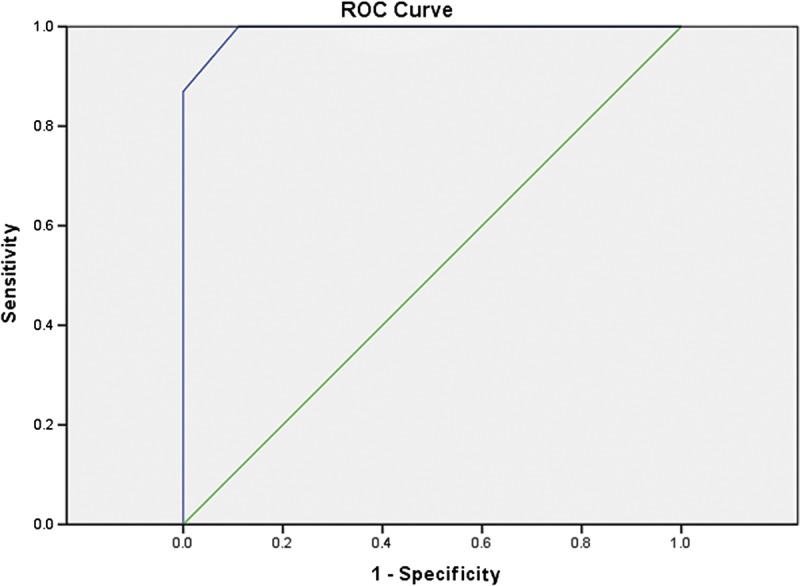
Receiver operating characteristics curve of DWI hyperintensity in 1.5 T; area under the ROC curve, 0.99. Figure 3 can be viewed online in color at www.jcat.org.
FIGURE 4.
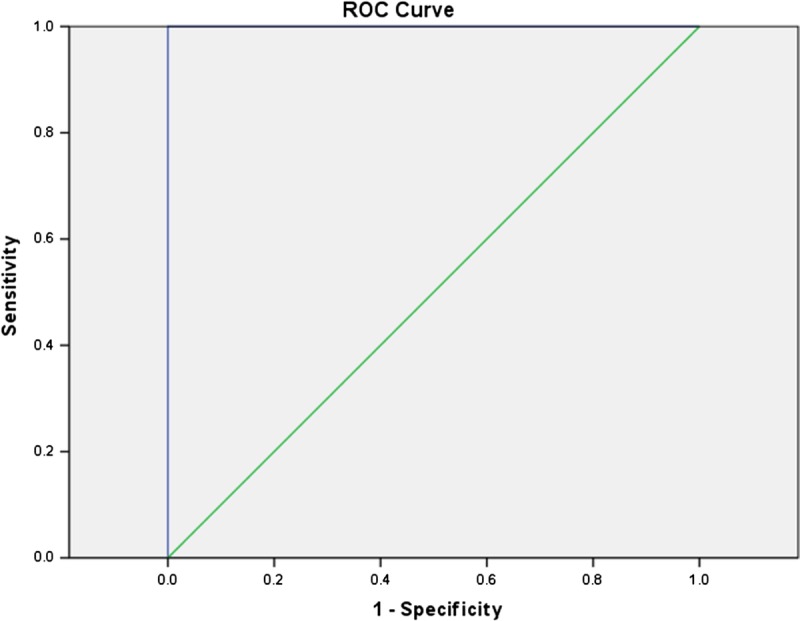
Receiver operating characteristics curve of DWI hyperintensity in 3 T; area under the ROC curve, 1. Figure 4 can be viewed online in color at www.jcat.org.
ADC Values (Quantitative Criteria)
The mean ± SD ADC for active lesions in 1.5 T was 1.21 ± 0.42 × 10⁻³ mm2/s in 1.5 T and 1.28 ± 0.59 × 10⁻³ mm2/s at 3 T. There was significant difference between ADC of active and nonactive lesions derived from 1.5 and 3 T units (P = 0.000), whereas there was no significant difference in mean ADC values of active lesions (MaRIA >7) between 1.5 T and 3 T (P = 0.067)
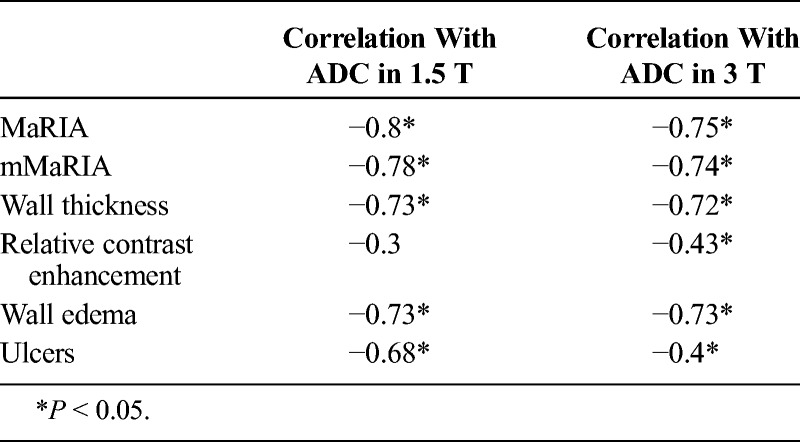
There was significant strong inverse correlation between (ADC values) and MaRIA, mMaRIA, wall thickness, and wall edema at 1.5 T (r = −0.8, P = 0.00; r = −0.78, P = 0.00; r = 0.73, P = 0.00; r = −0.73, P = 0.00) and 3 T units (r = −0.75, P = 0.00; r = −0.74, P = 0.00; r = −0.72, P = 0.00; r = −0.73, P = 0.00).
There was moderate inverse correlation between ulcers and ADC values at 1.5 (r = −0.68, P = 0.00) and low to moderate inverse correlation between ulcers and ADC values at 3 T (r = −0.4, P = 0.01).
There was low to moderate inverse correlation between ADC values and RCE in 3 T (r = −0.43 P = 0.005), whereas there was no significant correlation in 1.5 MR (r = −0.3 P = 0.085) (as illustrated in Table 2).
TABLE 2.
Correlation Coefficients Between ADC Values and MaRIA, mMaRIA, Wall Thickness, Relative Contrast Enhancement, and Edema
There was significant strong correlation between MaRIA and Clermont score at 1.5 T (r = 0.95, P = 0.00) and (r = 0.99, P = 0.00).
Area under the ROC curve was 0.97 (95% CI, 0.93–1) and 0.98 (95% CI, 0.95–1.00) as shown in Figure 5 and Figure 6. Using ROC curve, we determined a threshold of 1.35 and 1.38 × 10⁻³ mm2/s in 1.5 and 3 T, respectively, for discrimination between active and nonactive disease, with sensitivity of 80% and 93%, specificity of 100% and 90%, accuracy of 88% and 93% in 1.5 and 3 T, respectively. There was no significant difference between the accuracy of estimated cutoff value between 1.5 and 3 T units (χ2 = 0.51, P = 0.48).
FIGURE 5.
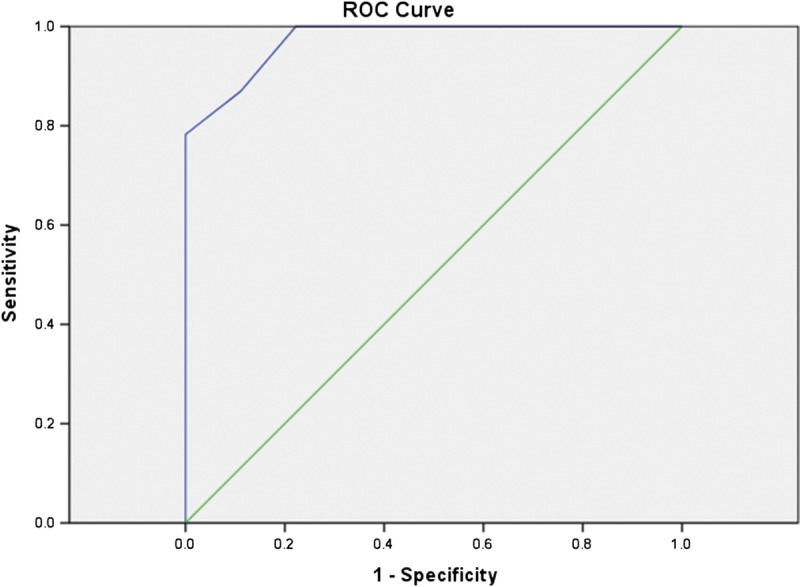
Receiver operating characteristics curve of mean ADC in 1.5 T; area under the ROC curve, 0.97. Figure 5 can be viewed online in color at www.jcat.org.
FIGURE 6.
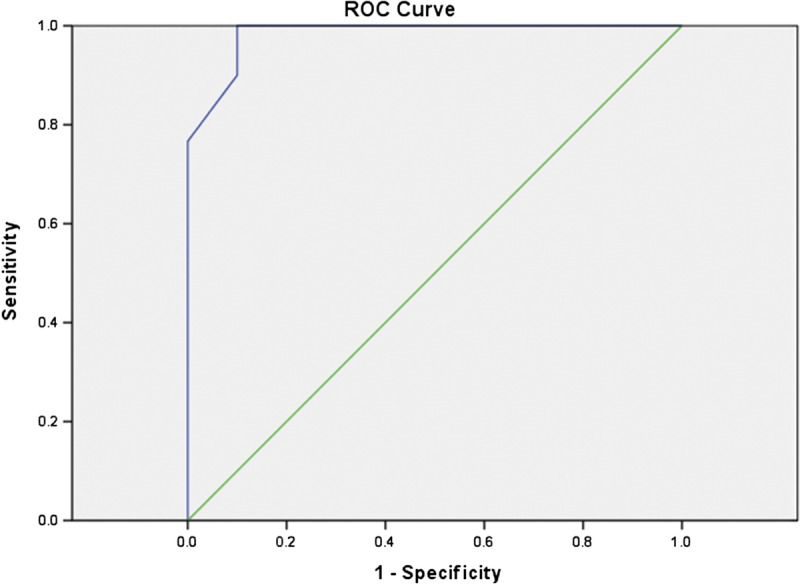
Receiver operating characteristics curve of mean ADC in 3 T; area under the ROC curve, 0.98. Figure 6 can be viewed online in color at www.jcat.org.
DISCUSSION
The ideal imaging modality for assessment and monitoring of a remitting relapsing disease such as CD should be reproducible, free of ionizing radiation, and well tolerated.35 It should also have the ability to assess the whole intestinal tract and evaluate extraluminal complications as well. Magnetic resonance enterography and its derived MaRIA score showed good correlation between MaRIA and indices of activity in capsule endoscopy and ileocolonoscopy,6,13,36–38 and it was considered as a promising alternative to ileocolonoscopy.38 The only drawback of MaRIA is that it necessitates contrast injection. Although there are studies confirming the high sensitivity and specificity of modified MaRIA37 (which excludes contrast enhancement from original MaRIA score), the need for contrast-free diagnostic tool is still highlighted.
Diffusion-weighted imaging and ADC values offer an additional diagnostic value to conventional MRE without need for contrast injection, as restricted diffusion has been linked to inflammatory process. Diffusion restriction is attributed to reduced extracellular space caused by increased cell density and viscosity, granuloma formation, and dilated lymphatic channels.39
In the current study, we relied on MaRIA score as standard reference of disease activity.
As for DWI, we used 4 b values (0, 50, 400, and 800) to get more accurate quantitative ADC values. One study compared 4 b values and concluded that b value of 800 s/mm2 had the best signal-to-noise ratio and contrast-to-noise ratio as well highest sensitivity to detect disease activity.20,40,41
Active CD was detected in 55 patients, we observed that DWI hyperintensity was strongly correlated with the MaRIA and mMaRIA scores retrieved from conventional MRI sequences performed at 1.5 T, whereas it was strongly correlated to MaRIA and moderately correlated to mMaRIA obtained from conventional MRI sequences performed at 3 T. All cases with active disease showed high signal intensity in DWI (grades 2 and 3), with high sensitivity and specificity in both 1.5 and 3 T field strengths. These results are consistent with the findings of Li et al41 who compared graded DWI with CD activity index).
In the current study, a strong negative correlation was detected between MaRIA, mMaRIA, and ADC values derived from 1.5 and 3 T field strengths. We found significant difference between ADC values derived form 1.5/3 T field strengths and active versus nonactive lesions, whereas the was no significant difference between mean ADC values of active lesions between the 2 MR field strengths. The mean ± SD ADC for active lesions in 1.5 T was 1.21 ± 0.42 × 10⁻³ mm2/s in 1.5 T and 1.28 ± 0.59 × 10⁻³ mm2/s at 3 T. These results are similar to Li et al41 and Neubauer et al42 who reported mean ADCs of 1.28 ± 0.47 × 10⁻³ mm2/s and 1.2 × 10⁻³ mm2/s in inflamed bowel wall. On the contrary, other 3 studies19,39,43 reported higher mean value of 1.98, 1.59 , and 1.48 × 10⁻³, respectively. This could be explained by differences in samples and scan parameters including b value, as the former 2 studies used 3 sets of b value (50, 400, and 800 s/mm2) whereas the latter 3 studies used 2 sets of b value (0 and 600 s/mm2).
We determined a threshold (ADC, 1.35 and 1.38 × 10⁻³ mm2/s in 1.5 T and 3 T units, respectively), which can accurately separate active from nonactive CD (88% and 93%, respectively). There was no significant difference between the accuracy of the estimated cutoff values between 3 T and 1.5 T. However, on comparing these cutoff values with other studies, Buisson et al32 and Hordonneau et al11 used MaRIA as reference of activity and reported a mildly higher cutoff value of 1.6 × 10⁻³ mm2/s, whereas Li et al41 who used CD activity index as reference of activity reported a mildly lower cutoff value of 1.17 × 10⁻³ mm2/s. On the other hand, a recent study based on endoscopic evaluation reported a much higher cutoff value between active CD and normal-appearing intestinal loops of 2.416 × 10⁻³ mm2/s with 100% sensitivity and 100% specificity.42 Intestinal loops with inactive CD could contain an element of fibro-fatty infiltration as a consequence of healing process with subsequent lower ADC values as compared with normal-appearing intestinal loops. Thus, the cutoff value between normal-appearing intestinal loops in an active disease will be higher than the cutoff value between active and inactive disease. Rimola et al38 faced a similar situation and noticed variability between predefined ADC cutoff and the calculated values from their cohort. Their explanation was that ADC measurements are highly dependent technical parameters and is an equipment dependent metric value. In fact, they reported this variability as a drawback that hinders widespread use of ADC cutoff values in research and clinical practice.38
Regarding individual components of MaRIA, we found significant correlation between ADC values obtained from 1.5 and 3 T units and wall thickness, mural edema, and ulcers, being highest with mural thickening and edema. However, there was low to moderate inverse correlation between ADC values and RCE in 3 T, whereas there was no significant correlation in 1.5 MR. In contrast to Fiorino et al,33 a significant correlation between ADC values and all components of MaRIA was reported.
More recently, Clermont score was developed to assess the activity of CD; it uses ADC values instead of contrast enhancement.11,44 We observed significant strong correlation between MaRIA and Clermont scores at 1.5 and 3 T field strengths. Hordonneau et al11 reported similar strong correlation regarding ileal lesions caused by CD.
Other researchers concluded that restricted diffusion and low ADC values are strong diagnostic tools of CD activity in quiescent patients, especially if associated with elevated fecal calprotectin.45 Unfortunately, because of the retrospective nature of the current study, such association could not be proved.
This study has certain limitations. We choose to compare DWI and ADC findings with MaRIA score derived from conventional MRE unlike most other studies that used endoscopic findings as criterion standard reference. We are aware that this choice is debatable, and it could lead to overestimation of accuracy as mentioned by Choi et al,31 but we aimed to evaluate DWI and ADC along the small and large intestinal loops from jejunum to rectum, so MRE appeared to the more applicable examination for comparison. Other reason for this choice include that it would be more accurate to compare 2 segments by 2 cross-imaging modalities done in the same time than comparing imagery with endoscopic results. Another limitation is that, instead of evaluating all intestinal segments, we choose to evaluate the most affected segment. Because of the nature of the CD, it is common to find several with different stages of activity at the same time, but the medical decision would be influenced by the most acute and severely inflamed segment. That is why we made that choice. Although we had examined lesions from all segments of the small and large intestinal loops, the number of affected segments in each subgroup was not enough to allow statistical comparison between these subgroups, and thus, large multicenter studies are recommended in the future.
In conclusion, DWI hypersensitivity and ADC values accurately assessed the activity of CD. No significant statistical difference in diagnostic accuracy was detected between 1.5 and 3 T.
Footnotes
The authors declare no conflict of interests.
REFERENCES
- 1.Peyrin-Biroulet L, Loftus EV, Jr, Colombel JF, et al. The natural history of adult Crohn's disease in population-based cohorts. Am J Gastroenterol. 2010;105:289–297. [DOI] [PubMed] [Google Scholar]
- 2.Dignass A, Van Assche G, Lindsay JO, et al. The second European evidence-based Consensus on the diagnosis and management of Crohn's disease: current management. J Crohns Colitis. 2010;4:28–62. [DOI] [PubMed] [Google Scholar]
- 3.Sandborn WJ, Feagan BG, Hanauer SB, et al. A review of activity indices and efficacy endpoints for clinical trials of medical therapy in adults with Crohn's disease. Gastroenterology. 2002;122:512–530. [DOI] [PubMed] [Google Scholar]
- 4.Daperno M, D'Haens G, Van Assche G, et al. Development and validation of a new, simplified endoscopic activity score for Crohn's disease: the SES-CD. Gastrointest Endosc. 2004;60:505–512. [DOI] [PubMed] [Google Scholar]
- 5.Bourreille A, Ignjatovic A, Aabakken L, et al. Role of small-bowel endoscopy in the management of patients with inflammatory bowel disease: an international OMED-ECCO consensus. Endoscopy. 2009;41:618–637. [DOI] [PubMed] [Google Scholar]
- 6.Kopylov U, Yablecovitch D, Lahat A, et al. Detection of small bowel mucosal healing and deep remission in patients with known small bowel Crohn's disease using biomarkers, capsule endoscopy, and imaging. Am J Gastroenterol. 2015;110:1316–1323. [DOI] [PubMed] [Google Scholar]
- 7.Panés J, Bouzas R, Chaparro M, et al. Systematic review: the use of ultrasonography, computed tomography and magnetic resonance imaging for the diagnosis, assessment of activity and abdominal complications of Crohn's disease. Aliment Pharmacol Ther. 2011;34:125–145. [DOI] [PubMed] [Google Scholar]
- 8.Jiang X, Asbach P, Hamm B, et al. MR imaging of distal ileal and colorectal chronic inflammatory bowel disease—diagnostic accuracy of 1.5 T and 3 T MRI compared to colonoscopy. Int J Colorectal Dis. 2014;29:1541–1550. [DOI] [PubMed] [Google Scholar]
- 9.Gomollón F, Dignass A, Annese V, et al. 3rd European Evidence-based Consensus on the Diagnosis and Management of Crohn's Disease 2016: part 1: diagnosis and medical management. J Crohns Colitis. 2017;11:3–25. [DOI] [PubMed] [Google Scholar]
- 10.Kakkar A, Wasan SK, Farraye FA. Targeting mucosal healing in Crohn's disease. Gastroenterol Hepatol (N Y). 2011;7:374–380. [PMC free article] [PubMed] [Google Scholar]
- 11.Hordonneau C, Buisson A, Scanzi J, et al. Diffusion-weighted magnetic resonance imaging in ileocolonic Crohn's disease: validation of quantitative index of activity. Am J Gastroenterol. 2014;109:89–98. [DOI] [PubMed] [Google Scholar]
- 12.Stoppino LP, Della Valle N, Rizzi S, et al. Magnetic resonance enterography changes after antibody to tumor necrosis factor (anti-TNF) alpha therapy in Crohn's disease: correlation with SES-CD and clinical-biological markers. BMC Med Imaging. 2016;16:37. [DOI] [PMC free article] [PubMed] [Google Scholar]
- 13.Panes J, Jairath V, Levesque BG. Advances in use of endoscopy, radiology, and biomarkers to monitor inflammatory bowel diseases. Gastroenterology. 2017;152:362–373. [DOI] [PubMed] [Google Scholar]
- 14.Ho IK, Cash BD, Cohen H, et al. Radiation exposure in gastroenterology: improving patient and staff protection. Am J Gastroenterol. 2014;109:1180–1194. [DOI] [PubMed] [Google Scholar]
- 15.Rimola J, Rodriguez S, Garcõa-Bosch O, et al. Magnetic resonance for assessment of disease activity and severity in ileocolonic Crohn's disease. Gut. 2009;58:1113–1120. [DOI] [PubMed] [Google Scholar]
- 16.Stojanov D, Aracki-Trenkic A, Benedeto-Stojanov D. Gadolinium deposition within the dentate nucleus and globus pallidus after repeated administrations of gadolinium-based contrast agents-current status. Neuroradiology. 2016;58:433–441. [DOI] [PubMed] [Google Scholar]
- 17.Moseley ME, Cohen Y, Mintorovitch J, et al. Early detection of regional cerebral ischemia in cats: comparison of diffusion- and T2-weighted MRI and spectroscopy. Magn Reson Med. 1990;14:330–346. [DOI] [PubMed] [Google Scholar]
- 18.Chan JH, Tsui EY, Luk SH, et al. Diffusion-weighted MR imaging of the liver: distinguishing hepatic abscess from cystic or necrotic tumor. Abdom Imaging. 2001;26:161–165. [DOI] [PubMed] [Google Scholar]
- 19.Oto A, Zhu F, Kulkarni K, et al. Evaluation of diffusion- weighted MR imaging for detection of bowel inflammation in patients with Crohn's disease. Acad Radiol. 2009;16:597–603. [DOI] [PMC free article] [PubMed] [Google Scholar]
- 20.Qi F, Jun S, Qi QY, et al. Utility of the diffusion-weighted imaging for activity evaluation in Crohn's disease patients underwent magnetic resonance enterography. BMC Gastroenterol. 2015;15:12. [DOI] [PMC free article] [PubMed] [Google Scholar]
- 21.Seo N, Park SH, Kim KJ, et al. MR enterography for the evaluation of small-bowel inflammation in Crohn disease by using diffusion-weighted imaging without intravenous contrast material: a prospective non inferiority study. Radiology. 2016;278:762–772. [DOI] [PubMed] [Google Scholar]
- 22.Shenoy-Bhangle AS, Nimkin K, Aranson T, et al. Value of diffusion weighted imaging when added to magnetic resonance enterographic evaluation of Crohn disease in children. Pediatr Radiol. 2016;46:34–42. [DOI] [PubMed] [Google Scholar]
- 23.Tielbeek JA, Ziech ML, Li Z, et al. Evaluation of conventional, dynamic contrast enhanced and diffusion weighted MRI for quantitative Crohn's disease assessment with histopathology of surgical specimens. Eur Radiol. 2014;24:619–629. [DOI] [PubMed] [Google Scholar]
- 24.Ream JM, Dillman JR, Adler J, et al. MRI diffusion-weighted imaging (DWI) in pediatric small bowel Crohn disease: correlation with MRI findings of active bowel wall inflammation. Pediatr Radiol. 2013;43:1077–1085. [DOI] [PubMed] [Google Scholar]
- 25.Kim KJ, Lee Y, Park SH, et al. Diffusion-weighted MR enterography for evaluating Crohn's disease: how does it add diagnostically to conventional MR enterography? Inflamm Bowel Dis. 2015;21:101–119. [DOI] [PubMed] [Google Scholar]
- 26.Sakuraba H, Ishiguro Y, Hasui K, et al. Prediction of maintained mucosal healing in patients with Crohn's disease under treatment with infliximab using diffusion-weighted magnetic resonance imaging. Digestion. 2014;89:49–54. [DOI] [PubMed] [Google Scholar]
- 27.Caruso A, DʼIncà R, Scarpa M, et al. Diffusion-weighted magnetic resonance for assessing ileal Crohn's disease activity. Inflamm Bowel Dis. 2014;20:1575–83. [DOI] [PubMed] [Google Scholar]
- 28.Park SH. DWI at MR enterography for evaluating bowel inflammation in Crohn Disease. AJR Am J Roentgenol. 2016;207:40–48. http://dx.doi.org/10.2214/AJR.15.15862. [DOI] [PubMed] [Google Scholar]
- 29.Dohan A, Taylor S, Hoeffel C, et al. Diffusion-weighted MRI in Crohn's disease: current status and recommendations. J Magn Reson Imaging. 2016;44:1381–1396. http://dx.doi.org/10.1002/jmri.25325. [DOI] [PubMed] [Google Scholar]
- 30.Oussalah A, Laurent V, Bruot O, et al. Diffusion-weighted magnetic resonance without bowel preparation for detecting colonic inflammation in inflammatory bowel disease. Gut. 2010;59:1056–1065. [DOI] [PubMed] [Google Scholar]
- 31.Choi SH, Kim KW, Lee JY, et al. Diffusion-weighted magnetic resonance enterography for evaluating bowel inflammation in Crohn's disease: a systematic review and meta-analysis. Inflamm Bowel Dis. 2016;22:669–679. [DOI] [PubMed] [Google Scholar]
- 32.Buisson A, Joubert A, Montoriol PF, et al. Diffusion - weighted magnetic resonance imaging for detecting and assessing ileal inflammation in Crohn's disease. Aliment Pharmacol Ther. 2013;37:537–545. [DOI] [PubMed] [Google Scholar]
- 33.Fiorino G, Bonifacio C, Padrenostro M, et al. Comparison between 1.5 and 3.0 Tesla magnetic resonance enterography for the assessment of disease activity and complications in ileo-colonic Crohn's disease. Dig Dis Sci. 2013;58:3246–3255. [DOI] [PubMed] [Google Scholar]
- 34.Rimola J, Ordas I, Rodriguez S, et al. Magnetic resonance imaging for evaluation of Crohn's disease: validation of parameters of severity and quantitative index of activity. Inflamm Bowel Dis. 2011;17:1759–1768. [DOI] [PubMed] [Google Scholar]
- 35.Panes J, Bouhnik Y, Reinisch W, et al. Imaging techniques for assessment of inflammatory bowel disease: joint ECCO and ESGAR evidence-based consensus guidelines. J Crohns Colitis. 2013;7:556–585. [DOI] [PubMed] [Google Scholar]
- 36.Ordás I, Rimola J, Rodríguez S, et al. Accuracy of magnetic resonance enterography in assessing response to therapy and mucosal healing in patients with Crohn's disease. Gastroenterology. 2014;146:374–382. [DOI] [PubMed] [Google Scholar]
- 37.Kim JS, Jang HY, Park SH, et al. MR enterography assessment of bowel inflammation severity in Crohn disease using the MR index of activity score: modifying roles of DWI and effects of contrast phases. AJR Am J Roentgenol. 2017;208:1022–1029. [DOI] [PubMed] [Google Scholar]
- 38.Rimola J, Alvarez-Cofiño A, Pérez-Jeldres T, et al. Comparison of three magnetic resonance enterography indices for grading activity in Crohn's disease. J Gastroenterol. 2017;52:585–593. [DOI] [PubMed] [Google Scholar]
- 39.Oto A, Kayhan A, Williams JT, et al. Active Crohn's disease in the small bowel: evaluation by diffusion weighted imaging and quantitative dynamic contrast enhanced MR imaging. J Magn Reson Imaging. 2011;33:615–624. [DOI] [PubMed] [Google Scholar]
- 40.Griffin N, Grant LA, Anderson S, et al. Small bowel MR enterography: problem solving in Crohn's disease. Insights Imaging. 2012;3:251–263. [DOI] [PMC free article] [PubMed] [Google Scholar]
- 41.Li XH, Sun CH, Mao R, et al. Assessment of activity of Crohn disease by diffusion-weighted magnetic resonance imaging. Medicine (Baltimore). 2015;94:e1819. [DOI] [PMC free article] [PubMed] [Google Scholar]
- 42.Neubauer H, Pabst T, Dick A, et al. Small-bowel MRI in children and young adults with Crohn disease: retrospective head-to-head comparison of contrast-enhanced and diffusion-weighted MRI. Pediatr Radiol. 2013;43:103–114. [DOI] [PubMed] [Google Scholar]
- 43.Ninivaggi V, Missere M, Restaino G, et al. MR-enterography with diffusion weighted imaging: ADC values in normal and pathological bowel loops, a possible threshold ADC value to differentiate active from inactive Crohn's disease. Eur Rev Med Pharmacol Sci. 2016;20:4540–4546. [PubMed] [Google Scholar]
- 44.Steward MJ, Punwani S, Proctor I, et al. Non-perforating small bowel Crohn's disease assessed by MRI enterography: derivation and histopathological validation of an MR-based activity index. Eur J Radiol. 2012;81:2080–2088. [DOI] [PubMed] [Google Scholar]
- 45.Klang E, Kopylov U, Eliakim R, et al. Diffusion-weighted imaging in quiescent Crohn's disease: correlation with inflammatory biomarkers and video capsule endoscopy. Clin Radiol. 2017;72:798.e7–798.e13. [DOI] [PubMed] [Google Scholar]


