

Supplemental digital content is available in the text.
Key Words: extracellular matrix, fibronectin, pancreatic cancer, tenascin C, tumor-stroma ratio
Abstract
Objectives
Pancreatic ductal adenocarcinoma (PDAC) is characterized by abundant stroma with increased expression of tenascin C and fibronectin. Their role and tumor-stroma ratio in PDAC are not well known. The aim of this study was to evaluate tenascin C and fibronectin expression and tumor-stroma ratio and their prognostic relevance in PDAC.
Methods
Ninety-five resected PDACs were immunohistochemically stained for tenascin C and fibronectin, and the expression was separately assessed in tumor bulk and front. Tumor-stroma ratio was determined with sections stained with hematoxylin-eosin.
Results
Tenascin C and fibronectin were abundantly expressed in the stroma of PDAC, but absent in adjacent normal pancreatic tissue. Fibronectin expression of the bulk was associated with high T class (P = 0.045). In the main analysis, tenascin C and fibronectin expression and tumor-stroma ratio were not associated with patient survival. In a subgroup analysis of early-stage PDAC (T1–T2 tumors), high tenascin C expression in the tumor bulk was associated with poor prognosis (hazard ratio, 8.23; 95% confidence interval, 2.71–24.96).
Conclusions
Tenascin C and fibronectin are abundantly expressed in PDAC, but they seem to have no major association with patient survival. However, in early-stage PDAC, tenascin C expression of the tumor bulk may have prognostic impact. Tumor-stroma ratio has no prognostic value in PDAC.
Pancreatic ductal adenocarcinoma (PDAC) is the seventh deadliest cancer worldwide and fourth deadliest in North America.1,2 Curative treatment can rarely be applied because PDAC is often diagnosed at an advanced stage. Even after initially curative surgery, the cancer often recurs.3 Cancerous cells of PDAC are accompanied by desmoplastic and fibrotic stroma consisting of extracellular matrix, stromal cells, blood vessels, immune cells, nerves, and other proteins forming the tumor microenvironment.4 In addition to supporting tumor cell growth, migration, and invasion, this microenvironment seems to be important for chemotherapy and drug delivery resistance in the tumor.5 Targeting both the cancer and its microenvironment is thought to be the key to improve survival of the disease.6
Tenascin C and fibronectin are extracellular matrix glycoproteins with ability to modulate cell adhesion and migration.7,8 In cancers, tenascin C enhances proliferation, invasion, and angiogenesis during tumorigenesis and tumor dissemination,9 whereas fibronectin is important for chemoresistance and metastasizing.10 Both proteins are involved in cancer-related inflammation and stromal reaction.7,11 Previous studies have suggested that high expression of both fibronectin and tenascin C associates with poor prognosis in PDAC.9,12
In cancer, the ratio of cancerous cells to the surrounding stroma has been named tumor-stroma ratio.13 Low tumor-stroma ratio has been shown to associate with poor prognosis in colon carcinoma14 and later in several other cancers.13 Recently, a single study of 66 patients suggested the opposite in PDAC.15
The aims of the present study were to characterize the expression of tenascin C and fibronectin and determine tumor-stroma ratio in PDAC. In addition to evaluation of the potential prognostic value of these features in PDAC, we were also interested in the role of tenascin C and fibronectin in the regulation of tumor-stroma ratio in PDAC.
MATERIALS AND METHODS
Patients
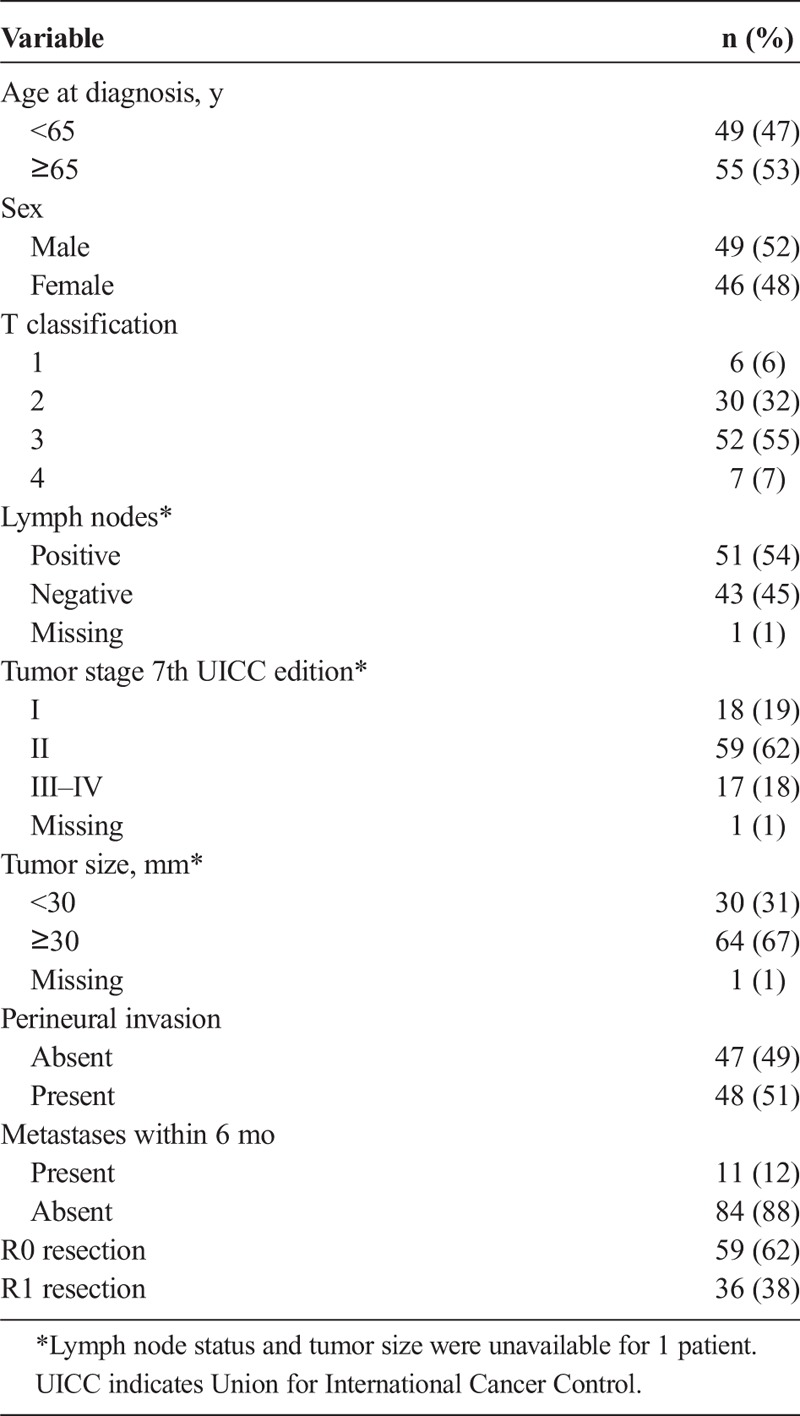
The study was a retrospective cohort study. Paraffin-embedded archival specimens of consecutive surgically resected PDAC were collected from Oulu University Hospital, pathology department archives, between years 1993 and 2015. The final series consisted of 95 patients with PDAC. The diagnosis for all patients was confirmed by an expert gastrointestinal pathologist (T.J.K.). The patients underwent pancreaticoduodenectomy according to Whipple (n = 81), subtotal pancreatectomy (n = 3), and total pancreatectomy (n = 11). The median age of the patients at diagnosis was 66 years (range, 36–81 years). The median follow-up time was 18 months (range, 0.8–172 months). Metachronic metastases were detected within 6 months after surgery in 11 patients (12%), and they were analyzed in group stage III–IV. Patient characteristic are described more specifically in Table 1. Patient clinical data were obtained from patient records, and patient survival data and cause of death were obtained from the cause of death registry from Statistics Finland. Use of the samples and patient data was approved by the Oulu University Hospital Ethics Committee and by the National Authority for Medicolegal Affairs.
TABLE 1.
Baseline Characteristics of 95 Patients With Resected PDAC
Immunohistochemistry
The representative tissue blocks for immunohistochemistry were selected on the basis of hematoxylin-eosin–stained sections. Sections of 5 μm were mounted and dewaxed in xylene. For antigen retrieval, the sections were heated in Tris-EDTA solution (pH 9) for 10 minutes. Endogenous peroxidase activity was blocked using peroxidase-blocking solution (DAKO, Copenhagen, Denmark) for 10 minutes. Incubation with primary antibodies D2 (tenascin C) and F12 (fibronectin) in dilution of 1:500 for 60 minutes at room temperature was done. Previously described antibodies against fibronectin and tenascin C were used.16 The antibodies were validated by comparison to commercially available fibronectin and tenascin C antibodies, as well as using mass spectrometry. Horseradish peroxidase–conjugated antibodies (DAKO) were introduced to sections for 10 minutes, after which DAB chromogen was used for 5 minutes. Slides were counterstained with hematoxylin. We validated the immunohistochemical analysis through 2 series of negative controls (omitting the primary antibody and by replacing primary antibody with the mouse primary antibody isotype control).
Assessment of Tenascin C and Fibronectin Expression
The histological samples were digitalized using Aperio AT2 Console (Leica Biosystems Imaging Inc, Nussloch, Germany). Immunoreactivity of tenascin C and fibronectin in PDAC lesions was analyzed by 2 independent researchers, blinded for clinical data. Nonepithelial (stromal) parts and epithelial cells were separately assessed. The bulk of the tumor and the invasive front were also separately evaluated. The invasive front was regarded as the site of deepest invasion. We analyzed the amount and pattern of tenascin C and fibronectin expression in the stroma with a 5-point scale, slightly modified from that described earlier17: no detectable staining = 0, focal staining = 1, areas diffuse staining present in less than half of stromal area = 2, expression in more than half but not in all parts of the tumor stroma = 3, and expression extending throughout the stroma = 4. Furthermore, the intensity of the epithelial staining was evaluated on a 4-point scale (0 = negative, 1 = weak, 2 = moderate, 3 = strong), and proportion of stained epithelial cells (0%–100% in 10% intervals) was also evaluated. When interobserver difference was less than 1 point in amount stromal staining or intensity in the epithelial staining, or up to 20% in the proportion, the mean value of the independent estimates was used for statistical analysis. Cases with higher differences were reevaluated, and a single score was given by consensus between the 2 observers.
Assessment of Tumor-Stroma Ratio
Tumor-stroma ratio was evaluated from hematoxylin-eosin–stained sections from all carcinoma patients (n = 95) according to guidelines described earlier.18 Ratio was analyzed from the invasive front as previous studies have shown its usefulness as a prognostic factor.13 A single moderate magnification (10×) field was selected for analysis so that all 4 corners of the vision field were located within the tumor. Percentage (0%–100%) of field composed of tumor epithelium was assessed and referred to as tumor-stroma ratio. Mean estimate by 2 independent researchers was used if the difference between assessors was less than 20%, and in cases with larger difference, a consensus score was determined by a joint evaluation.
Statistical Analysis
For statistical analysis IBM SPSS 24.0 (IBM Corp, Armonk, NY) was used. Cohen κ was calculated to analyze interobserver agreement. A χ2 test was used to obtain P values when comparing categorical variables. The stromal tenascin C and fibronectin expression was divided into 2 categories: low (0–2) and high (>2) for statistical analysis. Comparison between tumor bulk and invasive front was done with paired-samples t test. Tumor-stroma ratio was divided according to the median value to low (≤35%) and high (>35%). A χ2 test was used to evaluate statistical significance of the differences between tenascin C and fibronectin expression, tumor-stroma ratio, and clinicopathological variables. Spearman 2-tailed correlation test was used to calculate correlations between tenascin C, fibronectin, and tumor-stroma ratio. Kaplan-Meier was used to calculate life tables, and disease-specific survival curves were compared with the log-rank test. Cox proportional hazards model was used for multivariable analysis with the following a priori–determined confounders: age (<65 or ≤65 years), sex (male or female), and tumor stage (I, II, or III–IV). Additionally, subgroup analyses were conducted in T stage I–II cancers with Kaplan-Meier method and Cox regression. Intercorrelation coefficient estimates were calculated using 2-way mixed-effects model.
RESULTS
Interobserver agreement in the evaluation of tenascin C and fibronectin expression was high. None of the studied cases needed reevaluation. Intercorrelation coefficient between the 2 observers varied between 0.872 and 0.904 in tenascin C and fibronectin front and bulk, indicating good reproducibility. Similarly, in the evaluation of tumor-stroma ratio, intercorrelation coefficient between the 2 observers was 0.92. Reevaluation was not needed in any case, as the interobserver difference was 20% or less in all cases.
Tenascin C Expression
Tenascin C staining pattern was restricted to the tumor stroma, and none of the cases showed positive epithelial tenascin C expression. No positive staining for tenascin C was found in adjacent normal pancreatic tissue (Figs. 1A, B). Positive tenascin C expression in the bulk of the tumor was similarly found in 77 (81%) of 95 cases (mean score, 1.64 [standard deviation {SD}, 1.21]; 95% confidence interval [CI], 1.39–1.88) and in the invasive front in 88 (93%) of 95 cases (mean score, 1.7 [SD, 1.07]; 95% CI, 1.48–1.92) with no significant difference between bulk and tumor front (P = 0.614). In correlation analysis, tenascin C levels in the tumor bulk and front were highly correlated (correlation coefficient, 0.421; P < 0.001), and therefore associations with clinicopathological variables and survival were conducted using only the tenascin C staining in the bulk.
FIGURE 1.
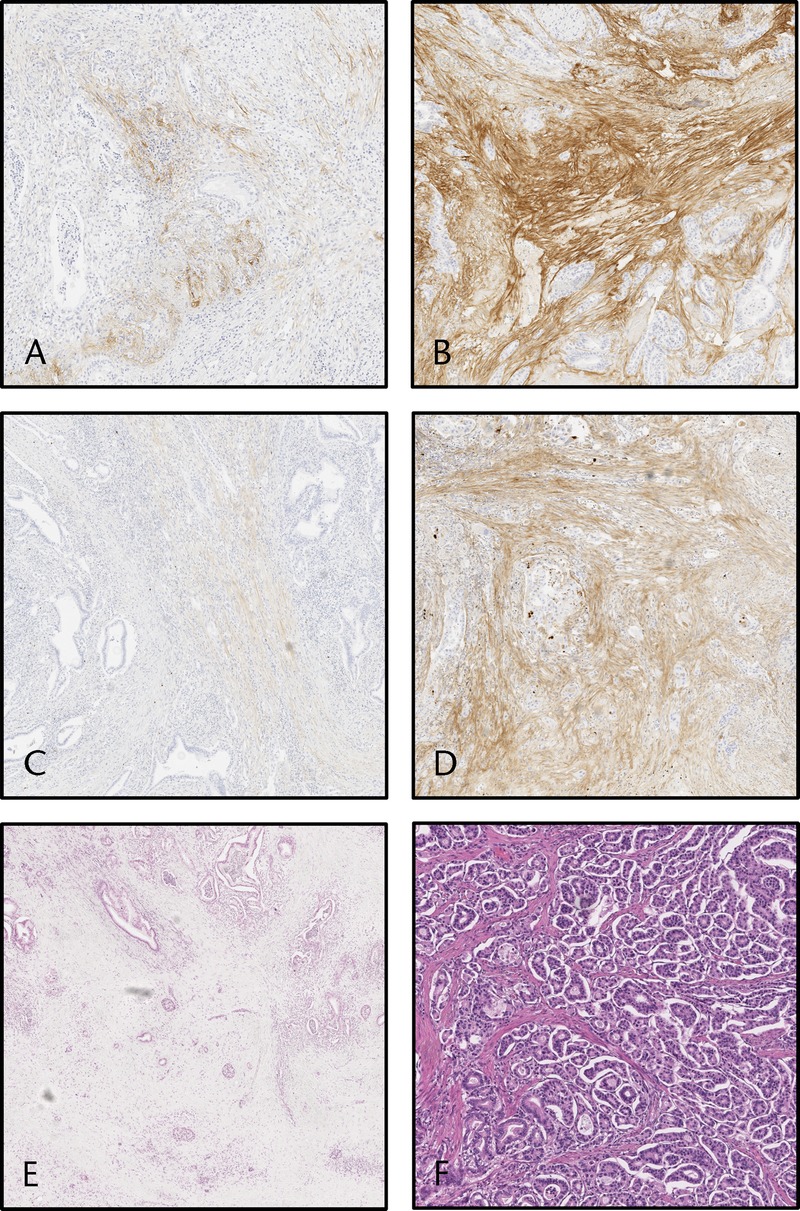
Images visualizing the expression of tenascin C and fibronectin in the stroma of PDAC and images visualizing the different tumor-stroma ratios. Pancreatic ductal adenocarcinoma showing (A) low (score 1–2) and (B) high (score 3–4) tenascin C expression in the stroma. Pancreatic ductal adenocarcinoma with (C) low (score 1–2) and (D) high (score 3–4) fibronectin expression in the stroma. Pancreatic ductal adenocarcinoma with (E) low (≤35%) and (F) high (>35%) tumor-stroma ratio.
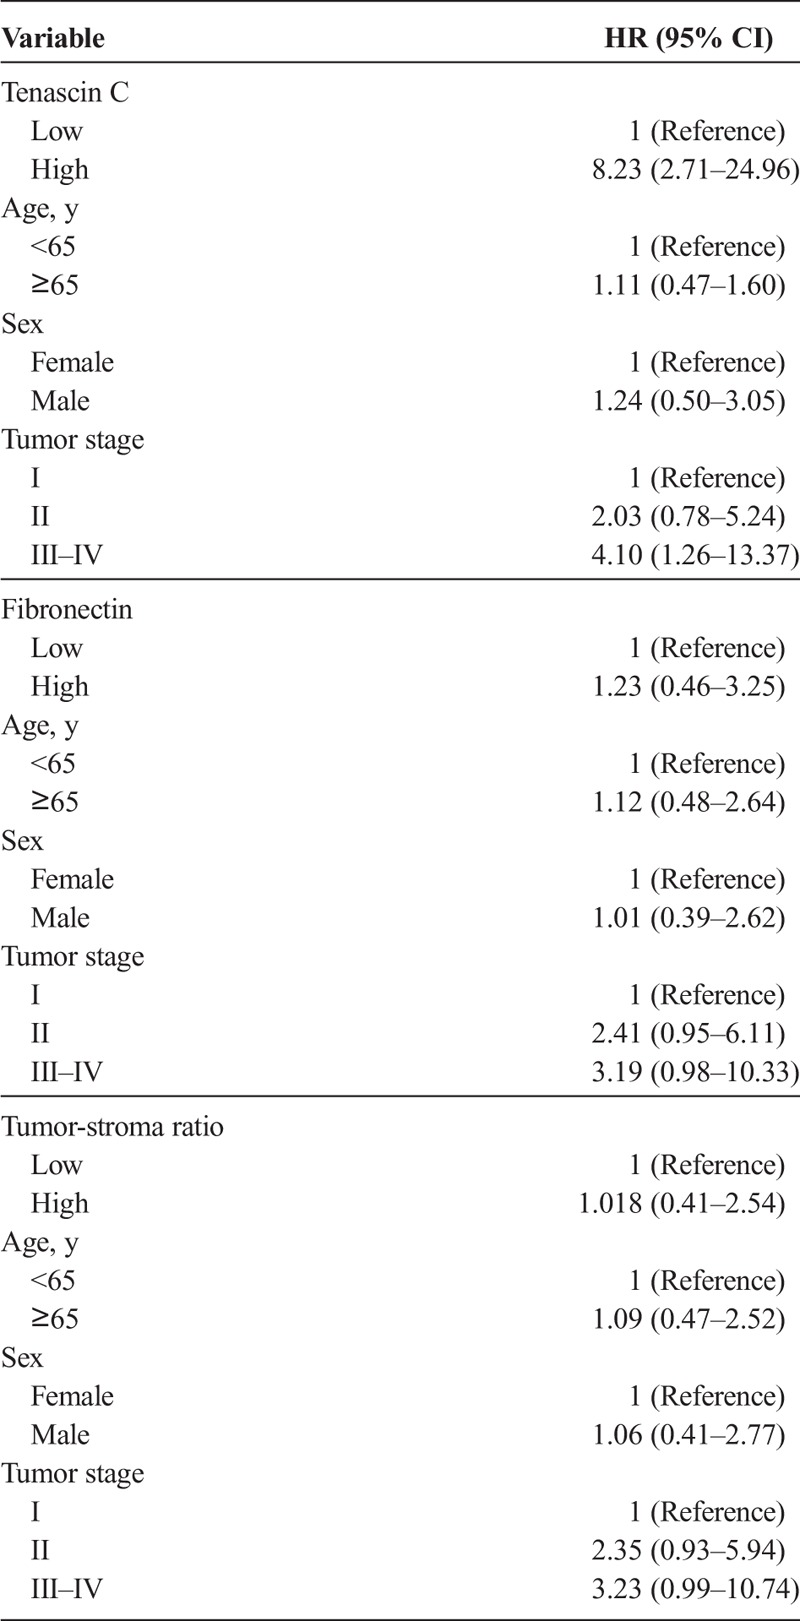
Tenascin C expression did not associate with any of the clinicopathological variables (Supplementary Table 1, http://links.lww.com/MPA/A690) or survival in the main analysis (Table 2). In the subgroup analysis of T1 and T2 PDAC (n = 36), high tenascin C expression was associated with poor survival (log rank, P < 0.001; Fig. 2). Mean survival time was 33.4 months (95% CI, 23.6–43.4 months) for patients with low tenascin C expression and 10.2 months (95% CI, 6.4–14.0 months) for patients with high tenascin C expression. Multivariable analysis identified high tenascin C expression (hazard ratio [HR], 8.23; 95% CI, 2.71–24.96) as a prognostic factor for pancreatic cancer–specific death within tumor stage II (HR, 4.10; 95% CI, 1.26–13.37; stage III–IV vs stage I; Table 3).
TABLE 2.
Multivariate Analysis of Prognostic Factors in PDAC Patients
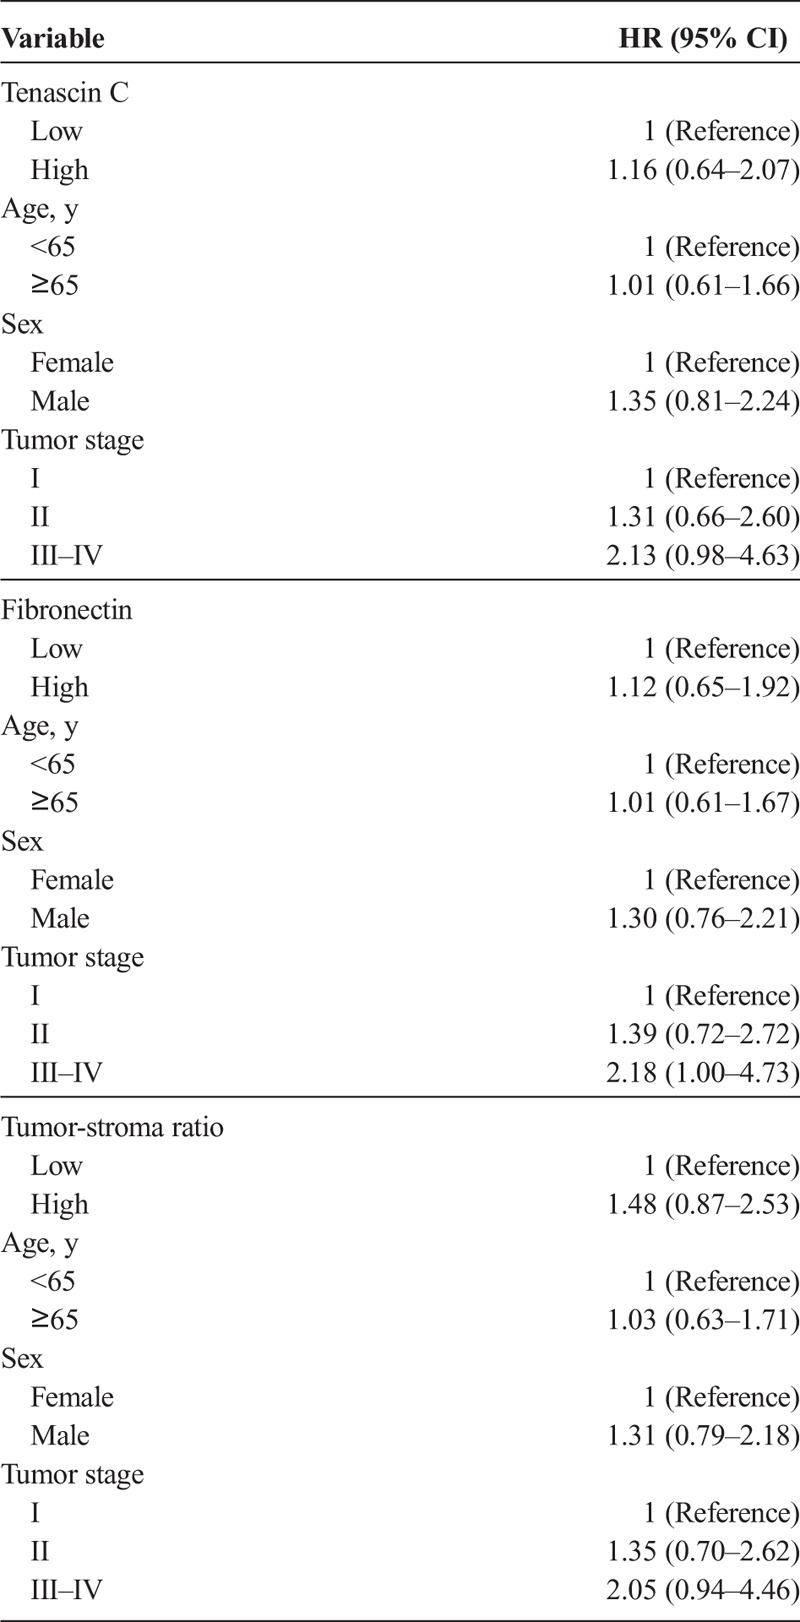
FIGURE 2.
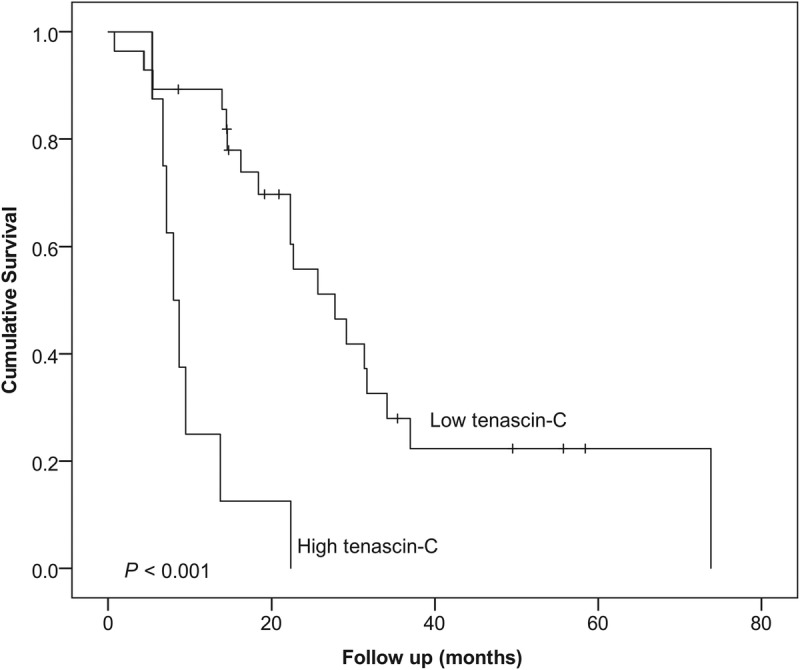
Kaplan-Meier curve showing the survival of the 36 patients with T1–T2 PDAC, stratified by tenascin C expression of the tumor bulk. Log-rank test was used to calculate the statistical significance.
TABLE 3.
Multivariate Analysis of Prognostic Factors in Subgroup Analysis of 36 T Stage I–II PDAC Patients
Fibronectin Expression
Adjacent normal pancreatic tissue showed no positive fibronectin staining. Positive fibronectin staining was restricted to the stromal component of the tumor, whereas no positive staining was found in the epithelial cells (Figs. 1C, D). Positive fibronectin staining in the bulk of the tumor was found in 82 (86%) of 95 cases (mean score, 2.00 [SD, 1.30]; 95% CI, 1.74–2.26) and in the invasive front in 79 (83%) of 95 cases (mean score, 1.94 [SD, 1.35]; 95% CI, 1.67–2.22). Fibronectin staining patterns and intensities were similar without significant difference in tumor bulk and invasive front (P = 0.624). Fibronectin expressions in the tumor bulk and front were highly correlated (correlation coefficient, 0.621; P < 0.001).
Fibronectin expression was associated with high T class (P = 0.045), but not with other clinicopathological variables (Supplementary Table 1, http://links.lww.com/MPA/A690). Fibronectin expression was not associated with survival in the main (Table 2) or the subgroup analysis (Table 3).
Tumor-Stroma Ratio
The mean tumor-stroma ratio in the cohort was 40% (median, 35% [SD, 20.6%]; range, 10%–90%; Figs. 1E, F). Tumor-stroma was not associated with clinicopathological variables (Supplementary Table 1, http://links.lww.com/MPA/A690) or survival in the main (Table 2) or the subgroup analysis (Table 3).
Correlations Between Tenascin C, Fibronectin, and Tumor-Stroma Ratio
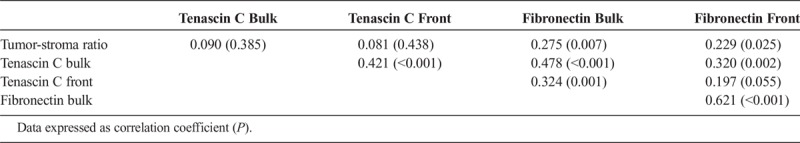
There was no correlation between tenascin C expression and tumor-stroma ratio. For fibronectin expression, a weak correlation was observed with tumor-stroma ratio both in tumor bulk and invasive front (correlation coefficients, 0.275 [P = 0.007] and 0.229 [P = 0.025], respectively). The correlation analysis is summarized in Table 4.
TABLE 4.
Correlations Between Tenascin C Expression, Fibronectin Expression, and Tumor-Stroma Ratio in 95 PDAC Patients, Calculated Using 2-Tailed Spearman Correlation
DISCUSSION
The present study shows that tenascin C and fibronectin are widely expressed in the stroma of PDAC. Although no association between high tenascin C expression and survival was found in the main analysis, high tenascin C expression may predict poor prognosis in T1–T2 PDAC according to the subgroup analysis. Fibronectin expression and tumor-stroma ratio seem to have no value in the prognostic assessment of PDAC.
Strengths of the present study compared with previous studies that investigated fibronectin, tenascin C, and tumor-stroma ratio in PDAC are the relatively large population (n = 95) of consecutive patients from a single geographical area of Northern Finland, without apparent selection bias, and excellent interobserver agreement without a need for reevaluation of the studied parameters. Tumor-stroma ratio was evaluated according to earlier described guidelines, adding to the reliability of the analysis.13 The weakness of this study is the use of immunohistochemistry as the only evaluation method of the expression of fibronectin and tenascin C.
In previous studies, tenascin C has been suggested as a marker for metastasis and tumor invasion,19,20 and its significance on patient survival was previously observed in esophageal adenocarcinoma.21 In line with previous studies, tenascin C expression was observed in the tumor stroma, rather than in the epithelial tumor cells.16,22 Tenascin C has been shown to be expressed in PDAC, and its high expression has been associated with patient survival in previous studies.9,23,24 The main analysis does not support the previous findings. However, as observed in tongue squamous cell carcinoma,16 the subgroup analysis in T1 and T2 tumors associated the high tenascin C expression of the tumor bulk with poor outcome. These results suggest that tenascin C is prognostic at earlier stages, but the effect disperses in advanced disease. The result is biologically reasonable, as previous studies have shown that tenascin C induces tumor growth by regulating cell adhesion and migration and affects the expression of oncogenes and tumor suppressor genes.25,26 However, the subgroup was relatively small (n = 36), and therefore the result should be addressed with caution.
Fibronectin regulates cell adhesion, migration, growth, proliferation, and wound healing and guides assembly of other extracellular matrix proteins such as tenascin C.8 No association between high expression of fibronectin and prognosis in PDAC was found, as opposed to the previous study with smaller population (n = 33).12 However, an association between high expression of fibronectin of the tumor bulk and high T stage was observed similarly to in esophageal adenocarcinoma.21 While this is in line with other previous studies suggesting fibronectin's role in cancer development and growth in addition to chemoresistance and promoting metastasizing,10 it may also be a chance finding related to multiple statistical testing. Indeed, fibronectin has been considered a possible target for tumor therapy for over a decade, with disappointing results so far.10,27
Abundant stroma within the tumor leads to chemoresistance, poor delivery of nutrients, hypovascularization, and poor oxygenation.10 Previous studies have suggested that tumor-stroma ratio is useful as a prognostic factor in various cancers, such as triple-negative breast cancer, colorectal cancer, cervical cancer, hepatocellular cancer, epithelial ovarian cancer, nasopharyngeal cancer, non–small cell lung cancer, endometrial cancer, and esophageal adenocarcinoma.28–38 In these cancer types, low tumor-stroma ratio or stroma-rich tumors are typically associated with poor outcome. In pancreatic cancer, however, only 1 previous study suggested that stroma-rich tumors could have better prognosis, a result contradictory to other cancer types.15 These results, together with the present study, suggest that in PDAC the role of stroma might be more complex compared with other solid tumors. Pancreatic ductal adenocarcinoma is characterized by abundant stroma, and only 10% to 40% of the tumor consists of tumor cells.39,40 The abundant stroma is considered an important reason for PDAC's aggressive nature and chemoresistance.41 In the present study, only a weak correlation between tumor-stroma ratio and fibronectin levels in both the tumor bulk and invasive front was observed, and there was no significant correlation between tumor-stroma ratio and tenascin C levels. These results suggest that tenascin C expression is not a factor regulating the amount of tumor stroma, and similarly, fibronectin expression has only limited effect on the stromal expansion.
In conclusion, fibronectin and tenascin C are widely expressed in the stroma of PDAC. Tenascin C of the bulk tumor may be associated with poor prognosis in less advanced T1 and T2 PDACs, although confirmatory studies are needed. Fibronectin expression and tumor-stroma ratio seem to have no prognostic value in PDAC.
Supplementary Material
ACKNOWLEDGMENTS
The authors thank Erja Tomperi and Riitta Vuento for their excellent technical assistance.
Footnotes
O.H. and H.H. are co–senior authors.
J.L. and V.L. had full access to all of the data in the study and take responsibility for the integrity of the data and the accuracy of the data analysis. J.L., V.L., J.H.K., H.H., and O.H. contributed to the study concept and design. J.L., V.L., K.-M.H., P.K., and J.I. contributed to the acquisition of the data. J.L., V.L., J.H.K., T.J.K., H.H., and O.H. contributed to the analysis and interpretation of the data. J.L., V.L., H.H. and O.H. drafted the manuscript. J.H.K., P.P.L., J.S., T.J.K., H.H., and O.H. critically revised the manuscript for important intellectual content. J.L. and V.L. were responsible for the statistical analysis. P.P.L., J.S., J.H.K., T.J.K., H.H., and O.H. provided administrative, technical, or material support. H.H. and O.H. supervised the study. All authors read and approved the final version of the manuscript.
This work was supported by grants from the Orion Research Foundation (J.H.K.), Thelma Mäkikyrö Foundation (J.H.K., H.H.), Päivikki and Sakari Sohlberg Foundation (J.L., H.H.), Georg C. and Mary Ehrnroot Foundation (J.H.K., H.H.), Sigrid Juselius Foundation (J.H.K.), Finnish Medical Foundation (J.L., H.H.), Emil Aaltonen Foundation (J.L.), and Finnish Cultural Foundation (J.L.).
The authors declare no conflict of interest.
Supplemental digital contents are available for this article. Direct URL citations appear in the printed text and are provided in the HTML and PDF versions of this article on the journal’s Web site (www.pancreasjournal.com).
REFERENCES
- 1.Ferlay J, Soerjomataram I, Dikshit R, et al. Cancer incidence and mortality worldwide: sources, methods and major patterns in GLOBOCAN 2012. Int J Cancer. 2015;136:E359–E386. [DOI] [PubMed] [Google Scholar]
- 2.Fitzmaurice C, Allen C, Global Burden of Disease Cancer Collaboration et al. Global, regional, and national cancer incidence, mortality, years of life lost, years lived with disability, and disability-adjusted life-years for 32 cancer groups, 1990 to 2015: a systematic analysis for the global burden of disease study. JAMA Oncol. 2017;3:524–548. [DOI] [PMC free article] [PubMed] [Google Scholar]
- 3.Close WH, Berschauer F, Heavens RP. The influence of protein:Energy value of the ration and level of feed intake on the energy and nitrogen metabolism of the growing pig. 1. Energy metabolism. Br J Nutr. 1983;49:255–269. [DOI] [PubMed] [Google Scholar]
- 4.Spill F, Reynolds DS, Kamm RD, et al. Impact of the physical microenvironment on tumor progression and metastasis. Curr Opin Biotechnol. 2016;40:41–48. [DOI] [PMC free article] [PubMed] [Google Scholar]
- 5.Xu Z, Pothula SP, Wilson JS, et al. Pancreatic cancer and its stroma: a conspiracy theory. World J Gastroenterol. 2014;20:11216–11229. [DOI] [PMC free article] [PubMed] [Google Scholar]
- 6.Strauss J, Alewine C, Figg WD, et al. Targeting the microenvironment of pancreatic cancer: overcoming treatment barriers and improving local immune responses. Clin Transl Oncol. 2016;18:653–659. [DOI] [PMC free article] [PubMed] [Google Scholar]
- 7.Chiquet-Ehrismann R, Tucker RP. Tenascins and the importance of adhesion modulation. Cold Spring Harb Perspect Biol. 2011;3. pii: a004960. [DOI] [PMC free article] [PubMed] [Google Scholar]
- 8.Kumra H, Reinhardt DP. Fibronectin-targeted drug delivery in cancer. Adv Drug Deliv Rev. 2016;97:101–110. [DOI] [PubMed] [Google Scholar]
- 9.Xu Y, Li Z, Jiang P, et al. The co-expression of MMP-9 and tenascin-C is significantly associated with the progression and prognosis of pancreatic cancer. Diagn Pathol. 2015;10:211. [DOI] [PMC free article] [PubMed] [Google Scholar]
- 10.Topalovski M, Brekken RA. Matrix control of pancreatic cancer: new insights into fibronectin signaling. Cancer Lett. 2016;381:252–258. [DOI] [PMC free article] [PubMed] [Google Scholar]
- 11.Beier UH, Holtmeier C, Weise JB, et al. Fibronectin suppression in head and neck cancers, inflammatory tissues and the molecular mechanisms potentially involved. Int J Oncol. 2007;30:621–629. [PubMed] [Google Scholar]
- 12.Javle MM, Gibbs JF, Iwata KK, et al. Epithelial-mesenchymal transition (EMT) and activated extracellular signal-regulated kinase (p-ERK) in surgically resected pancreatic cancer. Ann Surg Oncol. 2007;14:3527–3533. [DOI] [PubMed] [Google Scholar]
- 13.Zhang R, Song W, Wang K, et al. Tumor-stroma ratio (TSR) as a potential novel predictor of prognosis in digestive system cancers: a meta-analysis. Clin Chim Acta. 2017;472:64–68. [DOI] [PubMed] [Google Scholar]
- 14.Mesker WE, Junggeburt JM, Szuhai K, et al. The carcinoma-stromal ratio of colon carcinoma is an independent factor for survival compared to lymph node status and tumor stage. Cell Oncol. 2007;29:387–398. [DOI] [PMC free article] [PubMed] [Google Scholar]
- 15.Bever KM, Sugar EA, Bigelow E, et al. The prognostic value of stroma in pancreatic cancer in patients receiving adjuvant therapy. HPB (Oxford). 2015;17:292–298. [DOI] [PMC free article] [PubMed] [Google Scholar]
- 16.Sundquist E, Kauppila JH, Veijola J, et al. Tenascin-C and fibronectin expression divide early stage tongue cancer into low- and high-risk groups. Br J Cancer. 2017;116:640–648. [DOI] [PMC free article] [PubMed] [Google Scholar]
- 17.Bello IO, Vered M, Dayan D, et al. Cancer-associated fibroblasts, a parameter of the tumor microenvironment, overcomes carcinoma-associated parameters in the prognosis of patients with mobile tongue cancer. Oral Oncol. 2011;47:33–38. [DOI] [PubMed] [Google Scholar]
- 18.Courrech Staal EF, Wouters MW, van Sandick JW, et al. The stromal part of adenocarcinomas of the oesophagus: does it conceal targets for therapy? Eur J Cancer. 2010;46:720–728. [DOI] [PubMed] [Google Scholar]
- 19.Yang ZT, Yeo SY, Yin YX, et al. Tenascin-C, a prognostic determinant of esophageal squamous cell carcinoma. PLoS One. 2016;11:e0145807. [DOI] [PMC free article] [PubMed] [Google Scholar]
- 20.Van Obberghen-Schilling E, Tucker RP, Saupe F, et al. Fibronectin and tenascin-C: accomplices in vascular morphogenesis during development and tumor growth. Int J Dev Biol. 2011;55:511–525. [DOI] [PubMed] [Google Scholar]
- 21.Leppänen J, Bogdanoff S, Lehenkari PP, et al. Tenascin-C and fibronectin in normal esophageal mucosa, Barrett's esophagus, dysplasia and adenocarcinoma. Oncotarget. 2017;8:66865–66877. [DOI] [PMC free article] [PubMed] [Google Scholar]
- 22.Ishihara A, Yoshida T, Tamaki H, et al. Tenascin expression in cancer cells and stroma of human breast cancer and its prognostic significance. Clin Cancer Res. 1995;1:1035–1041. [PubMed] [Google Scholar]
- 23.Esposito I, Penzel R, Chaib-Harrireche M, et al. Tenascin C and annexin II expression in the process of pancreatic carcinogenesis. J Pathol. 2006;208:673–685. [DOI] [PubMed] [Google Scholar]
- 24.Juuti A, Nordling S, Louhimo J, et al. Tenascin C expression is upregulated in pancreatic cancer and correlates with differentiation. J Clin Pathol. 2004;57:1151–1155. [DOI] [PMC free article] [PubMed] [Google Scholar]
- 25.Orend G, Chiquet-Ehrismann R. Tenascin-C induced signaling in cancer. Cancer Lett. 2006;244:143–163. [DOI] [PubMed] [Google Scholar]
- 26.Chiquet-Ehrismann R, Chiquet M. Tenascins: regulation and putative functions during pathological stress. J Pathol. 2003;200:488–499. [DOI] [PubMed] [Google Scholar]
- 27.Kaspar M, Zardi L, Neri D. Fibronectin as target for tumor therapy. Int J Cancer. 2006;118:1331–1339. [DOI] [PubMed] [Google Scholar]
- 28.de Kruijf EM, van Nes JG, van de Velde CJ, et al. Tumor-stroma ratio in the primary tumor is a prognostic factor in early breast cancer patients, especially in triple-negative carcinoma patients. Breast Cancer Res Treat. 2011;125:687–696. [DOI] [PubMed] [Google Scholar]
- 29.Downey CL, Simpkins SA, White J, et al. The prognostic significance of tumour-stroma ratio in oestrogen receptor–positive breast cancer. Br J Cancer. 2014;110:1744–1747. [DOI] [PMC free article] [PubMed] [Google Scholar]
- 30.Park JH, Richards CH, McMillan DC, et al. The relationship between tumour stroma percentage, the tumour microenvironment and survival in patients with primary operable colorectal cancer. Ann Oncol. 2014;25:644–651. [DOI] [PMC free article] [PubMed] [Google Scholar]
- 31.Park JH, McMillan DC, Powell AG, et al. Evaluation of a tumor microenvironment–based prognostic score in primary operable colorectal cancer. Clin Cancer Res. 2015;21:882–888. [DOI] [PubMed] [Google Scholar]
- 32.Pongsuvareeyakul T, Khunamornpong S, Settakorn J, et al. Prognostic evaluation of tumor-stroma ratio in patients with early stage cervical adenocarcinoma treated by surgery. Asian Pac J Cancer Prev. 2015;16:4363–4368. [DOI] [PubMed] [Google Scholar]
- 33.Lv Z, Cai X, Weng X, et al. Tumor-stroma ratio is a prognostic factor for survival in hepatocellular carcinoma patients after liver resection or transplantation. Surgery. 2015;158:142–150. [DOI] [PubMed] [Google Scholar]
- 34.Chen Y, Zhang L, Liu W, et al. Prognostic significance of the tumor-stroma ratio in epithelial ovarian cancer. Biomed Res Int. 2015;2015:589301. [DOI] [PMC free article] [PubMed] [Google Scholar]
- 35.Zhang XL, Jiang C, Zhang ZX, et al. The tumor-stroma ratio is an independent predictor for survival in nasopharyngeal cancer. Oncol Res Treat. 2014;37:480–484. [DOI] [PubMed] [Google Scholar]
- 36.Zhang T, Xu J, Shen H, et al. Tumor-stroma ratio is an independent predictor for survival in NSCLC. Int J Clin Exp Pathol. 2015;8:11348–11355. [PMC free article] [PubMed] [Google Scholar]
- 37.Panayiotou H, Orsi NM, Thygesen HH, et al. The prognostic significance of tumour-stroma ratio in endometrial carcinoma. BMC Cancer. 2015;15:955. [DOI] [PMC free article] [PubMed] [Google Scholar]
- 38.Wang K, Ma W, Wang J, et al. Tumor-stroma ratio is an independent predictor for survival in esophageal squamous cell carcinoma. J Thorac Oncol. 2012;7:1457–1461. [DOI] [PubMed] [Google Scholar]
- 39.Farrow B, Albo D, Berger DH. The role of the tumor microenvironment in the progression of pancreatic cancer. J Surg Res. 2008;149:319–328. [DOI] [PubMed] [Google Scholar]
- 40.Neesse A, Michl P, Frese KK, et al. Stromal biology and therapy in pancreatic cancer. Gut. 2011;60:861–868. [DOI] [PubMed] [Google Scholar]
- 41.Feig C, Gopinathan A, Neesse A, et al. The pancreas cancer microenvironment. Clin Cancer Res. 2012;18:4266–4276. [DOI] [PMC free article] [PubMed] [Google Scholar]
Associated Data
This section collects any data citations, data availability statements, or supplementary materials included in this article.