Abstract
Long non-coding RNAs (lncRNAs) are a specific group of RNA molecules that do not encode proteins. They have been shown to serve important regulatory functions in various biological and cell differentiation processes. However, the potential functions and regulatory mechanisms of lncRNAs that are associated with the osteogenic differentiation of human bone marrow mesenchymal stem cells (hBMSCs) remain to be elucidated. The present study aimed to investigate lncRNAs that are differentially expressed during the osteogenic differentiation of hBMSCs, along with the potential functions of those lncRNAs. To this end, three groups of hBMSCs were stimulated to undergo osteogenic differentiation for 7 days. Known lncRNAs, unknown lncRNAs and mRNAs that demonstrated differential expression prior to and following the osteogenic differentiation of hBMSCs were screened using lncRNA high-throughput sequencing. In addition, 12 lncRNAs were selected for reverse transcription-quantitative polymerase chain reaction (RT-qPCR) validation of the accuracy of the sequencing results. The potential functions and possible targets of the differentially expressed lncRNAs were analyzed using bioinformatics technologies (gene ontology, Kyoto Encyclopedia of Genes and Genomes and gene co-expression network analysis). In total, 64 lncRNAs were differentially expressed by at least two-fold in hBMSCs prior to and following osteogenic differentiation; these included seven known lncRNAs (two upregulated and five downregulated lncRNAs) and 57 unknown lncRNAs (35 upregulated and 22 downregulated lncRNAs). In addition, 409 mRNAs (257 upregulated and 152 downregulated mRNAs) were differentially expressed by at least two-fold. The RT-qPCR results obtained for 12 selected differentially expressed lncRNAs were consistent with the sequencing results. The gene co-expression network analysis of lncRNAs and mRNAs demonstrated that four lncRNAs (ENSG00000238042, lnc_1269, lnc_1369 and lnc_1708) may serve important roles in the osteogenic differentiation of hBMSCs. In conclusion, during the osteogenic differentiation of hBMSCs, the lncRNA expression profile changed significantly; certain of the observed differentially expressed lncRNAs may be derived from protein-coding genes and may serve important roles in osteogenic differentiation.
Keywords: hBMSCs, osteogenic differentiation, lncRNA, high-throughput sequencing, bioinformatics analyses
Introduction
Bone tissue defects caused by tumors, trauma and congenital malformations that occur in the maxillofacial region usually require bone reconstruction and repair. However, both conventional autologous bone transplantation and allogenic bone transplantation possess disadvantages (1). In recent years, bone tissue engineering studies have suggested new methods for bone defect repair. The fundamental issue in tissue engineering is the selection of seed cells. Human bone marrow mesenchymal stem cells (hBMSCs) possess strong self-renewal potential and may be pluripotent. They may be differentiated into bone cells under appropriate culture conditions (2). In addition, extensive sources of these cells are available, they are easy to collect, their collection causes little damage to the body and they generally induce only mild immune reactions upon transplantation. For these reasons, hBMSCs have been used extensively in bone tissue engineering studies (3). Directed osteogenic differentiation of BMSCs is regulated by complex pathways at the transcriptional and post-transcriptional levels. However, the specific mechanisms underlying the molecular regulation of their differentiation remain unclear.
Long non-coding RNAs (lncRNAs) are a specific group of RNA molecules that are >200 nt in length. Although lncRNAs do not encode proteins (4), they have been reported to serve important regulatory functions in various biological and cell differentiation processes, including genomic imprinting, chromosomal inactivation and differentiation, at the transcriptional, post-transcriptional and even translational levels (5). In addition, accumulating evidence indicates that lncRNAs regulate gene expression through their interactions with DNAs, RNAs and proteins (6). Recent studies have also demonstrated that numerous lncRNAs are involved in the regulation of osteogenic differentiation of MSCs (7–9). However, the potential functions and regulatory mechanisms of lncRNAs that are associated with the osteogenic differentiation of hBMSCs remain to be elucidated.
The present study used high-throughput sequencing to identify lncRNAs associated with the osteogenic differentiation of hBMSCs and used bioinformatics analyses to predict which specific target genes are novel lncRNA targets. The results provided a basis for future studies of the mechanisms underlying the osteogenic differentiation of hBMSCs, and provide a new theoretical basis for the construction of improved bone grafts in tissue engineering.
Materials and methods
Materials
Primary hBMSCs (cat. no. 7500), mesenchymal stem cell basal culture medium, PBS, poly-L-lysine, trypsin neutralization solution, trypsin/EDTA digestion buffer, mesenchymal stem cell osteogenic differentiation medium (MODM) and osteogenic staining solution (2% Alizarin red S staining solution) were purchased from ScienCell Research Laboratories, Inc. (San Diego, CA, USA). The alkaline phosphatase (ALP) staining reagent kit was purchased from Sigma-Aldrich (Merck KGaA, Darmstadt, Germany). TRIzol® was obtained from Life Technologies (Thermo Fisher Scientific, Inc., Waltham, MA, USA). The quantitative polymerase chain reaction (qPCR) reagent kit was supplied by Applied Biosystems (Thermo Fisher Scientific, Inc.).
Recovery and subculture of hBMSCs
Frozen primary hBMSCs obtained from three different individuals were rapidly placed in a 37°C water bath until they were completely thawed. Primary hBMSCs were inoculated onto poly-L-lysine-coated T-75 culture flasks at a density of 5×10³/cm2 and cultured at 37°C and 5% CO2 (v/v) in an incubator. The culture medium was replaced on the following day to remove residual dimethyl sulfoxide and unattached cells. The culture medium was subsequently replaced once every 3 days. When the cells reached 90% confluence, they were digested with an appropriate amount of 0.25% trypsin/0.02% EDTA solution for subculture to the P2 generation.
Osteogenic differentiation of hBMSCs
Poly-L-lysine-coated 6-well plates and T-25 cell culture flasks were prepared and hBMSCs at the P2 generation were added at a density of 1×10⁴/cm2 for RNA extraction. In addition, hBMSCs at the same density were inoculated onto 6-well plates for determination of their osteogenic differentiation ability. The cells were cultured at 37°C and 5% CO2 (v/v) in an incubator. When the cells reached 100% confluence, the culture medium was replaced with MODM; assessment of osteogenic differentiation was performed after 7 days.
Alkaline phosphatase (ALP) staining
Cells prior to osteogenic differentiation (labelled as Day 0) and cells after 7 days of osteogenic differentiation (labelled as Day 7) were subjected to ALP staining, according to the protocols provided with the ALP staining reagent kit (cat. no. 85L3R-1KT; Sigma-Aldrich; Merck KGaA). The culture medium was aspirated from the cells in the Day 0 and Day 7 groups and the cells were washed once with PBS. The cells were fixed in 4% paraformaldehyde at room temperature for 3 min. An appropriate amount of the prepared staining solution was added to the fixed cells and the cells were incubated in the dark for 15–30 min. After 15 min, the cells were observed at 5-min intervals. When satisfactory staining was achieved, the cells were washed once with PBS and the stained cells were observed under a microscope (Motic Deutschland GmbH, Wetzlar, Germany; AE31; magnification, ×40).
Alizarin red staining
The culture medium was aspirated from the cells in the Day 0 and Day 7 groups and the cells were washed once with PBS. The cells were fixed in 4% paraformaldehyde for 30 min (room temperature) and washed three times with PBS. Next, 2% Alizarin red S staining solution was added and the cultures were incubated at 37°C for 30 min. The cells were subsequently washed with PBS and the results were observed under a microscope (Motic AE31; magnification, ×40).
Detection of osteogenesis-specific transcription factors
Total RNA was extracted using TRIzol from the cells in the Day 0 and Day 7 groups. Once the quality of the extracted RNA had been determined to be satisfactory, a PCR system was prepared according to the protocols provided with the qPCR detection reagent kit [one-step reverse transcription (RT)-qPCR]. qPCR reactions were performed with an initial activation step of 95°C for 30 sec, followed by 45 cycles as follows: Denaturation, 95°C for 5 sec; annealing 60°C for 30 sec; extension 72°C for 45 and final extension of 72°C for 5 min. The experiment was repeated three times. GAPDH was used as the internal control. When the qPCR amplification was completed, the Cq values of the target genes and the internal control gene were determined from the real-time fluorescence curves. The differences in the expression levels of the osteogenesis-specific transcription factors [ALP, osteopontin (OPN), osterix and osteocalcin (OCN)] in hBMSCs prior to and following osteogenic differentiation were analyzed using the 2−ΔΔCq method (10). The primer sequences of ALP, OPN, Osterix and OCN are given in Table I (GAPDH was used as the reference gene: Forward, ATGACATCAAGAAGGTGGTG and reverse, CATACCAGGAAATGAGCTTG).
Table I.
Primer sequences used in quantitative polymerase chain reaction validation.
| A, Osteogenesis-specific transcription factors | |
|---|---|
| Primer | Sequence (5′→3′) |
| h-ALP q Forward | AGAATCTGGTGCAGGAATGG |
| h-ALP q Reverse | TCGTATTTCATGTCTCCAGGC |
| h-OPN q Forward | AGGCTGATTCTGGAAGTTCTG |
| h-OPN q Reverse | CTTACTTGGAAGGGTCTGTGG |
| h-Osterix q Forward | CCACCTACCCATCTGACTTTG |
| h-Osterix q Reverse | CCACTATTTCCCACTGCCTT |
| h-OCN q Forward | TGCAGCCTTTGTGTCCAAG |
| h-OCN q Reverse | CCCAGCCATTGATACAGGTAG |
| B, Differentially expressed long non-coding RNAs | |
| Primer | Sequence (5′→3′) |
| h-ENSG00000250049 q Forward | CACCGTCCAGCCACAAACC |
| h-ENSG00000250049 q Reverse | AATCCCTACTGCTGTATGGCATC |
| h-ENSG00000238266 q Forward | TGGAAAGTAAGCCTATTACATATAC |
| h-ENSG00000238266 q Reverse | GGTATCACCAACAACCCTGA |
| h-ENSG00000224750 q Forward | TCAGGAGCTTGAGAACAGCC |
| h-ENSG00000224750 q Reverse | TCACTGAAACCTCTGCTTCCTG |
| h-ENSG00000238042 q Forward | TATGCCACCAGTTCTAAGTAAGG |
| h-ENSG00000238042 q Reverse | ATCTCACCCTGGGAGTCACAC |
| h-lnc_1307 q Forward | AGATTCCAGTGAGATTGAGGGTC |
| h-lnc_1307 q Reverse | TTATCAGAAGGCATAGCACCC |
| h-lnc_1269 q Forward | ATGAAGGGCACGGCATAGGT |
| h-lnc_1269 q Reverse | TGACGCTCGGAAGACAACG |
| h-lnc_554 q Forward | TCTTCAGATGCCTCCTGTGGT |
| h-lnc_554 q Reverse | AACCTGGTTAGACCTTGAGTG |
| h-lnc_1369 q Forward | ACCAGTTACTTTGTGCCATACC |
| h-lnc_1369 q Reverse | TTTCAAGAAAGGATCCAATGG |
| h-lnc_709 q Forward | GAATTAGGAGAAACTGATGTCATAG |
| h-lnc_709 q Reverse | GTTATTGCCCAATTCAGCAGTAC |
| h-lnc_1708 q Forward | AATGGCAGCTACCTATGTCCG |
| h-lnc_1708 q Reverse | AGATCACTCACTTGGATTTGGTG |
| h-lnc_1090 q Forward | AGCCTTTCTTTACCTCATCCC |
| h-lnc_1090 q Reverse | TTTCTGCCGACACTGTTTATC |
| h-lnc_1893 q Forward | GGATGGAGAGGTCTGAGCAGTA |
| h-lnc_1893 q Reverse | AATGGGCTAACCTCCAGAAAG |
| hmGAPDH-q Forward | AGTCCACTGGCGTCTTCACC |
| hmGAPDH-q Reverse | CCAGGGGTGCTAAGCAGTTG |
ALP, alkaline phosphatase; OPN, osteopontin; Osterix and OCN, osteocalcin.
Sequencing and validation of lncRNAs
Total RNA was extracted from the cells using the 1 ml TRIzol and 0.2 ml chloroform. RNA concentrations, 28S/18S values and RNA integrity number were determined using an Agilent 2100 bioanalyzer (Agilent Technologies, Inc., Santa Clara, CA, USA). Once the quality of the total RNA extracted from the cells in the Day 0 and Day 7 groups was determined to be satisfactory, 3 µg total RNA from each sample was used to construct an lncRNA library. The constructed libraries were sequenced in the NextSeq 500 system (Illumina, Inc., San Diego, CA, USA) using the PE150 sequencing protocol. The obtained lncRNA and mRNA data were analyzed for differential gene expression using DEseq (https://bioconductor.org/packages/release/bioc/html/DESeq.html; version V1.31.0). The results for the Day 7 and Day 0 groups were compared and genes with |log2Ratio|≥1 and P<0.05 were determined to be differentially expressed. The numbers of upregulated and downregulated genes were determined. To validate the accuracy of the sequencing results, 12 differentially expressed lncRNAs were subjected to qPCR validation. The primer sequences used are given in Table I. qPCR reactions were performed with an initial activation step of 95°C for 30 sec followed by 45 cycles as follows: Denaturation, 95°C for 5 sec; annealing 60°C for 30 sec; extension 72°C for 45 and final extension of 72°C for 5 min. The 2−ΔΔCq method was used for quantification.
Gene ontology (GO) and KEGG (Kyoto Encyclopedia of Genes and Genomes) biological pathway analyses of differentially expressed mRNAs
GO analysis is based on a public network database constructed by the Gene Ontology Consortium (http://www.geneontology.org/). GO classification of the differentially expressed mRNAs was performed to analyze their functional attributes. The P-values associated with GO term enrichment were obtained using the default algorithm of the GO database and P<0.05 was considered to indicate a statistically significant difference. KEGG analysis is based on a database (https://www.kegg.jp/) that was developed jointly at the University of Tokyo (Japan) and Kyoto University (Japan). It may be used to identify the biological pathways with which differentially expressed mRNAs are associated. The P-values associated with the enrichment of differentially expressed genes in each biological pathway were obtained using the default algorithm in the database; P<0.05 was considered to indicate a statistically significant difference. KEGG analysis was used to identify the biological pathways associated with specific differentially expressed genes.
Construction of the coding-non-coding gene co-expression (CNC) network
Correlation analyses of differentially expressed lncRNAs and mRNAs were performed using Cytoscape bioinformatics software (https://cytoscape.org/download.html; v3.4.0). In addition, a CNC co-expression network of lncRNAs and target genes was constructed based on the results. The Pearson correlation coefficient between lncRNAs and mRNAs was set at ≥0.99.
Statistical analysis
Statistical analyses were performed using SPSS version 13.0 (SPSS, Inc., Chicago, IL, USA). Measurements are expressed as the mean ± standard deviation (repeated three times). Comparisons between two groups were performed using an independent sample t-test, while comparisons among multiple groups were performed using one-way analysis of variance with post hoc Student-Newman-Keuls test. P<0.05 was considered to indicate a statistically significant difference.
Results
Identification of osteogenic differentiation of hBMSCs
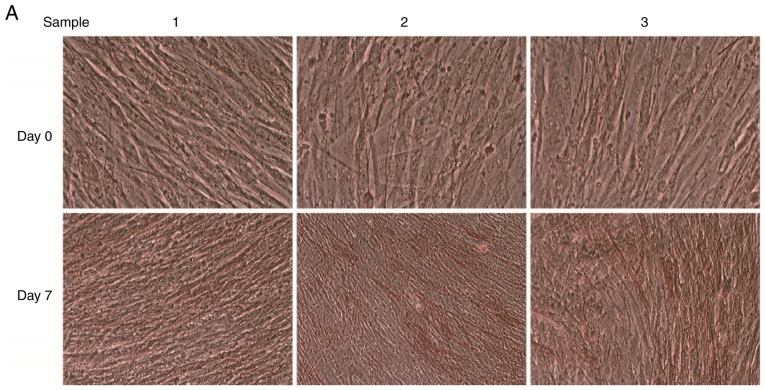
When primary hBMSCs were cultured to the P2 generation, the cultured cells demonstrated uniform growth characteristics and the cells exhibited a long spindle shape. After 7 days of osteogenic induction culture, cell aggregation occurred; at this time, the morphology of the cells became irregular, with the majority of the cells exhibiting a polygonal or cuboidal shape.
ALP is a marker of early osteogenic differentiation and its expression is associated with the differentiation and maturation of osteoblasts. Alizarin red staining was used to detect calcium nodule deposition. An alteration in calcium salts is an important marker of the proliferation and differentiation of bone cells and for the osteogenic potential of bone tissues. ALP, OPN, Osterix and OCN are transcription factors that possess a high specificity to osteoblasts, and are necessary for osteoblast differentiation and bone formation. Therefore, ALP staining, Alizarin red staining and measurements of ALP, OPN, Osterix and OCN expression were used to assess the osteogenic differentiation of hBMSCs (11).
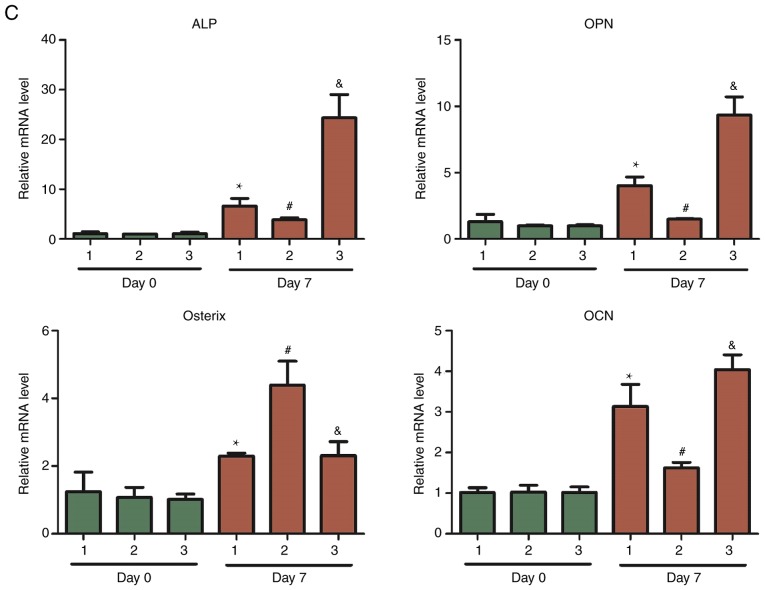
In cells that were stained with ALP after 7 days of osteogenic induction, the cytoplasm appeared red in color, suggesting that the cells were ALP-positive (Fig. 1A). The Alizarin Red staining results demonstrated red calcium salt deposition, indicating positive Alizarin Red staining (Fig. 1B). RNA was extracted from the cells in the Day 0 and Day 7 groups and the expression levels of osteogenesis-specific transcription factors (ALP, OPN, Osterix and OCN) were measured using qPCR. The expression levels of ALP, OPN, Osterix and OCN were significantly higher in the Day 7 group following osteogenic differentiation (P<0.05) compared with cells in the Day 0 group (Fig. 1C). These results were sufficient to confirm that the osteogenic differentiation of these three groups of cells was successful, allowing the subsequent sequencing of differentially expressed lncRNAs prior to and following osteogenic differentiation of hBMSCs to be performed.
Figure 1.
Osteogenic differentiation of hBMSCs. (A) ALP staining (magnification, ×40). (B) Alizarin Red staining (magnification, ×40). (C) Expression levels of the osteogenesis-specific transcription factors ALP, OPN, Osterix and OCN. *P<0.05 vs. Day 0 sample 1; #P<0.05 vs. Day 0 sample 2; &P<0.05 vs. Day 0 sample 3.
Results of high-throughput sequencing of lncRNAs
lncRNAs exhibiting differential expression prior to and following osteogenic differentiation of hBMSCs were screened using lncRNA high-throughput sequencing. The results demonstrated that there were seven differentially expressed known lncRNAs (|log2Ratio|≥1; P<0.05) in the Day 7 group compared with the Day 0 group; of these, two were upregulated and five were downregulated (Table II; Fig. 2). There were 57 differentially expressed unknown lncRNAs in the Day 7 group (|log2Ratio|≥1; P<0.05); of these, 35 were upregulated and 22 were downregulated (Table III; Fig. 3). There were 409 differentially expressed mRNAs in the Day 7 group (|log2Ratio|≥1, P<0.05); of these, 257 were upregulated and 152 were downregulated (Table IV; Fig. 4). To validate the accuracy of the sequencing results, 12 differentially expressed lncRNAs were randomly selected and analyzed using qPCR. The validation results were consistent with the sequencing results (Table V).
Table II.
Known long non-coding RNAs that demonstrated differential expression in the Day 7 and Day 0 groups.
| A, Upregulated | |||
|---|---|---|---|
| Gene | Gene name | Log2 fold change | P-value |
| ENSG00000250049 | RP11-348J24.2 | 2.529276235 | 1.12×10⁻⁵ |
| ENSG00000238266 | LINC00707 | 2.308285071 | 4.64×10⁻⁵ |
| B, Downregulated | |||
| Gene | Gene name | Log2 fold change | P-value |
| ENSG00000280650 | KCNIP4-IT1 | −2.986672708 | 4.06×10⁻⁸ |
| ENSG00000271216 | LINC01050 | −3.129552229 | 8.33×10⁻⁷ |
| ENSG00000232679 | RP11-400N13.3 | −3.052671509 | 6.22×10⁻⁸ |
| ENSG00000238042 | RP11-815M8.1 | −3.088732191 | 1.45×10⁻⁶ |
| ENSG00000224750 | RP11-94M14.2 | −6.630336214 | 7.97×10⁻¹¹ |
Figure 2.
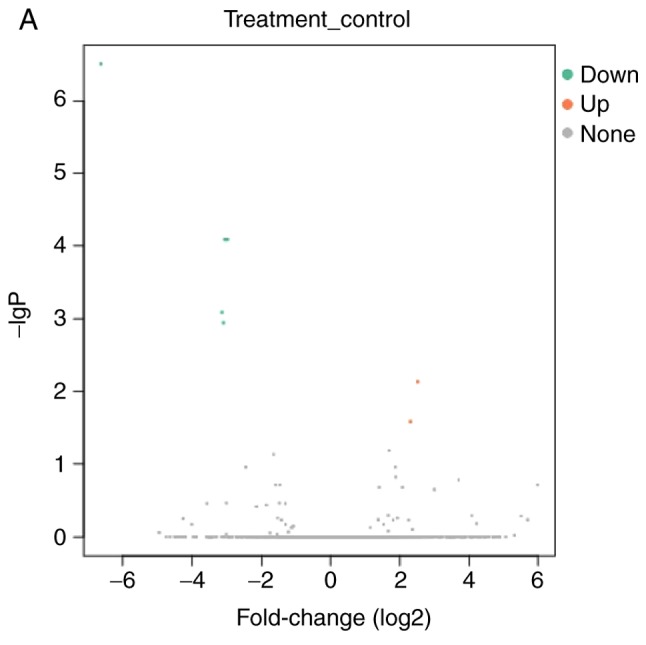
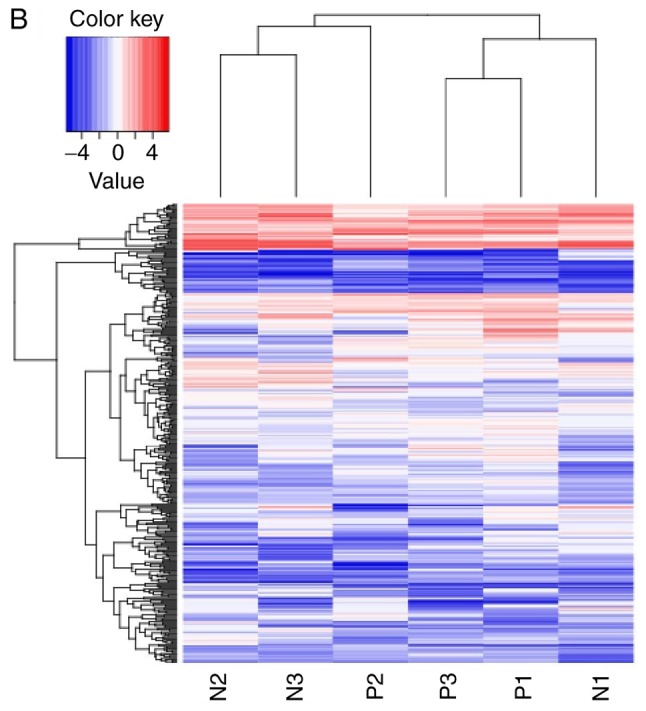
Volcano plot and heat map of differentially expressed known long non-coding RNAs. (A) Volcano plot and (B) Heat map. N, Day 0 groups; P, Day 7 groups.
Table III.
Details of the 10 unknown long non-coding RNAs that exhibited differential expression in the Day 7 and Day 0 groups.
| A, Upregulated | |||
|---|---|---|---|
| Gene | Log2 fold change | P-value | |
| lnc_1307 | Inf | 1.46×10⁻¹⁹ | |
| lnc_1173 | Inf | 4.46×10⁻¹² | |
| lnc_1269 | Inf | 2.09×10⁻¹⁰ | |
| lnc_1323 | Inf | 4.61×10⁻¹⁰ | |
| lnc_554 | Inf | 2.86×10⁻⁹ | |
| B, Downregulated | |||
| Gene | Log2 fold change | P-value | |
| lnc_709 | Nam | 5.40×10⁻¹² | |
| lnc_825 | Nam | 6.45×10⁻¹¹ | |
| lnc_1570 | Nam | 4.24×10⁻¹⁰ | |
| lnc_1708 | Nam | 2.74×10⁻⁹ | |
| lnc_183 | Nam | 1.16×10⁻⁸ | |
‘Inf’ indicates that the expression level in the Day 0 group was 0; compared with the Day 0 group, the expression in the Day 7 group was greatly upregulated. ‘Nam’ indicates that the expression level in the Day 7 group was 0; compared with that in the Day 0 group, the expression in the Day 7 group was greatly downregulated. P-values from low to high were used as the selection criteria.
Figure 3.
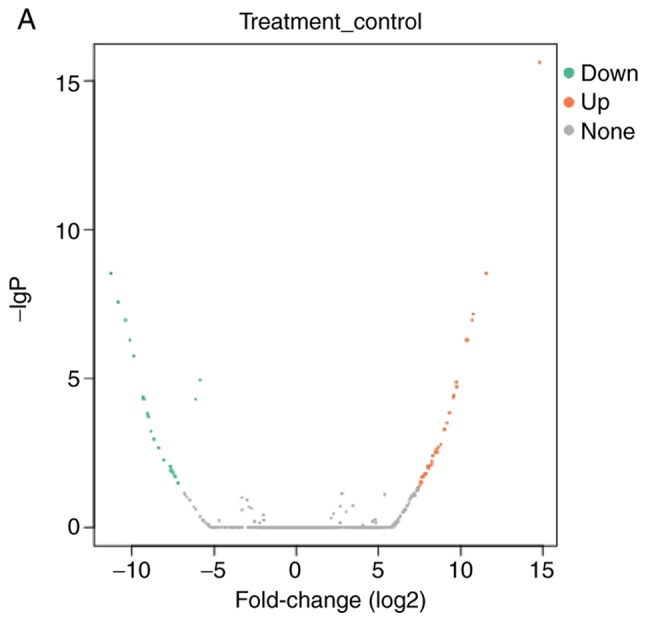
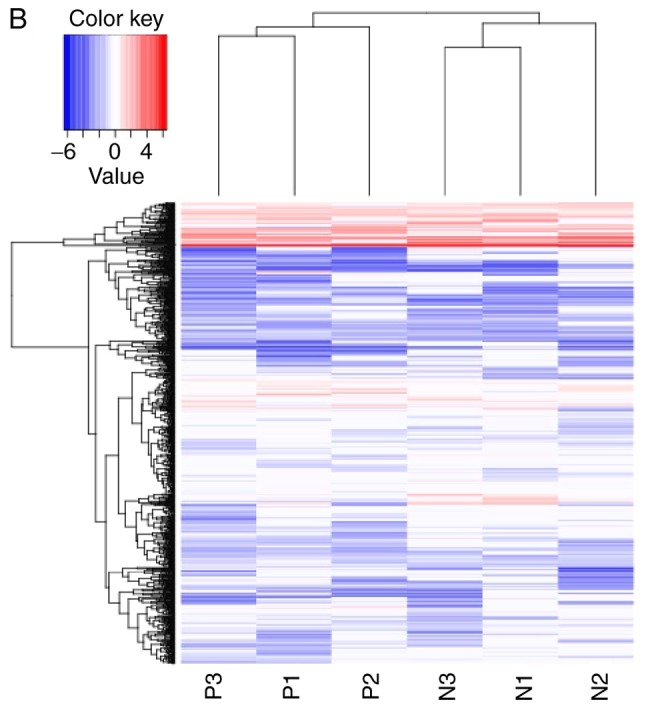
Volcano plot and heat map of differentially expressed unknown long non-coding RNAs. (A) Volcano plot and (B) Heat map. N, Day 0 groups; P, Day 7 groups.
Table IV.
Details of the 10 mRNAs that exhibited differential expression levels in the Day 7 and Day 0 groups.
| A, Upregulated | |||
|---|---|---|---|
| Gene | Gene name | Log2 fold change | P-value |
| ENSG00000278233 | RNA5-8S5 | Inf | 6.06×10−76 |
| ENSG00000173641 | HSPB7 | 2.385567771 | 1.16×10⁻¹⁵ |
| ENSG00000211448 | DIO2 | 2.673293409 | 1.29×10⁻¹³ |
| ENSG00000180914 | OXTR | 2.819903839 | 3.15×10⁻¹³ |
| ENSG00000278637 | HIST1H4A | 3.414824971 | 3.65×10⁻¹³ |
| B, Downregulated | |||
| Gene | Gene name | Log2 fold change | P-value |
| ENSG00000070669 | ASNS | −2.324211247 | 8.79×10⁻¹⁹ |
| ENSG00000101255 | TRIB3 | −3.045732779 | 4.70×10⁻¹⁸ |
| ENSG00000101670 | LIPG | −4.329305637 | 5.84×10⁻¹⁷ |
| ENSG00000151012 | SLC7A11 | −2.303459954 | 1.21×10⁻¹⁵ |
| ENSG00000128965 | CHAC1 | −2.868385986 | 1.51×10⁻¹⁴ |
‘Inf’ indicates the expression level in the Day 0 group was 0; compared with that in the Day 0 group, the expression in the Day 7 group was greatly upregulated. P-values from low to high were used as the selection criteria.
Figure 4.
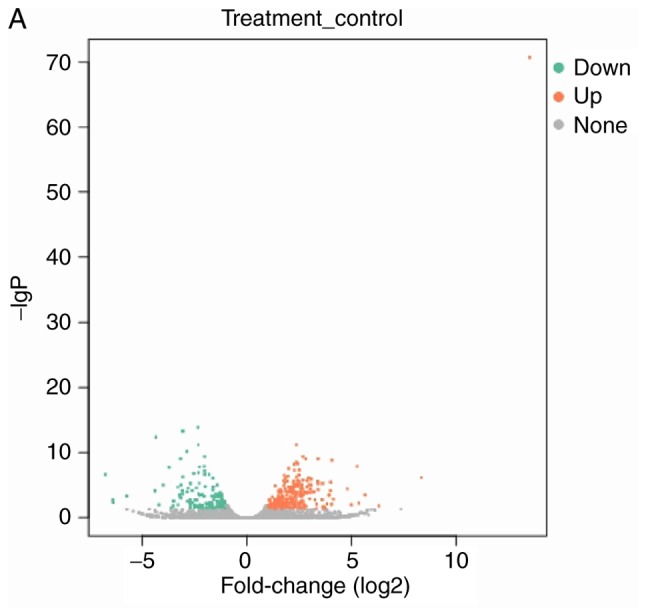
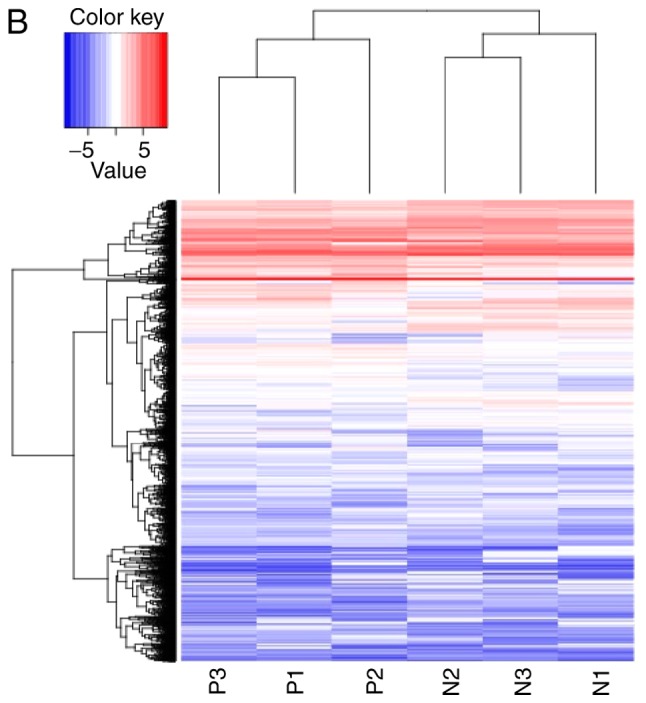
Volcano plot and heat map of differentially expressed mRNAs. (A) Volcano plot and (B) Heat map. N, Day 0 groups; P, Day 7 groups.
Table V.
Comparison of quantitative polymerase chain reaction (qPCR) and sequencing results.
| qPCR results | |||||
|---|---|---|---|---|---|
| Gene | Day 0 | Day 7 | qPCR results Log2 fold change | RNA-seq results Log2 fold change | Up/down |
| lnc_1893 | 1.01±0.162 | 0.04±0.010 | −4.658356 | −6.134612028 | Down |
| lnc_1090 | 1.01±0.141 | 0.31±0.132 | −1.704159 | −5.851519656 | Down |
| lnc_1708 | 1.06±0.362 | 0.15±0.013 | −2.821126 | Nam | Down |
| lnc_709 | 1.05±0.327 | 0.12±0.024 | −3.129103 | Nam | Down |
| lnc_1369 | 1.07±0.405 | 2.70±0.446 | 1.335369 | Inf | Up |
| lnc_554 | 1.15±0.613 | 2.98±0.218 | 1.373676 | Inf | Up |
| lnc_1269 | 1.03±0.233 | 5.03±0.547 | 2.287915 | Inf | Up |
| lnc_1307 | 1.04±0.290 | 31.00±4.245 | 4.897613 | Inf | Up |
| ENSG00000238042 | 1.10±0.475 | 0.12±0.019 | −3.196277 | −3.088732191 | Down |
| ENSG00000250049 | 1.04±0.286 | 2.99±0.852 | 1.523562 | 2.529276235 | Up |
| ENSG00000224750 | 1.04±0.272 | 0.34±0.082 | −1.613079 | −6.630336214 | Down |
| ENSG00000238266 | 1.05±0.304 | 2.93±0.681 | 1.480524 | 2.308285071 | Up |
‘Inf’ indicates that the expression level in Day 0 group was 0; compared with that in the Day 0 group, the expression in the Day 7 group was greatly upregulated. ‘Nam’ indicates that the expression level in the Day 7 group was 0; compared with that in the Day 0 group, the expression in the day 7 group was greatly downregulated. GAPDH was used as the internal control. The results are expressed as the mean ± standard deviation. qPCR, quantitative polymerase chain reaction; RNA-seq, RNA-sequencing.
GO analyses and KEGG biological pathway analyses
GO analyses were performed on the data for mRNAs that demonstrated differential expression during the osteogenic differentiation of hBMSCs. The screening standard was P<0.05 and the enrichment score was the -log(P-value). The enrichment expression profiles of differentially expressed mRNAs in terms of biological process (BP), cellular component (CC) and molecular function (MF) were obtained. In BP, the three highest enrichment scores were observed for the biological processes ‘mitotic cell cycle’, ‘cell cycle’ and ‘cell cycle process’; 85, 107 and 91 differentially expressed genes, respectively, were associated with these processes (Fig. 5A). In CC, the five highest enrichment scores were observed for the cellular components ‘nucleosome’, ‘chromosomal part’, ‘DNA binding complex’, ‘protein-DNA complex’ and ‘chromosome’, associated with 38, 74, 38, 68 and 80 differentially expressed genes, respectively (Fig. 5B). In MF, the molecular function ‘protein binding’ had the highest enrichment score and was associated with 122 differentially expressed genes (Fig. 5C).
Figure 5.
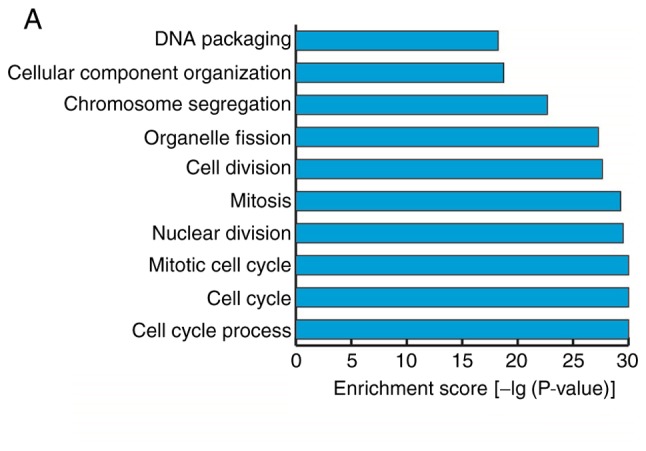
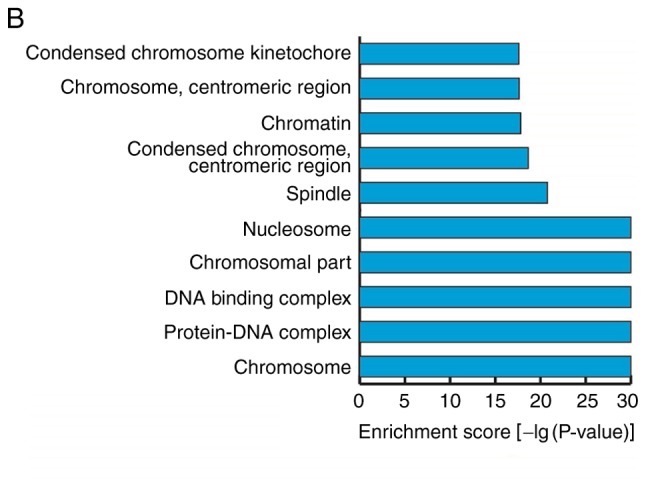
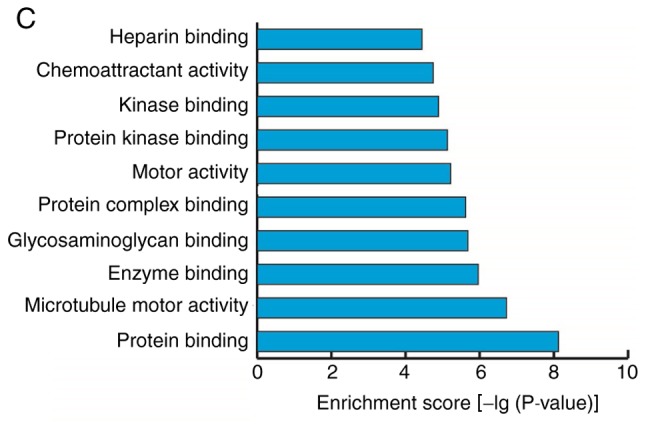
Gene ontology analyses of mRNAs that were differentially expressed prior to and following the osteogenic differentiation of human bone marrow mesenchymal stem cells. (A) Biological processes with the highest enrichment scores among the differentially expressed mRNAs (top 10). (B) Cellular components with the highest enrichment scores among the differentially expressed mRNAs (top 10). (C) Molecular functions with the highest enrichment scores among the differentially expressed mRNAs (top 10).
KEGG analyses of the data for mRNAs that were differentially expressed prior to and following osteogenic differentiation of hBMSCs were performed, using a screening standard of P<0.05. The expression profiles of differentially expressed mRNAs in biological pathways were obtained and the results demonstrated that differentially expressed mRNAs were primarily enriched in 14 biological pathways. The two biological pathways ‘systemic lupus erythematosus’ and ‘alcoholism’ had the highest numbers of associated genes, with 28 differentially expressed genes each (Fig. 6).
Figure 6.
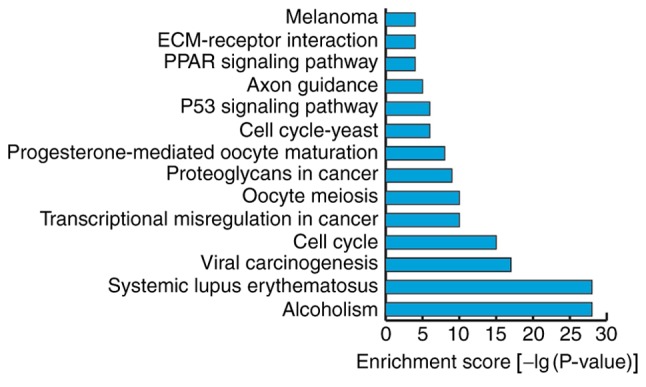
Kyoto Encyclopedia of Genes and Genomes analyses of mRNAs that demonstrated differential expression prior to and following osteogenic differentiation of human bone marrow mesenchymal stem cells.
Co-expression analyses of lncRNAs and mRNAs that demonstrated differential expression prior to and following osteogenic differentiation of hBMSCs
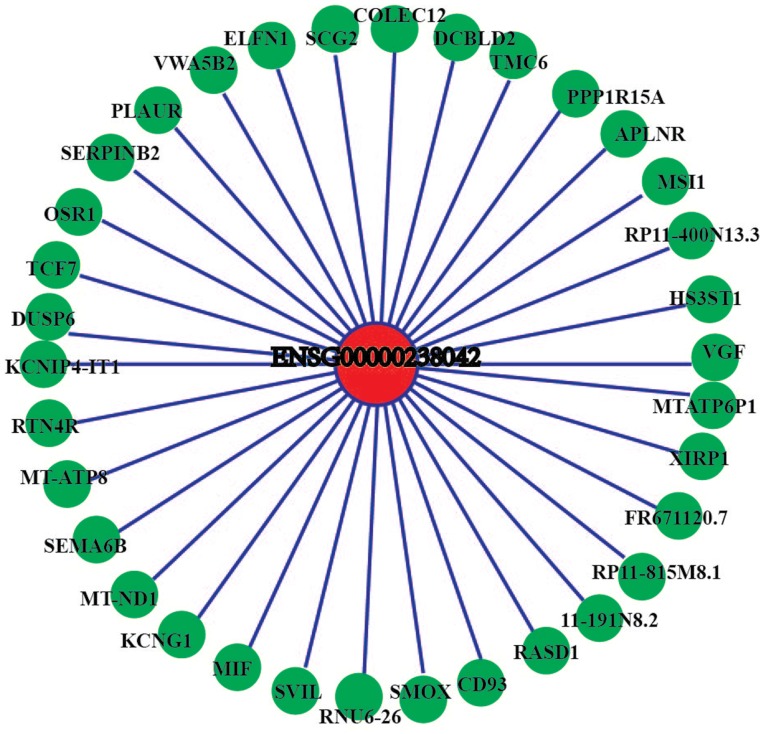
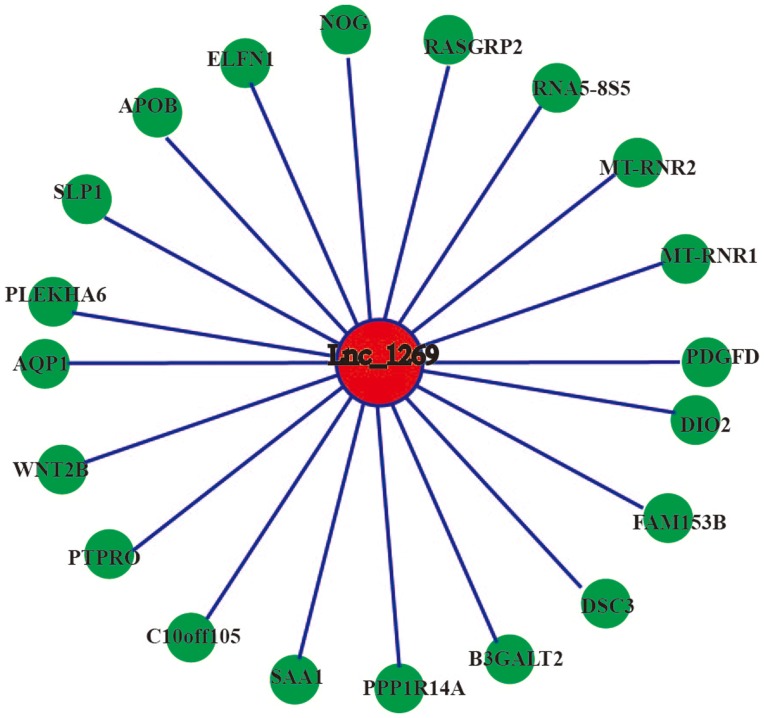
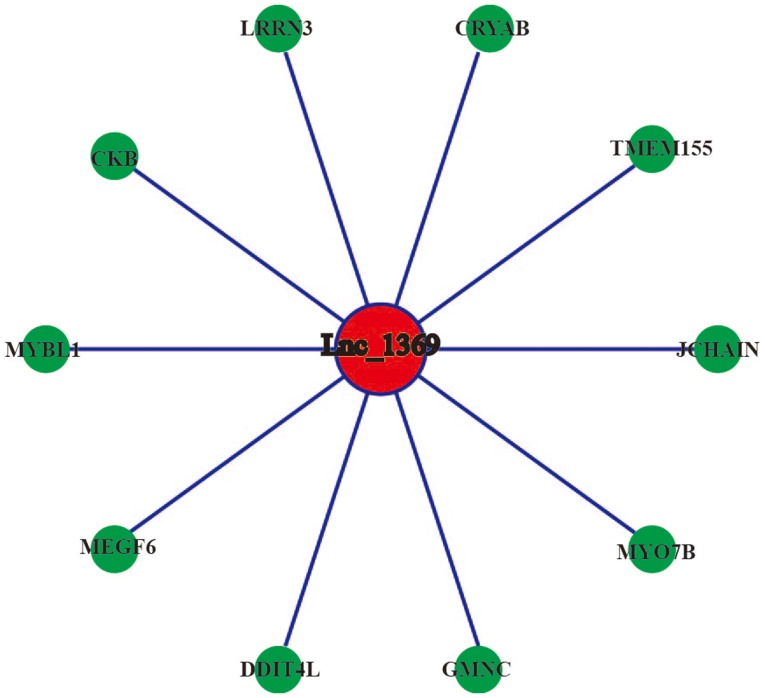
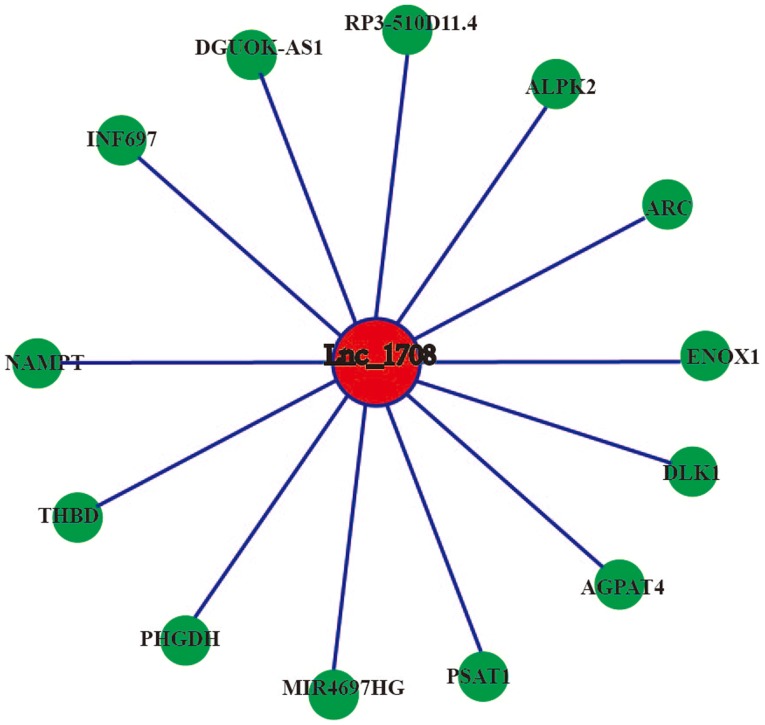
Co-expression networks for 12 differentially expressed lncRNAs were constructed and they demonstrated consistent results between RT-qPCR validation and sequencing detection and differentially expressed mRNAs. The results demonstrated that certain mRNAs in the co-expression networks of 4 lncRNAs (ENSG00000238042, lnc_1269, lnc_1369 and lnc_1708) were associated with osteogenic differentiation. Therefore, 4 differentially expressed lncRNAs that yielded consistent qPCR validation and sequencing results (ENSG00000238042, lnc_1269, lnc_1369 and lnc_1708) were selected for correlation analyses with differentially expressed mRNAs. The threshold value of the correlation coefficient was set at ≥0.9. The results demonstrated that ENSG00000238042 correlated with 34 mRNAs (Fig. 7), lnc_1269 correlated with 20 mRNAs (Fig. 8), lnc_1369 correlated with 10 mRNAs (Fig. 9) and lnc_1708 correlated with 13 mRNAs (Fig. 10).
Figure 7.
Coding-non-coding gene co-expression network of ENSG00000238042. The expression levels of ENSG00000238042 and the co-expressed mRNAs were all downregulated.
Figure 8.
Coding-non-coding gene co-expression network of lnc_1269. The expression levels of lnc_1269 and the co-expressed mRNAs were all upregulated. lnc, long non-coding.
Figure 9.
Coding-non-coding gene co-expression network of lnc_1369. The expression levels of lnc_1369 and the co-expressed mRNAs were all upregulated. lnc, long non-coding.
Figure 10.
Coding-non-coding gene co-expression network of lnc_1708. The expression levels of lnc_1708 and the co-expressed mRNAs were all downregulated. lnc, long non-coding.
Discussion
BMSCs possess pluripotent differentiation potential, and high self-renewal and proliferative ability. BMSCs can not only differentiate into osteoblasts when exposed to specific culture conditions in vitro, but can also differentiate into osteoblasts through attachment to certain substrates in vivo. In bone tissue engineering, BMSCs are considered an important type of seed cell (12). Therefore, studies of the mechanisms underlying the osteogenic differentiation of hBMSCs may facilitate their clinical application in bone tissue engineering.
In an initial study, lncRNAs were considered by-products of transcription and were thought not to possess biological functions (13). However, among the large number of non-coding RNAs transcribed from mammalian chromosomes, >80% were lncRNAs (14). In addition, it has been reported that lncRNAs possess stable secondary structures, exist in a variety of subcellular locations and exhibit strong cell- and tissue-specific expression. These results suggest that lncRNAs are functional (15). With the increasing number of in-depth studies of the role of lncRNAs in the human genome, it has become clear that the complex network regulated by lncRNAs serves an important role in cell and tissue differentiation. For example, Ng et al (16) demonstrated that lncRNAs promote neuronal differentiation following interaction with transcription factors. Sunwoo et al (17) demonstrated that the expression of MENε/β lncRNA is significantly upregulated during muscle differentiation. Cesana et al (18) reported that the lncRNA MD1 functions as a competing endogenous RNA to regulate the muscle differentiation of mouse and human myoblasts. In addition, the study by Kretz et al (19) suggested that the lncRNA TINCR ubiquitin domain containing regulates human epidermal differentiation through a post-transcriptional regulatory mechanism and the study by Kikuchi et al (20) suggested that lncRNAs, including PAPPA antisense RNA 2, may be involved in the differentiation of MSCs into adipocytes.
In recent years, lncRNAs have been reported to serve important roles in the osteogenic differentiation of MSCs. For example, Jia et al (21) demonstrated that silencing of the lncRNA Angelman syndrome chromosome region promotes the osteogenic differentiation of periodontal ligament stem cells through regulation of the WNT signaling pathway. Cao et al (22) demonstrated that high concentrations of glucose prevent the osteogenic differentiation of MSCs by inhibiting the expression of C-X-C motif chemokine ligand 13 via regulation by the lncRNA AK028326. In addition, Li et al (23) reported that the lncRNA maternally expressed 3 may promote the osteogenesis of human adipose-derived MSCs through the regulation of microRNA (miR)-140-5p expression, and Wang et al (24) demonstrated that the lncRNA POIR promotes the osteogenic differentiation of periodontal MSCs through the regulation of miR-182 expression. However, few studies regarding the lncRNAs associated with the osteogenic differentiation of hBMSCs have been reported.
The present study was the first, to the best of our knowledge, to use lncRNA high-throughput sequencing technology to screen known lncRNAs, unknown lncRNAs and mRNAs that exhibit differential expression during the osteogenic differentiation of hBMSCs. To validate the accuracy of the microarray results, 12 differentially expressed lncRNAs, including four known lncRNAs and eight unknown lncRNAs, were selected for RT-qPCR validation. The sequencing results and the RT-qPCR results obtained for these 12 lncRNAs were consistent, indicating that the high-throughput sequencing results were reliable.
Although numerous studies have indicated that lncRNAs do not possess protein coding ability and cannot be translated to produce specific proteins that exert regulatory functions, they are able to regulate the expression of associated protein-coding genes or change their own configuration to perform important regulatory functions. Currently, the regulation of the expression of lncRNAs and mRNAs and the regulatory pathways through which they interact with other cellular components remain unclear. Therefore, bioinformatics technology was used to perform GO and KEGG analyses of differentially expressed mRNAs with the aim of improving the understanding of their biological functions and biological pathways. In addition, co-expression networks of the 12 lncRNAs that were successfully validated using RT-qPCR and the possible associated mRNAs were identified. The results demonstrated that four of these lncRNAs were linked to mRNAs associated with osteogenic differentiation. For example, musashi RNA binding protein 1 (MSI1) belonged to the co-expression network of the lncRNA ENSG00000238042. It has been reported that inhibition of MSI1 expression may activate the hedgehog signaling pathway to inhibit the osteogenic differentiation of human cord blood-derived MSCs (25). The sequencing results of the present study also demonstrated that the expression levels of the lncRNA ENSG00000238042 and of MSI1 were downregulated. Therefore, it is hypothesized that the lncRNA ENSG00000238042 may inhibit the osteogenic differentiation of hBMSCs by regulating the expression of the protein-coding gene MSI1. In addition, serum amyloid A1 (SAA1) belonged to the lnc_1269 co-expression network and it has been demonstrated that hBMSCs that have differentiated into osteoblasts contain large amounts of SAA1 (26). The sequencing results of the present study demonstrated that the expression levels of lnc_1269 and SAA1 were upregulated. Therefore, it was hypothesized that lnc_1269 may promote the osteogenic differentiation of hBMSCs by regulating the expression of the protein-coding gene SAA1. Crystallin αB (CRYAB), which belonged to the lnc_1369 co-expression network, has been reported to be a novel potential osteogenic differentiation marker that is specifically expressed in hBMSCs during osteogenic differentiation (27). The sequencing results of the present study demonstrated that the expression levels of lnc_1369 and CRYAB were upregulated. Therefore, it was hypothesized that lnc_1369 may promote the osteogenic differentiation of hBMSCs by regulating the expression of the protein-coding gene CRYAB. δ-like non canonical Notch ligand 1 (DLK1), which forms part of the lnc_1708 co-expression network, is a novel bone mass regulatory factor that inhibits bone formation and promotes bone resorption (28). The sequencing results demonstrated that the expression levels of lnc_1708 and DLK1 were downregulated. Therefore, it was hypothesized that lnc_1708 may inhibit the osteogenic differentiation of hBMSCs by regulating the expression of the protein-coding gene DLK1. Validation of these hypotheses requires further functional studies.
It is hoped that future studies will perform gain-of-function and loss-of-function studies on the above four lncRNAs and validate their possible target genes to discover lncRNA genes that serve important roles in the osteogenic differentiation of hBMSCs, and to determine the underlying mechanisms of action of these lncRNAs. The present results provide new lncRNA targets for studies of the osteogenic differentiation of hBMSCs, in addition to a novel theoretical basis for the construction of improved bone grafts in tissue engineering.
Acknowledgements
The authors thank Ms. Elizabeth Sung for linguistic assistance during the preparation of this manuscript.
Glossary
Abbreviations
- lncRNAs
long non-coding RNAs
- hBMSCs
human bone marrow mesenchymal stem cells
- qPCR
quantitative polymerase chain reaction
- ALP
alkaline phosphatase
- GO
gene ontology
- KEGG
Kyoto Encyclopedia of Genes and Genomes
- CNC
coding-non-coding gene co-expression
Funding
The present study was supported by the National Natural Science Foundation of China (grant no. 81670950), the Natural Science Foundation of Guangdong Province (grant no. 2015A030313787) and the Stomatological Hospital, Southern Medical University Research Incubation Foundation (grant no. PY2017014).
Availability of data and materials
The datasets used and analyzed during the current study are available from the corresponding author on reasonable request.
Authors' contributions
XS conceived the project, designed the experiments and wrote the manuscript. XS, BJ, X-LQ, H-XC, Z-QZ and Z-PW performed the experiments and controlled the experimental process. BJ collected data and performed the statistical analyses. J-JZ designed the experiments, modified experiment details and revised the manuscript. All authors read and approved the final manuscript.
Ethics approval and consent to participate
Not applicable.
Patient consent for publication
Not applicable.
Competing interests
The authors declare that they have no competing interests.
References
- 1.Kinoshita Y, Maeda H. Recent developments of functional scaffolds for craniomaxillofacial bone tissue engineering applications. ScientificWorldJournal. 2013;2013:863157. doi: 10.1155/2013/863157. [DOI] [PMC free article] [PubMed] [Google Scholar]
- 2.Frith JE, Thomson B, Genever PG. Dynamic three-dimensional culture methods enhance mesenchymal stem cell properties and increase therapeutic potential. Tissue Eng Part C Methods. 2010;16:735–749. doi: 10.1089/ten.tec.2009.0432. [DOI] [PubMed] [Google Scholar]
- 3.Zhong ZN, Zhu SF, Yuan AD, Lu GH, He ZY, Fa ZQ, Li WH. Potential of placenta-derived mesenchymal stem cells as seed cells for bone tissue engineering: Preliminary study of osteoblastic differentiation and immunogenicity. Orthopedics. 2012;35:779–788. doi: 10.3928/01477447-20120822-07. [DOI] [PubMed] [Google Scholar]
- 4.Yan B, Wang Z. Long noncoding RNA: Its physiological and pathological roles. DNA Cell Biol. 2012;31(Suppl 1):S34–S41. doi: 10.1089/dna.2011.1544. [DOI] [PubMed] [Google Scholar]
- 5.Mercer TR, Dinger ME, Mattick JS. Long non-coding RNAs: Insights into functions. Nat Rev Genet. 2009;10:155–159. doi: 10.1038/nrg2521. [DOI] [PubMed] [Google Scholar]
- 6.Luo S, Lu JY, Liu L, Yin Y, Chen C, Han X, Wu B, Xu R, Liu W, Yan P, et al. Divergent lncRNAs regulate gene expression and lineage differentiation in pluripotent cells. Cell Stem Cell. 2016;18:637–652. doi: 10.1016/j.stem.2016.01.024. [DOI] [PubMed] [Google Scholar]
- 7.Takeda K, Ichijo H, Fujii M, Mochida Y, Saitoh M, Nishitoh H, Sampath TK, Miyazono K. Identification of a novel bone morphogenetic protein-responsive gene that may function as a noncoding RNA. J Biol Chem. 1998;273:17079–17085. doi: 10.1074/jbc.273.27.17079. [DOI] [PubMed] [Google Scholar]
- 8.Zhu L, Xu PC. Downregulated LncRNA-ANCR promotes osteoblast differentiation by targeting EZH2 and regulating Runx2 expression. Biochem Biophys Res Commun. 2013;432:612–617. doi: 10.1016/j.bbrc.2013.02.036. [DOI] [PubMed] [Google Scholar]
- 9.Zuo C, Wang Z, Lu H, Dai Z, Liu X, Cui L. Expression profiling of lncRNAs in C3H10T1/2 mesenchymal stem cells undergoing early osteoblast differentiation. Mol Med Rep. 2013;8:463–467. doi: 10.3892/mmr.2013.1540. [DOI] [PubMed] [Google Scholar]
- 10.Su JP, Tan LY, Garland SM, Tabrizi SN, Mokany E, Walker S, Bradshaw CS, Read T, Murray GL. Evaluation of the SpeeDx ResistancePlus MG diagnostic test for mycoplasma genitalium on the applied biosystems 7500 fast quantitative PCR platform. J Clin Microbiol. 2017;56:e01245–17. doi: 10.1128/JCM.01245-17. [DOI] [PMC free article] [PubMed] [Google Scholar]
- 11.Okamoto H, Matsumi Y, Hoshikawa Y, Takubo K, Ryoke K, Shiota G. Involvement of microRNAs in regulation of osteoblastic differentiation in mouse induced pluripotent stem Cells. PLoS One. 2012;7:e43800. doi: 10.1371/journal.pone.0043800. [DOI] [PMC free article] [PubMed] [Google Scholar]
- 12.Panetta NJ, Gupta DM, Quarto N, Longaker MT. Mesenchymal cells for skeletal tissue engineering. Panminerva Med. 2009;51:25–41. [PubMed] [Google Scholar]
- 13.Wang KC, Chang HY. Molecular mechanisms of long noncoding RNAs. Mol Cell. 2011;43:904–914. doi: 10.1016/j.molcel.2011.08.018. [DOI] [PMC free article] [PubMed] [Google Scholar]
- 14.Yang L, Duff MO, Graveley BR, Carmichael GG, Chen LL. Genomewide characterization of non-polyadenylated RNAs. Genome Biol. 2011;12:R16. doi: 10.1186/gb-2011-12-2-r16. [DOI] [PMC free article] [PubMed] [Google Scholar]
- 15.Niazi F, Valadkhan S. Computational analysis of functional long noncoding RNAs reveals lack of peptide-coding capacity and parallels with 3′ UTRs. RNA. 2012;18:825–843. doi: 10.1261/rna.029520.111. [DOI] [PMC free article] [PubMed] [Google Scholar]
- 16.Ng SY, Johnson R, Stanton LW. Human long non-coding RNAs promote pluripotency and neuronal differentiation by association with chromatin modifiers and transcription factors. EMBO J. 2012;31:522–533. doi: 10.1038/emboj.2011.459. [DOI] [PMC free article] [PubMed] [Google Scholar]
- 17.Sunwoo H, Dinger ME, Wilusz JE, Amaral PP, Mattick JS, Spector DL. MEN epsilon/beta nuclear-retained non-coding RNAs are upregulated upon muscle differentiation and are essential components of paraspeckles. Genome Res. 2009;19:347–359. doi: 10.1101/gr.087775.108. [DOI] [PMC free article] [PubMed] [Google Scholar]
- 18.Cesana M, Cacchiarelli D, Legnini I, Santini T, Sthandier O, Chinappi M, Tramontano A, Bozzoni I. A long noncoding RNA controls muscle differentiation by functioning as a competing endogenous RNA. Cell. 2011;147:358–369. doi: 10.1016/j.cell.2011.09.028. [DOI] [PMC free article] [PubMed] [Google Scholar]
- 19.Kretz M, Siprashvili Z, Chu C, Webster DE, Zehnder A, Qu K, Lee CS, Flockhart RJ, Groff AF, Chow J, et al. Control of somatic tissue differentiation by the long non-coding RNA TINCR. Nature. 2013;493:231–235. doi: 10.1038/nature11661. [DOI] [PMC free article] [PubMed] [Google Scholar]
- 20.Kikuchi K, Fukuda M, Ito T, Inoue M, Yokoi T, Chiku S, Mitsuyama T, Asai K, Hirose T, Aizawa Y. Transcripts of unknown function in multiple-signaling pathways involved in human stem cell differentiation. Nucleic Acids Res. 2009;37:4987–5000. doi: 10.1093/nar/gkp426. [DOI] [PMC free article] [PubMed] [Google Scholar]
- 21.Jia Q, Jiang W, Ni L. Downregulated non-coding RNA (lncRNA-ANCR) promotes osteogenic differentiation of periodontal ligament stem cells. Arch Oral Biol. 2015;60:234–241. doi: 10.1016/j.archoralbio.2014.10.007. [DOI] [PubMed] [Google Scholar]
- 22.Cao B, Liu N, Wang W. High glucose prevents osteogenic differentiation of mesenchymal stem cells via lncRNA AK028326/CXCL13 pathway. Biomed Pharmacother. 2016;84:544–551. doi: 10.1016/j.biopha.2016.09.058. [DOI] [PubMed] [Google Scholar]
- 23.Li Z, Jin C, Chen S, Zheng Y, Huang Y, Jia L, Ge W, Zhou Y. Long non-coding RNA MEG3 inhibits adipogenesis and promotes osteogenesis of human adipose-derived mesenchymal stem cells via miR-140-5p. Mol Cell Biochem. 2017;433:51–60. doi: 10.1007/s11010-017-3015-z. [DOI] [PubMed] [Google Scholar]
- 24.Wang L, Wu F, Song Y, Li X, Wu Q, Duan Y, Jin Z. Long noncoding RNA associated with periodontitis interacts with miR-182 to upregulate osteogenic differentiation in periodontal mesenchymal stem cells of periodontitis patients. Cell Death Dis. 2016;7:e2327. doi: 10.1038/cddis.2016.125. [DOI] [PMC free article] [PubMed] [Google Scholar]
- 25.Hong IS, Lee HY, Choi SW, Kim HS, Yu KR, Seo Y, Jung JW, Kang KS. The effects of hedgehog on RNA binding protein Msi1 during the osteogenic differentiation of human cord blood-derived mesenchymal stem cells. Bone. 2013;56:416–425. doi: 10.1016/j.bone.2013.07.016. [DOI] [PubMed] [Google Scholar]
- 26.Kovacevic A, Hammer A, Stadelmeyer E, Windischhofer W, Sundl M, Ray A, Schweighofer N, Friedl G, Windhager R, Sattler W, Malle E. Expression of serum amyloid A transcripts in human bone tissues, differentiated osteoblast-like stem cells and human osteosarcoma cell lines. J Cell Biochem. 2008;103:994–1004. doi: 10.1002/jcb.21472. [DOI] [PMC free article] [PubMed] [Google Scholar]
- 27.Granéli C, Thorfve A, Ruetschi U, Brisby H, Thomsen P, Lindahl A, Karlsson C. Novel markers of osteogenic and adipogenic differentiation of human bone marrow stromal cells identified using a quantitative proteomics approach. Stem Cell Res. 2014;12:153–165. doi: 10.1016/j.scr.2013.09.009. [DOI] [PubMed] [Google Scholar]
- 28.Abdallah BM, Ditzel N, Mahmood A, Isa A, Traustadottir GA, Schilling AF, Ruiz-Hidalgo MJ, Laborda J, Amling M, Kassem M. DLK1 is a novel regulator of bone mass that mediates estrogen deficiency-induced bone loss in mice. J Bone Miner Res. 2011;26:1457–1471. doi: 10.1002/jbmr.346. [DOI] [PubMed] [Google Scholar]
Associated Data
This section collects any data citations, data availability statements, or supplementary materials included in this article.
Data Availability Statement
The datasets used and analyzed during the current study are available from the corresponding author on reasonable request.


