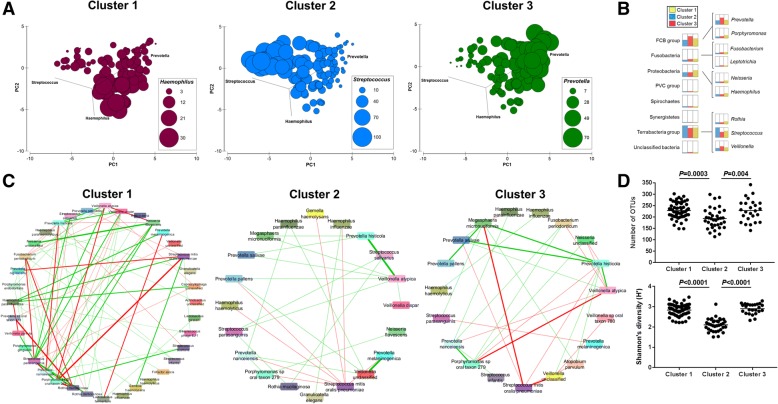
Fig. 2.
Esophageal microbiome community types are defined by diversity and composition. a Principal component analysis of square root-transformed OTU relative abundances. The relative abundances of Haemophilus, Streptococcus, and Prevotella per subject were overlayed onto the PCA to define each cluster. Size of circle corresponds to relative abundance (%) of taxon. All available samples were utilized in this analysis. b Comparison analysis of phylum and genus relative abundances (%) generated from MEGAN6 according to the community types. Cluster 1, yellow; cluster 2, blue; cluster 3, red. Cluster 1 showed an enrichment of Prevotella and Haemophilus, cluster 2 showed an enrichment of Streptococcus, and cluster 3 showed an enrichment of Prevotella and Veillonella. c Correlations across species (shotgun MetaPhlan2) for each community type were calculated using SparCC and correlations greater than 0.2 or lower than − 0.2 were visualized using Cytoscape. Thickness of line reflects the strength of correlation and color reflects direction (green: positive; red: negative). A complete list of SparCC correlations within each cluster is provided in Additional file 1.9. d Alpha diversity measures for each community type. ANOVA with Tukey’s multiple comparison tests were used to calculate P values. Results related to species evenness is provided in Additional file 1.10

