Abstract
Avian arboviral surveillance is an integral part of any diseased based integrated mosquito control program. The Harris County Public Health Mosquito and Vector Control Division has performed arboviral surveillance in the wild birds of Harris County and the City of Houston since 1966. Blood samples from live trapped birds are tested for arboviral antibodies to West Nile Virus (WNV), St. Louis Encephalitis (SLE), Eastern Equine Encephalitis (EEE), and Western Equine Encephalitis (WEE). A dead bird surveillance program was created in 2002 with the arrival of WNV in Harris County. Over the years, there has been considerable variability in viral activity with annual WNV seroprevelance rates ranging from 2.9 to 17.7%, while the percent of positive dead birds has ranged from 0.3 to 57.2%. In 2015, 1,345 live birds were sampled and 253 dead birds were tested, with WNV incidence rates of 16.5 and 5.9%, respectively.
Introduction
The Avian Section of Harris County Public Health (HCPH) Mosquito and Vector Control Division (MVCD) is responsible for monitoring avian populations in Harris County and the City of Houston for West Nile virus (WNV), St. Louis Encephalitis (SLE), and other mosquito-borne diseases. Since birds are the main hosts for many of these viruses, they are included in mosquito surveillance activities to provide a complete picture of the enzootic cycle rather than simply monitoring mosquitoes alone. While infected birds are only viremic for a few days1, surviving birds produce detectible levels of virus specific antibodies for a much longer period, up to several years.2, 3 This persistence allows for a more long-term ‘big picture’ surveillance effort that can identify the presence of a virus in a new area even if no virus is currently circulating.
In 1999, the first sign that WNV had reached the United States was due to large numbers of dead birds, primarily crows, in New York City.4 Subsequently, wildlife and disease ecologists noted continued large die-offs of crows and Blue Jays as the virus spread across the continent.5 Harris County Public Health MVCD created a Dead Bird Hotline (713–440–3036) for residents to report dead birds. The first detection of WNV in the Houston area was from a dead Blue Jay in 2002.
Since WNV has been established in Harris County, avian monitoring helps explain the complex ecological interactions responsible for outbreaks. For humans to be infected, the virus must first amplify in the mosquito-avian transmission cycle. Avian antibodies, like human ones, are important to immune responses and make surviving, seropositive birds essentially resistant to reinfection.6 In standard epidemiological Susceptible – Infected – Removed (SIR) models, large numbers of immune individuals reduce the viral transmission rate below a sustainable level, bringing outbreaks to an end.7 Although more research is needed, there is evidence that some arboviruses, such as WNV and SLE follow multi-year SIR cycles. A 40-year history of SLE seroprevelances in Harris County demonstrated a consistent cyclical pattern (unpublished data) while a multi-year field study in Chicago found that the best predictor of WNV activity in a given year was the proportion of seropositive birds at the end of the previous year.2 Similarly, in Los Angeles, a pre-season seropositive rate of less than 10% was associated with WNV outbreaks.8 This study provides the results from the 2015 MVCD avian surveillance activities.
Collection Methods
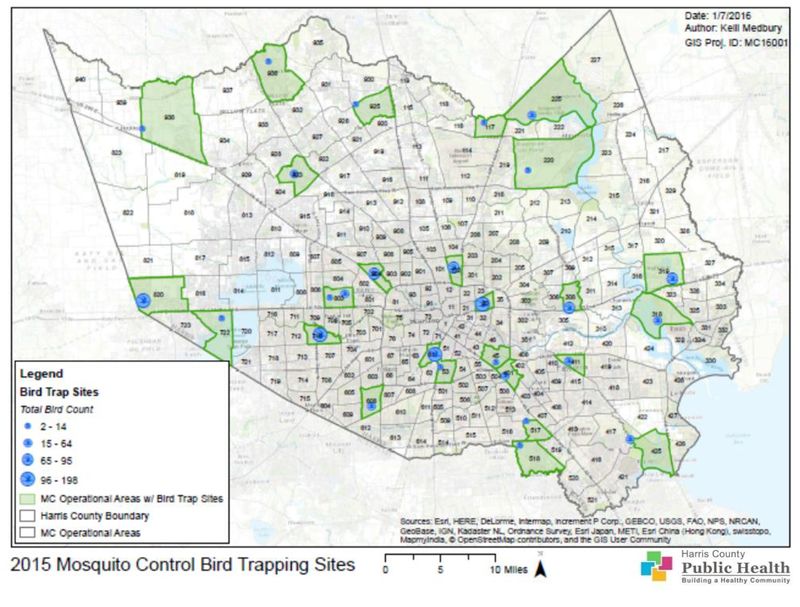
Live bird trapping was conducted daily throughout the year, except when prevented by inclement weather. Trapping locations were located in Houston or Harris County parks and varied on a rotational basis. Sites that were chosen for live bird trapping provided the most uniform coverage available, i.e. included historic and current WNV and SLE “hot spots” and provided a high degree of trapping success. In 2015, 27 sites were trapped, with 20 monitored bi-weekly from June to December when seasonal help was available and on a monthly rotation during the rest of the year (Figure 1).
Figure 1.
Map of Harris County and the City of Houston, TX showing bird trap sites in 2015.
During bird trapping, an average of 3–5 Japanese Mist Nets were set up before sunrise and maintained until 9:30 am. The nets were 2.6 m in height and 6 or 12 m in length, and attached to poles that were hammered into the ground with mallets. Nets were positioned in areas that were expected to attract birds or serve as flyways and baited with commercial bird seed at least one day prior to trapping. Specific characteristics indicating favorable areas included open spaces interspersed with layered vegetation, backyard bird feeders, open trash cans, and picnic tables. Nets were checked at least every 15 minutes with optimum trapping occurring when all nets were observed from one central location. After trapped birds were removed from the mist nets, they were placed in a holding bag, transported to a mobile laboratory station and processed on-site.
During processing, we recorded the bird’s species, sex (if possible), age, and whether or not it was previously banded, as required by the Bird Banding Laboratory. We used the National Geographic Society’s Field Guide to Birds of North America9 along with The Sibley Field Guide to Birds of Eastern North America10 for species identification and Peter Pyle’s Identification Guide to North American Birds11 for ageing, sexing and determining the correct band size. The age of a bird is of particular interest for WNV and SLE surveillance because positive hatch year (HY) birds indicate exposures that occurred within the current season. After we collected all pertinent information, we drew blood from the bird’s jugular vein or brachial vein if it was a dove, because the jugular vein is frequently obscured by engorged skin in doves. We collected either 0.1 cc of blood for smaller, i.e. sparrow-sized birds or 0.2 cc for larger birds, i.e. Blue Jays and added it to a corresponding amount of 0.4 or 0.8 cc diluent of 0.9% normal buffered saline in a 13 × 100 mm glass culture tube. Once blood collection was complete, the bird was banded and released.
The culture tubes were labeled with a unique identifying number and kept in a refrigerated cooler while in the field. Once the diluted blood samples arrived at the MVCD Avian Laboratory, they were placed in a refrigerated (40°C) centrifuge which ran for 15 minutes at 2,500 rpm. The sera were extracted with disposable transfer pipettes into similarly labeled 2 ml cryovials, which were kept frozen until they were transferred to the University of Texas Medical Branch at Galveston (UTMB-G) or the MVCD Virology Laboratory for testing.
Most dead birds were reported to the Dead Bird Hotline, while a smaller number was reported to the HCPH website (https://secure.hcphes.org/MC/DeadBirdReport.html). Residents may also drop off a bird at the MVCD Avian Laboratory. Information collected on all birds included the contact information (name, address, and phone number) of the caller, location and condition of the bird, and time and date the bird was found. If the bird was found within the last 24 hours and appeared reasonably fresh, the caller was instructed to double bag the bird and place it in the freezer or a bag of ice to preserve it until retrieved by a MVCD technician. In years with large numbers of dead bird calls, 18 additional drop off centers located throughout Harris County were activated. Once the bird was collected, it was identified and its condition evaluated. If the carcass was fresh and contained no maggots or ants, it was submitted for WNV/SLE testing and given a unique identifying number.
Testing Procedures
Since 2002, the UTMB-G has been conducting the initial screening of live bird samples and confirmatory testing of dead birds. Sera samples were screened with the Hemagluttination Inhibition (HI) test, which detected the presence of viral antibodies, but could not differentiate between antibody subtypes. Since some subtypes, such as IgG can persist for long periods of time, this test cannot be used to distinguish currently infected birds from those that were infected in previous years. West Nile virus and SLE are also structurally similar, causing HI antigens to cross-react. If the titer levels for one virus were four times or more titers higher than the other, the virus with the higher titer was considered the causative agent.12 If the causative virus was identified, the sample was considered positive solely for the causative virus. Samples in which the causative virus could not be determined were listed as WNV/SLE and analyzed separately.
To determine if the birds were recently infected, the MVCD Virology Laboratory preformed a second test, i.e. the IgM Antibody Capture Method (IgM) on all HI positive samples. This test does not cross react and detects only IgM antibodies which are only produced during the initial stages of infection, and persist for about a month. A limitation of the IgM test is its potential for reacting to a naturally occurring antigen in the blood of some individual birds, resulting in a false positive rate of approximately 10%. Given these limitations, the most definitive results were from combining these tests. For example, a bird that tested both HI and IgM positive was definitely exposed and, most likely, that exposure was within the last month, indicating recent viral activity.
Dead birds were initially screened at the Avian Laboratory with Vector and Rapid Analyte Measurement Platform (RAMP) test kits, both of which can also be used for mosquitoes. The Vector Test is a quick dipstick test that detects SLE and Eastern Equine Encephalitis (EEE) in addition to WNV. While the RAMP test takes longer, it is more accurate and provides quantitative results. For both tests, the bird’s throat was swabbed with a cotton-tipped applicator. For Vector Tests, the applicator was swirled in a 0.6 ml vial containing 600 μl of grinding solution for 10 seconds. A test strip was placed in the vial and left to mature for 15 minutes. Each virus had its own specific detection zone on the test strip. For RAMP testing, a separate applicator was swirled in a 1.5 ml vial containing 1 ml of RAMP buffer solution for 10 seconds. Then, 120 μl of the supernatant was transferred to a smaller 0.6 ml vial where it was mixed with a florescent dye. Finally, 70 μl was transferred to the sample well of the test cartridge and dried for 90 minutes. The dry cartridge was placed into a RAMP Reader which provided a quantitative ratio from < 10 to > 640. Results of 50 or greater were considered positive.
After testing, dead birds were labeled with weather-proof tags, double bagged and placed in an ultra-low (−80°F) freezer until they were transferred to UTMB-G. Information on the tags included date, location, species and Avian Laboratory number. If more than 25 birds were collected during the week, only those that tested positive or species with historically high rates of WNV were transported to UTMB-G for tissue culture and WNV confirmation. During tissue culture a small portion of brain was removed from each dead bird and was homogenized in approximately 2.0 ml of phosphate-buffered saline, pH 7.4, containing 10% fetal bovine serum. After centrifugation at 10,000 rpm for 10 minutes, the supernatant was filtered (0.22 μm); and 200 μL was inoculated into a flask culture of Vero cells. Vero cultures were maintained at 37oC for 14 days and observed daily for viral cytopathic effect (CPE). If CPE was observed, the culture was confirmed as positive for WNV by complement-fixation test or by the Vector Test antigen assay done on the culture medium. Due to funding shortages, an alternative confirmation method consisting of a RAMP result of 100 or greater, corresponding to a UTMB-G confirmation rate of 90%, was implemented by MVCD Avian Laboratory from October 14, 2015 to December 31, 2015.
The capturing and handling of wild birds was done in accordance with the Federal Migratory Bird Treaty Act13 of the United States and requires federal and state permits. This work was conducted under Scientific Collecting Permit MB730179–0 from the U.S. Fish and Wildlife Service, Federal Bird Banding Permit 09415 from the U.S. Geological Survey, and Scientific Research Permit SPR-0816–179 from the Texas Parks and Wildlife Department.
Results
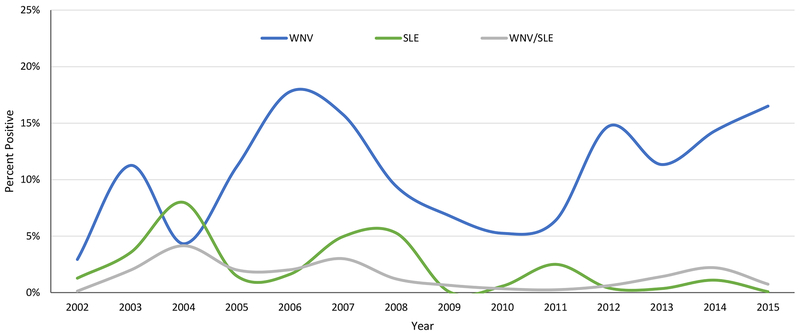
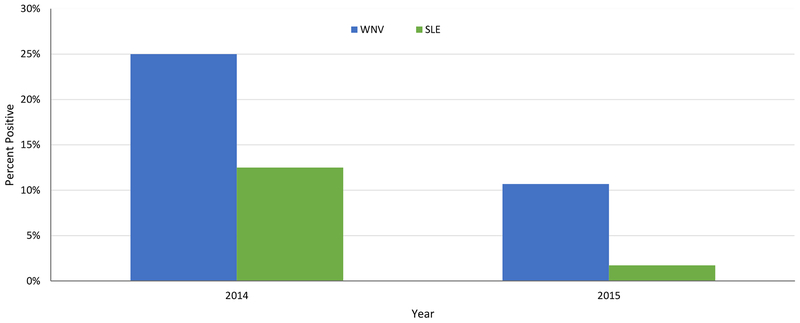
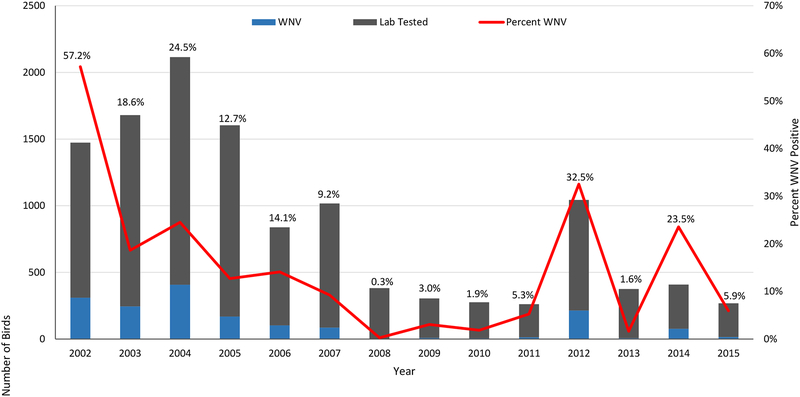
The MVCD Avian technicians collected a total of 1,345 sera samples and received 358 dead bird calls from 40 species of live bird species and 39 species of dead birds in 2015 (Tables 1 and 2). Sera collections increased over 2014, improving upon the 50% increase over the number of samples collected in 2013 and surpassing all previous years since 2009. Of the dead birds called in, 319 (89%) were collected and 253 (79%) were fit for testing. Fifteen dead birds (5.9% of those tested) were confirmed positive for WNV, while 222 (16.5%) sera samples were HI positive for WNV, 2 (0.15%) were HI positive for SLE and 10 (0.7%) were HI positive for either WNV or SLE. Additionally, 2 samples each were HI positive for EEE and Western Equine Encephalitis (WEE). Of the samples that were HI positive, 25 (10.6%) were IgM positive for WNV and 4 (1.6%) IgM positive for SLE. This represented about 1.8% and 0.3% of all samples. The percent of HI positive samples for WNV increased slightly over 2014, maintaining the generally elevated numbers recorded since 2012 (Figure 2), while the percent of IgM positives decreased by half or more (Figure 3). The percentage of positive dead birds also decreased from 2014 (Figure 4).
Table 1.
Number of live bird sera samples collected from Harris County and the City of Houston, TX that tested and HI and IgM positive at the University of Texas Medical Branch, Galveston and the Mosquito and Vector Control Division in 2015.
| COMMON NAME |
SCIENTIFIC NAME |
Sera | HI WNV |
HI SLE |
HI WNV/SLE |
HI EEE |
HI WEE |
IgM WNV |
IgM SLE |
|---|---|---|---|---|---|---|---|---|---|
| House Sparrow | Passer domesticus | 628 | 86 | 1 | 6 | 1 | 0 | 11 | 2 |
| Blue Jay | Cyanocitta cristata | 158 | 46 | 0 | 1 | 0 | 0 | 10 | 2 |
| Northern Cardinal | Cardinalis cardinalis | 117 | 54 | 0 | 1 | 0 | 0 | 2 | 0 |
| Northern Mockingbird | Mimns polyglottos | 66 | 11 | 0 | 0 | 0 | 2 | 2 | 0 |
| Mourning Dove | Zenaida macroura | 63 | 9 | 0 | 0 | 0 | 0 | 0 | 0 |
| Myrtle Warbler | Dendroica coronata | 48 | 0 | 0 | 0 | 0 | 0 | 0 | 0 |
| White-winged Dove | Zenaida asiatica | 37 | 3 | 0 | 1 | 0 | 0 | 0 | 0 |
| Red-winged Blackbird | Agelaius phoenicens | 34 | 0 | 1 | 0 | 0 | 0 | 0 | 0 |
| European Starling | Sturnus vulgaris | 20 | 4 | 0 | 0 | 0 | 0 | 0 | 0 |
| Common Grackle | Quiscalus quiscida | 18 | 0 | 0 | 0 | 0 | 0 | 0 | 0 |
| Great-tailed Grackle | Quiscalus mexicanus | 18 | 2 | 0 | 0 | 0 | 0 | 0 | 0 |
| Savannah Sparrow | Passerculus sandwichensis | 17 | 0 | 0 | 0 | 0 | 0 | 0 | 0 |
| Brown-headed Cowbird | Molothrus ater | 15 | 1 | 0 | 0 | 0 | 0 | 0 | 0 |
| Red-bellied Woodpecker | Melanerpes carolinus | 13 | 1 | 0 | 0 | 0 | 0 | 0 | 0 |
| Chipping Sparrow | Spizella passerina | 12 | 0 | 0 | 0 | 0 | 0 | 0 | 0 |
| American Robin | Turdus migratorius | 11 | 2 | 0 | 0 | 0 | 0 | 0 | 0 |
| Carolina Wren | Thryothorus ludovicianus | 8 | 1 | 0 | 0 | 0 | 0 | 0 | 0 |
| Nutmeg Manakin | Lonchura punctulata | 8 | 0 | 0 | 0 | 0 | 0 | 0 | 0 |
| Tufted Titmouse | Baeolophus bicolor | 7 | 0 | 0 | 0 | 0 | 0 | 0 | 0 |
| House Finch | Carpodacus mexicanus | 5 | 1 | 0 | 0 | 0 | 0 | 0 | 0 |
| White-throated Sparrow | Zonotrichia albicollis | 5 | 0 | 0 | 0 | 0 | 0 | 0 | 0 |
| Hermit Thrush | Catharus guttatus | 4 | 0 | 0 | 0 | 0 | 0 | 0 | 0 |
| Inca Dove | Scardafella inca | 4 | 0 | 0 | 0 | 0 | 0 | 0 | 0 |
| Yellow-bellied Sapsucker | Sphyrapicus varius | 4 | 0 | 0 | 0 | 0 | 0 | 0 | 0 |
| Downy Woodpecker | Picoides pnbescens | 3 | 0 | 0 | 0 | 0 | 0 | 0 | 0 |
| Red-headed Woodpecker | Melanerpes erythrocephalus | 3 | 0 | 0 | 0 | 0 | 0 | 0 | 0 |
| Bronzed Cowbird | Molothrus aeneus | 2 | 0 | 0 | 0 | 0 | 0 | 0 | 0 |
| Brown Thrasher | Toxostoma rufum | 2 | 1 | 0 | 0 | 0 | 0 | 0 | 0 |
| Eurasian Collared Dove | Streptopelia decaocto | 2 | 0 | 0 | 0 | 0 | 0 | 0 | 0 |
| Loggerhead Shrike | Lanius ludovicianus | 2 | 0 | 0 | 0 | 0 | 0 | 0 | 0 |
| Rock Dove | Columba livia | 2 | 0 | 0 | 0 | 0 | 0 | 0 | 0 |
| Carolina Chickadee | Parus carolinensis | 1 | 0 | 0 | 0 | 0 | 0 | 0 | 0 |
| Eastern Bluebird | Sialia sialis | 1 | 0 | 0 | 0 | 0 | 0 | 0 | 0 |
| Eastern Phoebe | Sayornis phoebe | 1 | 0 | 0 | 0 | 0 | 0 | 0 | 0 |
| Gray Catbird | Dumetella carolinensis | 1 | 0 | 0 | 1 | 0 | 0 | 0 | 0 |
| Lincoln’s Sparrow | Melospiza lincolnii | 1 | 0 | 0 | 0 | 0 | 0 | 0 | 0 |
| Orange-crowned Warbler | Vermivora celata | 1 | 0 | 0 | 0 | 0 | 0 | 0 | 0 |
| Purple Martin | Progne subis | 1 | 0 | 0 | 0 | 1 | 0 | 0 | 0 |
| Rose-breasted Grosbeak | Pheucticus ludovicianus | 1 | 0 | 0 | 0 | 0 | 0 | 0 | 0 |
| White-eyed Vireo | Vireo griseus | 1 | 0 | 0 | 0 | 0 | 0 | 0 | 0 |
| Total: | 40 | 1,345 | 222 | 2 | 10 | 2 | 2 | 25 | 4 |
Table 2.
Number of dead birds collected from Harris County and the City of Houston, TX that were tested and confirmed positive at the University of Texas Medical Branch, Galveston and the Mosquito and Vector Control Division in 2015.
| COMMON NAME |
SCIENTIFIC NAME |
Tested | Vector Test Positive |
RAMP Positive |
Confirmed Positive |
Percent Confirmed |
|---|---|---|---|---|---|---|
| White-winged Dove | Zenaida asiatica | 61 | 0 | 0 | 0 | 0.0% |
| Blue Jay | Cyanocitta cristata | 30 | 9 | 9 | 11 | 36.7% |
| European Starling | Sturnus vulgaris | 22 | 0 | 1 | 0 | 0.0% |
| Blue-winged Teal | Anas discors | 19 | 0 | 0 | 0 | 0.0% |
| House Sparrow | Passer domesticus | 18 | 0 | 0 | 0 | 0.0% |
| Great-tailed Grackle | Quiscalus mexicanus | 17 | 1 | 1 | 1* | 5.9% |
| Mourning Dove | Zenaida macroura | 14 | 0 | 0 | 0 | 0.0% |
| Northern Mockingbird | Mimus polyglottos | 8 | 0 | 1 | 1 | 12.5% |
| American Robin | Turdus migratorius | 7 | 1 | 0 | 0 | 0.0% |
| Cedar Waxwing | Bombycilla cedrorwn | 6 | 0 | 0 | 0 | 0.0% |
| Common Grackle | Quiscalus quiscula | 6 | 0 | 0 | 0 | 0.0% |
| Rock Dove | Columba livia | 4 | 0 | 0 | 0 | 0.0% |
| Yellow-crowned Night-heron | Nycticorax violacea | 4 | 0 | 1 | 0 | 0.0% |
| Cooper’s Hawk | Accipter cooperii | 3 | 0 | 0 | 1 | 33.3% |
| Eastern Screech-owl | Otus asio | 3 | 0 | 0 | 0 | 0.0% |
| Northern Cardinal | Cardinalis cardinalis | 3 | 0 | 1 | 1 | 33.3% |
| Brown-headed Cowbird | Molothrus ater | 2 | 0 | 1 | 0 | 0.0% |
| Carolina Wren | Thryothorus ludovicianus | 2 | 0 | 0 | 0 | 0.0% |
| Eurasian Collared Dove | Streptopelia decaocto | 2 | 0 | 0 | 0 | 0.0% |
| Hermit Thrush | Catharus guttatus | 2 | 0 | 0 | 0 | 0.0% |
| Purple Martin | Progne subis | 2 | 0 | 0 | 0 | 0.0% |
| American Coot | Fulica americana | 1 | 0 | 0 | 0 | 0.0% |
| American Crow | C.orvus brachyrhynchos | 1 | 0 | 0 | 0 | 0.0% |
| Baltimore Oriole | Icterus galbula galbula | 1 | 0 | 0 | 0 | 0.0% |
| Brown Pelican | Pelecanus occidentalis | 1 | 0 | 0 | 0 | 0.0% |
| Chipping Sparrow | Spizella passerina | 1 | 0 | 0 | 0 | 0.0% |
| Laughing Gull | Larus atricilla | 1 | 0 | 0 | 0 | 0.0% |
| Lesser Snow Goose | Chen caerulescens | 1 | 0 | 0 | 0 | 0.0% |
| Mallard | Anus platyrynchos | 1 | 0 | 0 | 0 | 0.0% |
| Myrtle Warbler | Dendroica coronata | 1 | 0 | 0 | 0 | 0.0% |
| Orange-crowned Warbler | Vermivora celata | 1 | 0 | 0 | 0 | 0.0% |
| Ovenbird | Seiurus aurocapillus | 1 | 0 | 0 | 0 | 0.0% |
| Red-eyed Vireo | Vireo olivaceus | 1 | 0 | 0 | 0 | 0.0% |
| Red-winged Blackbird | Agelaius phoeniceus | 1 | 0 | 0 | 0 | 0.0% |
| Sora | Porzana Carolina | 1 | 0 | 0 | 0 | 0.0% |
| Tennessee Warbler | Vermivora peregrin a | 1 | 0 | 0 | 0 | 0.0% |
| Veery | Catharus fuscescens | 1 | 0 | 0 | 0 | 0.0% |
| White-faced Ibis | Plegadis chihi | 1 | 0 | 0 | 0 | 0.0% |
| Yellow-breasted Chat | Icteria virens | 1 | 0 | 0 | 0 | 0.0% |
| Total: | 39 | 253 | 11 | 14 | 15 | 5.9% |
Includes bird confirmed in MVCD Avian Laboratory
Figure 2.
Percent of live bird sera samples collected from Harris County and the City of Houston that tested HI positive for WNV, SLE and WNV/SLE since 2002.
Figure 3.
Percent of live bird seropositive samples collected from Harris County and the City of Houston, TX that tested IgM positive for WNV and SLE in 2014 and 2015.
Figure 4.
Number and percent of dead birds collected from Harris County and the City of Houston, TX that were tested and confirmed WNV positive since 2002.
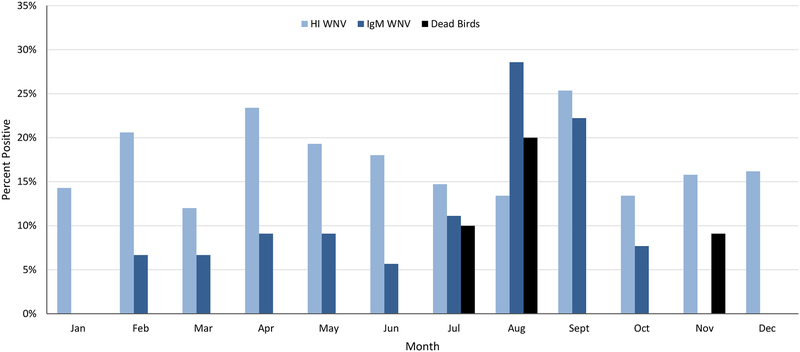
The percent of WNV positives fluctuated throughout the year (Figure 5). The period of greatest activity was from July to September, 2015. There were no IgM positive samples in January. Between 5 and 9% of samples were IgM positive from February to June, 2015. This increased to 11% in July before peaking in August at 28%. The first positive dead bird was found on July 2, 2015. More followed, with all other positive dead birds, with one exception, occurring in July and August. The percentage of HI WNV positives peaked in September at 25%. The IgM WNV positives also remained high in September, at above 20% before falling back to below 10% in October. There were no IgM positives in November and December. The last positive dead bird was found on November 6, 2015. The percentage of HI WNV positive samples was the only metric to remain elevated during the winter months, remaining at around 15% for January, November and December 2015. This is not surprising given the persistence of WNV antibodies and the high levels of WNV activity in 2012 and 2014.
Figure 5.
Monthly WNV activity in live and dead birds collected from Harris County and the City of Houston, TX in 2015
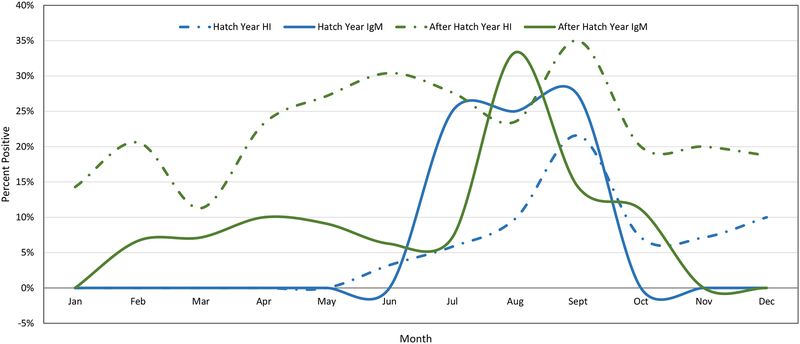
Both HI and IgM results for WNV differed by age. After-hatch year birds had a HI seropositive rate more than double that of hatch year birds, while hatch year birds that were HI positive for WNV were twice as likely to be IgM positive (Table 3). This is consistent with after-hatch year birds maintaining protective immunity after being exposed to WNV within the previous 2–3 years. When disease prevalence in hatch year and after-hatch year birds was plotted by month, the differences were more pronounced (Figure 6). After-hatch year birds accounted for the majority of all positives until July, when hatch year IgM prevalence increased dramatically. After-hatch year IgM rates did not undergo a similar increase until August. Hatch year HI rates were generally low, peaking at 21.5% in September, about 15% less than after-hatch year HI rates for the same month. There were no hatch year birds in January and February and low sample sizes prevented the analysis of hatch year seropositive rates in March and April, which had one HI positive each.
Table 3.
Number and percent of live birds collected in Harris County and the City of Houston, TX that tested HI and IgM positive in 2015.
| 2015 | Total Sera |
HI WNV |
HI SLE |
HI WNV/SLE |
HI EEE |
HI WEE |
IgM WNV+ |
IgM SLE+ |
|---|---|---|---|---|---|---|---|---|
| All Birds | 1,345 | 222 (16.5%) |
2 (0.1%) |
10 (0.7%) |
2 (0.1%) |
2 (0.1%) |
25 (10.7%) |
4 (1.7%) |
| Age: | ||||||||
|
After Hatch Year |
777 | 177 (22.8%) |
1 (0.1%) |
7 (0.9%) |
1 (0.1%) |
0 (0.0%) |
16 (8.7%) |
3 (1.6%) |
|
Hatch Year |
568 | 45 (7.9%) |
1 (0.2%) |
3 (0.5%) |
1 (0.2%) |
2 (0.3%) |
9 (18.3%) |
1 (2.0%) |
| Sex: | ||||||||
| Male | 395 | 91 (23.0%) |
1 (0.2%) |
3 (0.7%) |
0 (0.0%) |
0 (0.0%) |
7 (7.3%) |
0 (0%) |
| Female | 234 | 42 (17.8%) |
1 (0.4%) |
2 (0.8%) |
1 (0.4%) |
0 (0.0%) |
0 (0.0%) |
1 (2.2%) |
| Unknown | 716 | 89 (12.4%) |
0 (0.0%) |
5 (0.7%) |
1 (0.1%) |
2 (0.2%) |
18 (19.3%) |
3 (3.2%) |
Figure 6.
Monthly WNV activity in live hatch year and after-hatch year birds collected from Harris County and the City of Houston, TX in 2015.
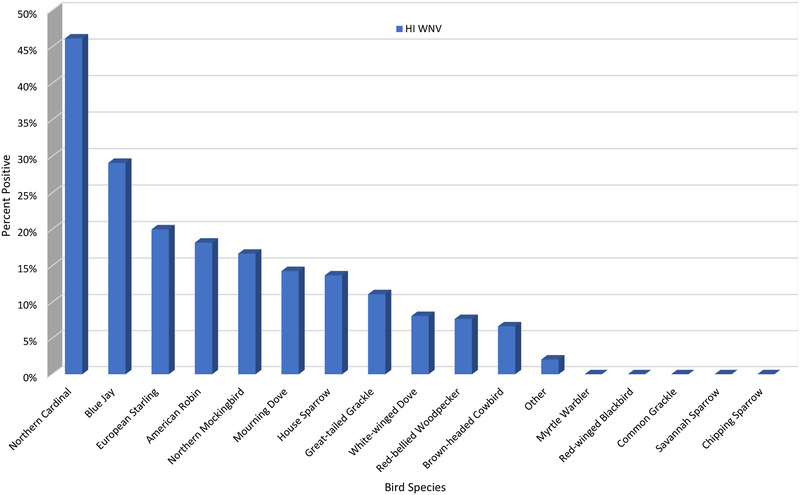
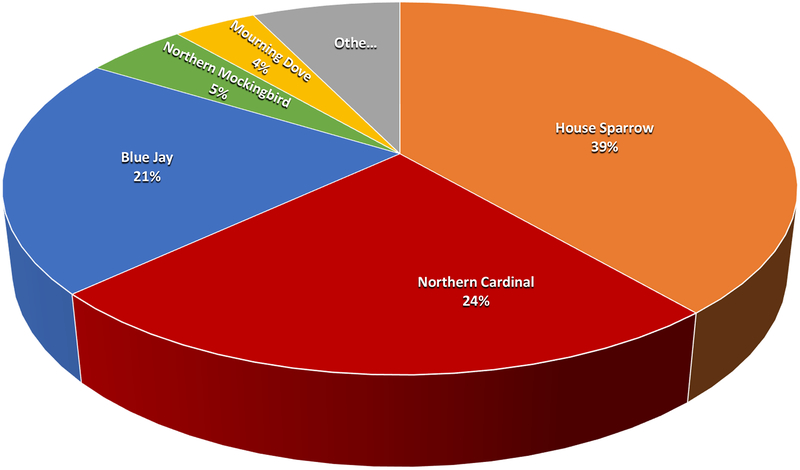
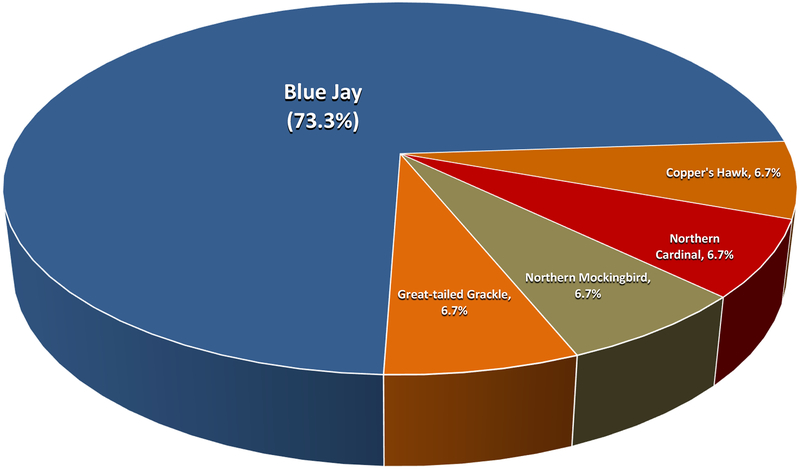
Each species had a seropositive rate markedly different from the average. Northern Cardinals had the highest HI incidence rate of 46.1%, followed by Blue Jays at 29.1% (Figure 7). Of the HI positive samples, the majority were from House Sparrows (39%), Northern Cardinals (24%), and Blue Jays (21%) (Figure 8). The highest IgM incidence rates were in Blue Jays (21.3%), Mockingbirds (18.2%), and House Sparrows (11.8%), while Blue Jays and House Sparrows comprised the bulk of the IgM positive samples (84.0%). No HI or IgM positives were found in Myrtle Warblers, Red-Winged Blackbirds, Common Grackles, and Savanah Sparrows. Myrtle Warblers and Savanah Sparrows are migratory birds that only reside in the Houston area during the winter months. House Sparrows were by far the most frequently tested species, caught 4 times as much as Blue Jays, the next most commonly caught species, and comprised 46.7% of all samples tested. The next four most commonly tested species were Blue Jays, Northern Cardinals, Northern Mockingbirds, and Mourning Doves, comprising 30.0% of all samples tested. Dead Blue Jays were also positive frequently, accounting for 73.3% of positive dead birds. All other dead positive bird species (Cooper’s Hawk, Northern Cardinal, Northern Mockingbird, and Great-tailed Grackle) had one positive sample each (Figure 9).
Figure 7.
Percent of live bird sera samples collected from Harris County and the City of Houston, TX that tested HI WNV in 2015.
Figure 8.
Species distribution of HI positive live bird samples collected from Harris County and the City of Houston, TX in 2015
Figure 9.
Species distribution of confirmed WNV dead birds collected from Harris County and the City of Houston, TX in 2015.
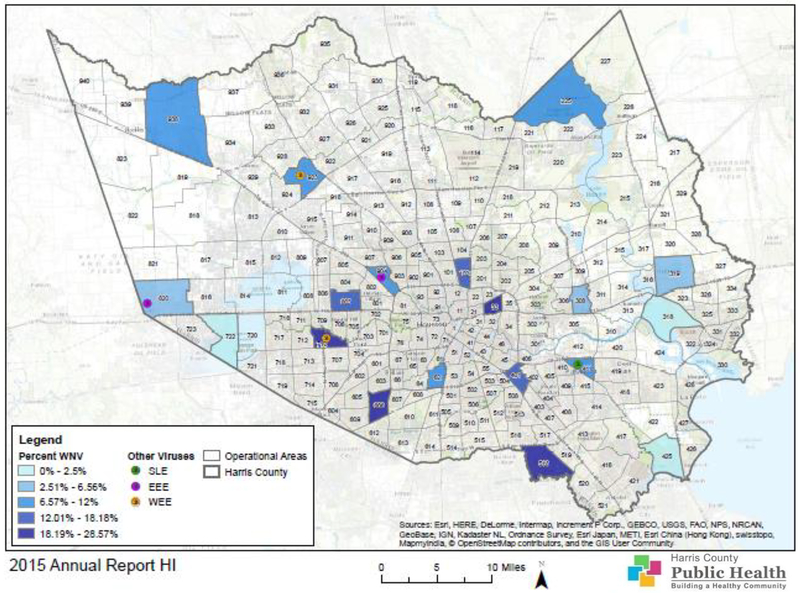
Positives were not uniformly distributed across Harris County. Parts of the Harris County that had high prevalence rates were the Spring-Cypress area in the northwest, Kingwood in the north, and western Houston. Figure 10 shows the distribution of HI positive results within Harris County for all viruses in 2015. The prevalence rate for WNV ranged from 0.0 to 28.6% and areas with the highest percentages were in the center and southern part of Harris County. Only six samples tested positive for SLE, EEE, and WEE. Areas 411 and 425 tested positive for SLE, while EEE was detected in areas 820 and 904, and WEE was detected in 710 and 923, which was the first time WEE was redetected since 2011.
Figure 10.
Map of Harris County and the City of Houston, Texas, showing the geographical distribution of HI test results for WNV, SLE, EEE, and WEE in 2015.
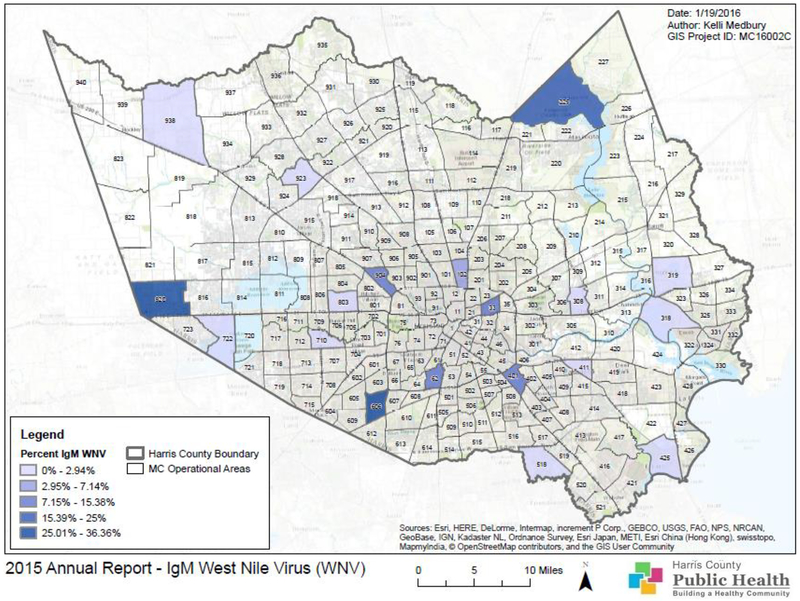
Figure 11 shows the distribution of IgM results for WNV in Harris County. The percent of IgM positive samples is the percent of HI samples testing IgM positive and indicates the proportion of HI positives in each area that is due to a recent infection. The percent of IgM positives in each area ranged from 0.0 to 36.4%. The areas with the highest percent of IgM positives were 820, 225 and 606. Area 606 was the only one that had a high percentage of both IgM and HI positives.
Figure 11.
Map of Harris County and the City of Houston, TX showing the geographical distribution of IgM test results for WNV in 2015.
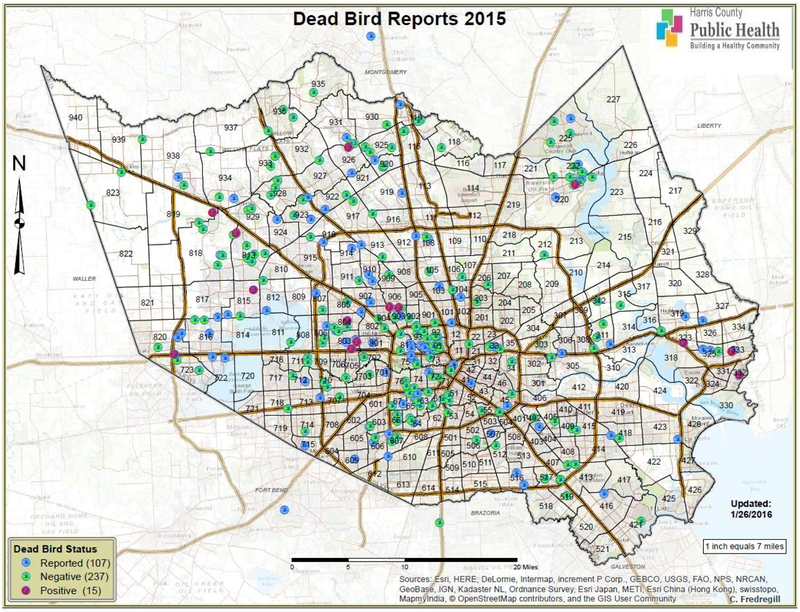
Most dead birds were reported from the western loop and northwestern Harris County, near the towns of Spring and Cypress (Figure 12). Positive birds were clustered in Baytown and near the intersection of highways 610 and 290. Five more birds were confirmed from outlying areas northwest of the Sam Houston Beltway and one from the town of Humble.
Figure 12.
Map of Harris County and the City of Houston, TX showing the geographic distribution of dead birds reported, tested, and confirmed WNV positive in 2015.
Comparisons to Previous Years
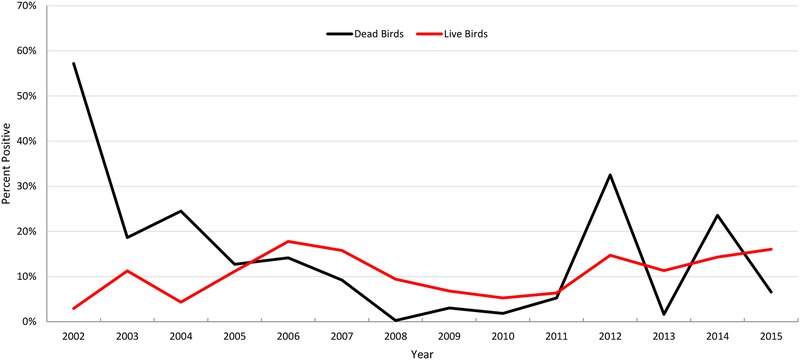
In 2015, the percent of positive confirmed dead birds was low, while the percent of HI WNV positive live birds was high, relative to their historical occurrences (Figure 13). This could be explained by the high prevalence of antibodies in the avian population providing protective immunity against WNV resulting in the avian low death rate, which is reasonably well supported with the historical data. However, high antibody levels did not prevent a high death rate in 2014.
Figure 13.
Percent of dead birds confirmed positive and live birds that tested HI positive for WNV from Harris County and the City of Houston, TX since 2002.
In 2002 and 2003 when WNV was first detected, birds were particularly susceptible, as none had been previously exposed. Although SLE antibodies provide some protection against WNV,6 they were at a historically low rate of 1.9% (unpublished data). Mortality was high, particularly for American Crows (68.4%) and Blue Jays (66.9%). It took 4 years for antibody levels to peak in 2006 at 17.7%, double the highest annual SLE rate from 1975–2001 of 8.4%. From 2006 to 2011, the mortality and seroprevalence rates decreased, until antibody levels reached 5–6% (Figure 13). In 2012, there was a sudden resurgence in WNV activity, with mortality rates reaching 2003–2004 levels. Antibody levels jumped to 14.7% and remained high throughout 2015. Recent mortality rates were inconsistent, 1.6% in 2013 and 23.5% in 2014.
Program Expansion
The objectives were to expand and improve the Avian Surveillance Program in 2016. Trapping sites were continually evaluated and subjected to change if catch rates decreased. Scouting for new trapping locations, particularly in areas of high virus activity or low current coverage were conducted as time permitted. Testing was expanded to include Highlands J Virus (HJV), an alphavirus in the WEE complex. Although HJV is not thought to cause illness in humans it can react with antigens for WEE in a manner similar to WNV and SLE. Testing for both will allow for definitive identifications of WEE. Five sera samples have already tested HI positive for HJV in 2016.
Testing for non-arboviral viruses, such as Newcastle disease virus (NDV) and highly pathogenic avian influenza (HPAI) can also be considered. The UTMB-G has frequently recovered NDV, which is classified as a select agent by the United States Department of Agriculture in pigeons and doves collected in Harris County and the City of Houston.14 Although HPAI is not a vector-borne disease, it is a high-profile, economically devastating and potentially life-threatening disease that uses avian species as the main host. In 2015, an HPAI outbreak occurred in at least 15 states (3 declaring state of emergency) resulting in the destruction of 49.5 million birds and at least $500 million spent in emergency funds.15, 16, 17 The HPAI was also found in wild birds in Kansas and Missouri,18 states that are part of the same migratory flyway that includes important wintering grounds in the Houston area. The HPAI may persist in wild birds and resurface from time to time in the United States as it has in Asia. Indeed, the 2015 outbreak was linked to incidences in British Columbia and the Pacific Northwest in 2014.19 Another incidence was confirmed on January 15, 2016 in Indiana where 43,000 birds were destroyed as part of the containment effort.20
We plan to test for avian flu in 2017. Test kits are available from several commercial manufactures for use by veterinarians. Further testing by UTMB-G will be needed to confirm any positive samples as highly pathogenic.
Conclusion
Avian Surveillance is an integral part of diseased-based integrated mosquito and vector management programs. Overall, 2015 had an average level of Avian WNV activity, and low levels of EEE and SLE in Harris County and the City of Houston. However, WEE was last detected in 2011. Most infections were in residential birds. If viral activity conforms to SIR models, we should be entering a low point in the WNV cycle. Initial results showed WNV activity was low in 2016, with only one confirmed dead bird. Low levels of viral activity will eventually diminish avian arboviral protection, inviting another outbreak. Continued surveillance is needed to determine when this will likely occur.
Contributor Information
Lauren Wilkerson, Avian Biologist with the Mosquito and Vector Control Division, Harris County Public Health, Houston, Texas..
Martin Reyna, Medical Entomologist and the Technical Operations Manager of the Mosquito and Vector Control Division, Harris County Public Health, Houston, Texas..
Cheryl Freeman, Virologist with the Mosquito and Vector Control Division, Harris County Public Health, Houston, Texas..
Amelia Travassos da Rosa, Virologist at the Department of Pathology, University of Texas Medical Branch, Galveston, Texas 77555-0609..
Hilda Guzman, Virologist at the Department of Pathology, University of Texas Medical Branch, Galveston, Texas 77555-0609..
Robert Tesh, Professor at the Department of Pathology, University of Texas Medical Branch, Galveston, Texas 77555-0609..
Mustapha Debboun, Director of the Mosquito and Vector Control Division, Harris County Public Health, Houston, Texas..
References:
- 1).Rappole JH and Hubalek Z. 2003. Migratory birds and West Nile virus. Journal of Applied Microbiology 94: 47s–58s. [DOI] [PubMed] [Google Scholar]
- 2).McKee EM 2012. West Nile Seroreversion and the Influence of Herd Immunity on Disease Risk in a Long-term Study of Free-ranging Birds. Student Theses, Governors State University. Paper 9. [Google Scholar]
- 3).Nemeth NM, Oesterle PT and Bowen RA. 2009. Humoral Immunity to West Nile Virus is Long-Lasting and Protective in the House Sparrow (Passer domesticus). American Journal of Tropical Medicine and Hygiene 80(5): 864–869. [PMC free article] [PubMed] [Google Scholar]
- 4).Nash D, Mostashari F, Fine A, Miller J, O’Leary D, Murray K, Huang A, Rosenberg A, Greenberg A, Sherman M, Wong S, and Layton M. 2001. The outbreak of West Nile Virus Infection in the New York City Area in 1999. The New England Journal of Medicine 344:1807–1814. [DOI] [PubMed] [Google Scholar]
- 5).Koenig WD, Hochachka WM, Zuckerberg B and Dickinson JL. 2010. Ecological determinants of American crow mortality due to West Nile virus during its North American sweep. Oecologia 163:903–909. [DOI] [PubMed] [Google Scholar]
- 6).Fang Y and Reisen WK. 2006. Previous infection with West Nile or St. Louis Encephalitis viruses provides cross protection during reinfection in House Finches. American journal of Tropical Medicine and Hygiene: 75(3) 480–485. [PubMed] [Google Scholar]
- 7).Anderson RM and May RM. 1991. Infectious diseases of Humans, Dynamics and Control Oxford University Press. [Google Scholar]
- 8).Kwan JL, Kluh S, and Reisen WK. 2012. Antecedent Avian Immunity Limits Tangential Transmission of West Nile Virus to Humans. PLOS One 7:e34127. [DOI] [PMC free article] [PubMed] [Google Scholar]
- 9).Dun Jon L. Field Guide to the Birds of North America, 4th Edition 2002. National Geographic Society; Washington DC. [Google Scholar]
- 10).Sibley David A. Sibley Guide to birds/National Audubon Society Sibley Guide to Birds, 2003. Alfred A. Knopf, Inc. New York. [Google Scholar]
- 11).Pyle Peter. Identification Guide to North American Birds Part 1. 1997. Slate Creek Press; Bolinas, CA. [Google Scholar]
- 12).Casals J 1957. The arthropod-borne group of animal viruses. Transaction of the New York Academy of Science, series 2. 19: 219–235 [DOI] [PubMed] [Google Scholar]
- 13).Migratory Bird Treaty Act of 1918 (16 U.S.C. 703–712; Ch. 128; July 13, 1918; 40 Stat. 755)
- 14).Kim LM, Guzman H, Tesh RB, Bueno R, Dennett JA and Alonso CL. 2008. Biological and phylogenetic characterization of pigeon paramyxovirus serotype-1 circulating in North American pigeons and doves. J Clin Microbiol 46:3303–3310. [DOI] [PMC free article] [PubMed] [Google Scholar]
- 15).McKenna M May 7, 2015. The Avian Flu Epidemic: Massive Impact, Uncertain Future. National Geographic; http://phenomena.nationalgeographic.com/2015/05/07/bird-flu-1/ [Google Scholar]
- 16).McKenna M June 15, 2015b. Bird Flu Cost the US $3.3 Billion and Worse Could be Coming. National Geographic; http://phenomena.nationalgeographic.com/2015/07/15/bird-flu-2/ [Google Scholar]
- 17).NPR, Harvest Public Media. May 21, 2015. Avian Flu Outbreak Takes Poultry Producers into Uncharted Territory. Accessed 9-19-2016 http://www.npr.org/sections/thesalt/2015/05/21/408306843/avian-flu-outbreak-takes-poultry-producers-into-uncharted-territory
- 18).USDA. 2015. List of Wild Bird Highly Pathogenic Avian Influenza Cases in the United States. www.CDC.gov/flu/avianflu/h5/. Last updated 9/4/2015.
- 19).USGS 2014–05. Detection of Highly Pathogenic Avian Influencza Viruses H5N2 and H5N8 in wild birds of the United States.
- 20).USDA. 2016. Confirmed Avian Influenza Detections – 2016. Accessed 9-19-2016 https://www.aphis.usda.gov/aphis/ourfocus/animalhealth/animal-disease-information/avian-influenza-disease/sa_detections_by_states/ai-2016-map


