Abstract
Previously, we have reported the pharmacokinetic properties of α-mangostin in mice. For this study, we evaluated the pharmacokinetic profile of α-mangostin using a standardized mangosteen extract in C57BL/6 mice. The primary objective was to determine the pharmacokinetic properties of α-mangostin when administered as an extract. This experiment was designed to test our primary hypothesis that α-mangostin in an extract should achieve a desirable pharmacokinetic profile. This is especially relevant as dietary supplements of mangosteen fruit are regularly standardized to α-mangostin. Mice received 100 mg/kg of mangosteen fruit extract orally, equivalent to 36 mg/kg of α-mangostin, and plasma samples were analyzed over a 24 hour period. Concentrations of α-mangostin were determined by LC-MS/MS. In addition, we evaluated the stability in the presence of phase I and phase II enzymes in liver and gastrointestinal microsomes. Furthermore, we identified evidence of phase II metabolism of α-mangostin. Further research will be required to determine if less abundant xanthones present in the mangosteen may modulate the pharmacokinetic parameters of α-mangostin.
Keywords: α-mangostin, mangosteen, absorption, mangosteen, pharmacokinetic, C57BL/6 mice
1 Introduction
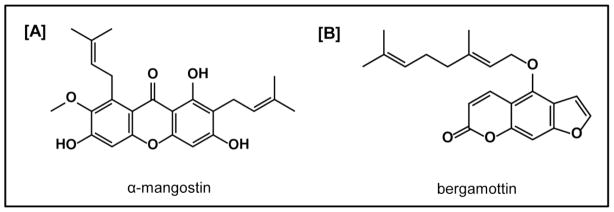
α-Mangostin (1,3,6-Trihydroxy-7-methoxy-2,8-bis(3-methyl-2-butenyl)-9H-xanthen-9-one, see Figure 1) is the most abundant polyphenolic xanthone in the mangosteen (Garcinia mangostana) fruit and has been associated with a multitude of health promoting properties (1). Historically, this plant has been used for arthritis, dysentery, inflammation, skin disorders, and wounds. α-Mangostin is comprised of a tricyclic aromatic ring system and a mixture of hydroxyl and isoprenyl groups, making it extremely hydrophobic (2). For centuries, the mangosteen fruit has been used medically in Southeast Asia and is fast becoming a popular dietary supplement and juice beverage. For these reasons, products containing α-mangostin have been receiving increased attention by scientists and consumers for its potential health promoting properties. More recently, a variety of biological activities were reported with xanthones from the mangosteen fruit or standardized extracts that included antioxidant (3,4), anti-inflammatory (5–7), anti-bacterial (8–11), and anti-cancer related effects (12–15).
Figure 1.
Chemical structures of α-mangostin and bergamottin
In both mice and rats, α-mangostin is well tolerated following multiple doses as high as 200 mg/kg and is not associated with any specific toxicity (16). For preclinical pharmacokinetic studies, mice are an ideal choice because the amount of starting study material compared to rats is less (e.g. up to 10-fold), and the majority of transgenic animal models that have been developed utilize mice as opposed to rats. We have observed that α-mangostin, when administered at 100 mg/kg/day for 30 days, is tolerable with no obvious signs of toxicity (13). In addition, we have previously reported on the pharmacokinetics of α-mangostin in mice and observed no changes in hematological values at 100 mg/kg (13). We first reported the pharmacokinetic profile of α-mangostin in mice with an AUC of 5,736 nmol/L/hr, Tmax of 30 minutes, and a Cmax of 1,382 nmol/L, and half-life of 5 hours (17). In a juice containing 94.2 mg of xanthones, including an unknown amount of α-mangostin, that was administered to healthy human volunteers, a peak plasma concentration of 3.42 ng/mL (18) was achieved. In our studies, as well as other published studies, α-mangostin is reported to be well tolerated (13,16,17,19).
Previously, we showed that α-mangostin administered orally to mice achieves detectable plasma levels and can decrease 22Rv1 prostate xenograft tumor growth (20). In this study, our primary objective was to test the hypothesis that mangosteen extract standardized to α-mangostin will be able to achieve pharmacokinetic profile comparable to what we observed with α-mangostin administration in mice where a maximum plasma concentration of Cmax of 1,382 nmol/L was observed following a 100 mg/kg oral dose. This is especially significant since the most likely way to consume α-mangostin is in a standardized extract. For our studies, we have used mangosteen fruit extract standardized to α-mangostin. Using LC/MS-MS we previously found that mangosteen fruit extract contains >35% of α-mangostin (21), and there is evidence of several xanthones present including gartanin, 8-desoxygartanin, gamma-mangostin, 3-isomangostin, and 9 hydroxycalabaxanthone).
2 Methods and Materials
2.1 Chemicals and reagents
Mangosteen fruit extract was obtained from Avesthagen, Inc. (Chatsworth, CA, USA). Bergamottin was used as the internal standard (IS) and was from Chromadex (Irvine, CA, USA). Liquid chromatography-mass spectrometry (LC-MS) grade acetonitrile (ACN) containing 0.1% formic acid (HCO2H) was obtained from Fisher scientific (Fair Lawn, NJ, USA). Blank mice plasma for preparation of the calibration curves and method development was obtained from Lampire Biological Laboratories (Pipersville, PA, USA).
2.2 Instrumentation and LC/MS/MS conditions
The LC-MS/MS system consisted of an Agilent HPLC auto sampler, Agilent quaternary pump, and an API-3200 Qtrap mass spectrometer with a turbo-ion spray source (Applied Biosystem, Foster City, CA). The Q-trap was equipped with an electrospray ionization (ESI) source and operated in the positive-ion mode. Total eluent flow from the LC was directed to the turbo ion spray source without splitting. A valco valve was used to divert the first two minutes of the eluent to waste. Needle voltage was 4.5 kV, turbo ion spray heater temperature 500 °C, (GS1) nebulizer gas (nitrogen) 50 psi, and (GS2) turbo heater gas (nitrogen) 50 psi. Curtain gas (nitrogen) was set at 10, and collision gas (CAD, nitrogen) pressure in the collision cell was set at medium. The optimum values for collision energy (CE), declustering potential (DP), and cell entrance potential (CEP) were −50, −50, and −10, respectively. Tandem mass spectrometry (MS/MS) optimization was established by directly infusing 10 μg/mL of each analyte in acetonitrile.
The instrument was operated in unit resolution mode with the peak width (full width at half-maximum, FWHM) set to 0.7 m/z, both at Q1 and Q3. The selected reaction monitoring scheme followed transitions of the precursor to selected product ions with the following values: m/z 411–355 for α-mangostin and m/z 339–202 for bergamottin. Chromatography was performed on a Symmetry C18, 4.6mm × 50mm, 5.0 μm analytical column (Waters, Milford, MA, USA) with a Symmetry C18 Guard Column, 5 μm, 3.9 × 20 mm (Waters, Milford, MA, USA). The column was maintained at a temperature of 37°C. The mobile phase consisted of 0.4% formic acid in water and ACN (0.1%formic acid) delivered at a flow rate of 0.6 mL/min (injection volume 20 μL). The gradient program was as follows: 70–95% B at 0–7 min, hold for 1 min; followed by a 95–70% B from 7–8 min; and followed by re-equilibration at 70% B from 8–15 min.
2.3 Animals and treatments
Thirty-six C57BL/6J mice, approximately 7–8 weeks of age, were purchased from Jackson Labs (Bar Harbor, ME, USA). Thirty-two mice received mangosteen fruit extract, and four mice served as controls. The mice were housed in plastic cages and received a standard chow (Teklad LM-485) and water ad libitum, prior to the experiment. All mice were weighed prior to dosing in order to ensure accurate dosing. The mice were maintained on a 12 h/12 h light/dark cycle. Non-fasting animals were used for the study. Mice were maintained for a week before the experiments to get them acclimatized to the housing facility. After one week, mice were administered a freshly prepared suspension of mangosteen fruit extract in 100 μL cotton seed oil at a dose of 100 mg/kg by intragastric gavage. In the experiments evaluating the mRNA of MDR1, cohorts of mice received cotton seed oil, α-mangostin (36 mg/kg), or MFE (100 mg/kg). All animal experiments were performed according to the policies and guidelines of the Institutional Animal Care and Use Committee (IACUC) of the University of Illinois at Chicago.
2.4 Sample preparation
Standards of α-mangostin and bergamottin (4 mg/mL) were weighed accurately and dissolved in the appropriate volume of acetonitrile. Working standard solutions were diluted to a series of concentrations with acetonitrile. Standards were spiked in blank mouse plasma to obtain calibration curves. Plasma samples (50 μL) were mixed with an internal standard solution (200 μL) and centrifuged at 14,000 RPM for 15 min at room temperature. The supernatant was then transferred to a Spin-X Centrifuge tube filter with 0.45 μM nylon filters and centrifuged again at 14,000 RPM for 15 minutes. The final supernatant was then transferred to auto sampler vials, and 20 μL of sample were injected into the LC-MS/MS system for analysis.
Following the administration of isoflurane as anesthetic, 200–400μl blood was collected from the mandibular vein. Thereafter, the blood samples were collected at 0.25, 0.5, 1, 2, 4, 6, 12, and 24 hours with four mice bled at each time point for α-mangostin. Blood samples were collected in lithium-heparin coated tubes and were immediately spun at 2,000 x rpm at 4° C for 15 minutes (22). Plasma was transferred to a fresh tube and stored at −80° C until LC/MS/MS analysis. Plasma samples and calibrants (50 μL) were deproteinized by the addition of acetonitrile (200 μL), followed by a 1 minute vortex, and then incubated on ice for twenty minutes. Following incubation, the samples were centrifuged at 21,000 × g to obtain the supernatant. The supernatant was then transferred to a Spin-X Centrifuge tube filter with 0.45 μM nylon filters and centrifuged again at 14,000 RPM for 15 minutes. Working standard solutions were diluted to a series of concentrations with acetonitrile.
2.5 LC/MS data analysis
Data were analyzed with the Analyst Software Version 1.4.2 (Framingham, ME, USA). Limit of quantitation (LOQ) was set at a signal to noise ratio of 10, and the level of detection was set at a signal to noise ratio of 3. Quadratic modeling of the analyte area under the curve relative to the internal standard area was used to determine concentrations of α-mangostin.
2.6 Pharmacokinetic parameters
Mean plasma concentrations of orally administered α-mangostin versus time were plotted. The pharmacokinetic parameters were determined by non-compartmental methods. Area under the concentration-curve was estimated from the time of dose to the last plasma concentration by the log-linear rule (AUC0–24) and extrapolated to infinity (AUC0-inf) by dividing the last plasma concentration by the terminal elimination rate. Analysis was performed using WinNonlin Version 5.3 from Pharsight (Mountain View, CA, USA). Maximal concentrations (Cmax) and time to maximal concentration (Tmax) were estimated from direct examination of the data. Terminal and effective half-life were estimated using log-linear regression.
2.7 Microsomal stability assay
0.5 mg/ml human intestinal microsomes (BD Biosciences) and mouse intestinal microsomes (Xenotech) were incubated with either α-mangostin or MFE at a final concentration of 1 μM. To determine Phase I metabolism, the microsomes were incubated with α-mangostin/MFE in a solution containing 5mM Isocitric acid, 5mM MgCl2, 0.2U/ml Isocitric Acid Dehydrogenase, and 1mM NADP+ in 100mM Tris-HCl buffer at pH 7.4. For the Phase II metabolism study, the microsomes were incubated with α-mangostin/MFE in a solution containing 5 mM MgCl2, 50μg/ml alamethicin, and 5mM uridine 5′-diphosphoglucuronic acid (UDGPA) in 100mM Tris-HCl buffer (pH7.4). The compounds were incubated with microsomes at 37°C for 0, 3, 5, and 10 mins, in duplicate. Control tubes were incubated without NADP+ or UDGPA for Phase I and II studies, respectively. After incubation, samples were vortexed and kept on ice until ready for centrifugation at 17,000g for 15mins at 4°C. After centrifugation, the supernatants were transferred into vials and analyzed using the LC-MS method, as described above.
2.8 Real time PCR of drug transporters in the mouse intestines
Mice were administered study agents for fourteen days, as described above. Intestinal mucosa scraped from different regions of the mouse intestine (jejunum and ileum) was immediately snap frozen for RNA extraction using Qiagen RNeasy kits (23). RNA was reverse transcribed and amplified using Brilliant SYBR Green qRT-PCR Master Mix kit (Stratagene). Mouse mdr1a was amplified with gene-specific primers 5′-GTGGGGGACAGAAACAGAGA-3′ (sense) and 5′-GAACGGTAGACAAGCGATGAG-3′ (antisense). Mouse GAPDH was amplified as an internal control. Relative levels of mdr1a mRNA were expressed as (% of control) normalized to GAPDH.
2.9 Hematology values
Fourteen days following administration of cotton seed oil (i.e. control vehicle) or 100 mg/kg α-mangostin, blood was collected as described above, placed into spray coated K2EDTA tubes, and processed immediately using the Advia® 120 Hematology System (Siemens Healthcare Diagnostics, Tarrytown, NY, USA) (17). Values are expressed as a mean. Error values are expressed as standard deviations.
2.10 Statistical Analysis
Statistical analysis was performed using GraphPad QuickCals software. Students t test was used to compute the significant decrease in alpha-mangostin and mangosteen fruit extract levels in presence of Phase I and II enzymes at 3, 5, and 10 mins compared to the 0 time point. All statistical tests were two- sided, and P<0.05 was considered statistically significant. Results are expressed as means ± SD.
3 Results
3.1 Method development and validation
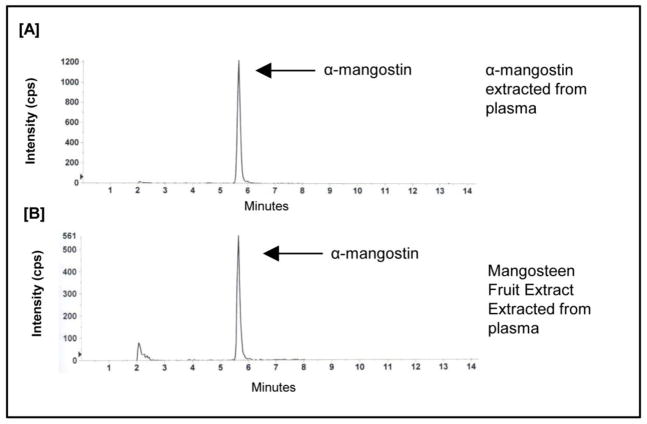
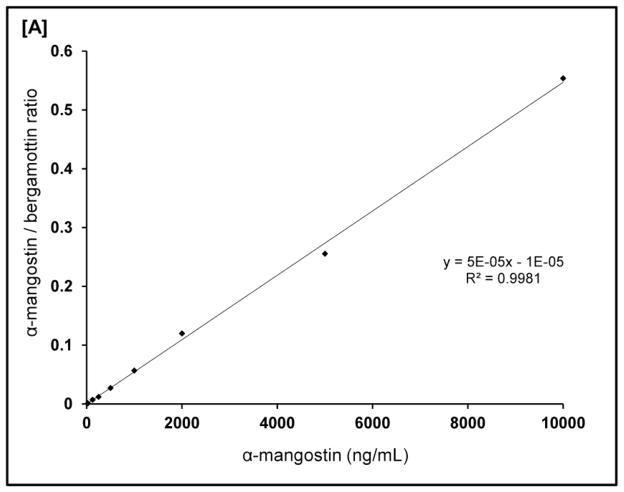
Plasma levels of α-mangostin were analyzed by a LC-MS/MS method. The specificity and sensitivity of the assay to detect α-mangostin is shown by comparing the chromatograms of plasma sample spiked with α-mangostin and mangosteen fruit extract (Fig 2A, B) as well as a standard curves (Fig 3). Previously, we reported the optimized analytical method (17).
Figure 2.
Representative chromatograms of [A] α-mangostin extracted from mouse plasma and [B] the limit of quantitation of α-mangostin in mouse plasma.
Figure 3.
Standard curve of α-mangostin.
3.2 Pharmacokinetics of mangosteen fruit extract standardized to α-mangostin
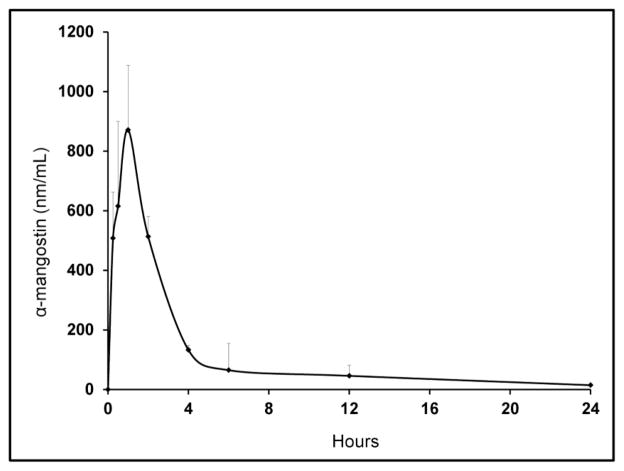
The mean plasma concentrations of mangostin versus time following oral administration are shown in Figure 4. Table 1 summarizes the pharmacokinetic parameters of α-mangostin when administered as mangosteen fruit extract. A method was developed and used successfully to support the pharmacokinetic study of α-mangostin in mice after a single oral dose of α-mangostin in cottonseed oil. Mice administered 100 mg/kg of mangosteen fruit extract (equivalent to 36 mg/kg of α-mangostin) achieved a maximum plasma concentration of 357 ng/mL (i.e. 871 nM/mL) at 1 hour. The time to maximum concentration (Tmax) was 1 hr. The t1/2 for α-mangostin was 8.2 hours. The area under the curve from 0–24 hours (AUCLast) and the area under the curve from 0-inf (AUCInf) were estimated using the linear trapezoidal rule and observed to be 2,807 nmol/hr and 2,980 nmol/hr, respectively.
Figure 4.
24 hour mean concentration-time pharmacokinetic profile of α-mangostin in mice following 100 mg/kg oral dose of mangosteen fruit extract (α-mangostin dose = 36 mg/kg). Values are shown as standard error of the mean.
Table 1.
Single dose pharmacokinetic properties of mangosteen fruit extract (100 mg/kg) standardized to α-mangostin administered orally in mice.
| Cmax | 871 nmol/L |
| Tmax | 1 hr |
| T1/2 | 8.2 hr |
| AUClast | 2,807 hr*nmol/L |
| AUCinf | 2,980 hr*nmol/L |
Cmax = Maximum plasma concentration;
Tmax = Time to maximum concentration;
AUClast = Area Under the Curve from time 0 to 24 hrs
AUCinf = Area Under the Curve from time 0 to infinity
3.3 Metabolism of mangosteen fruit extract standardized to α-mangostin
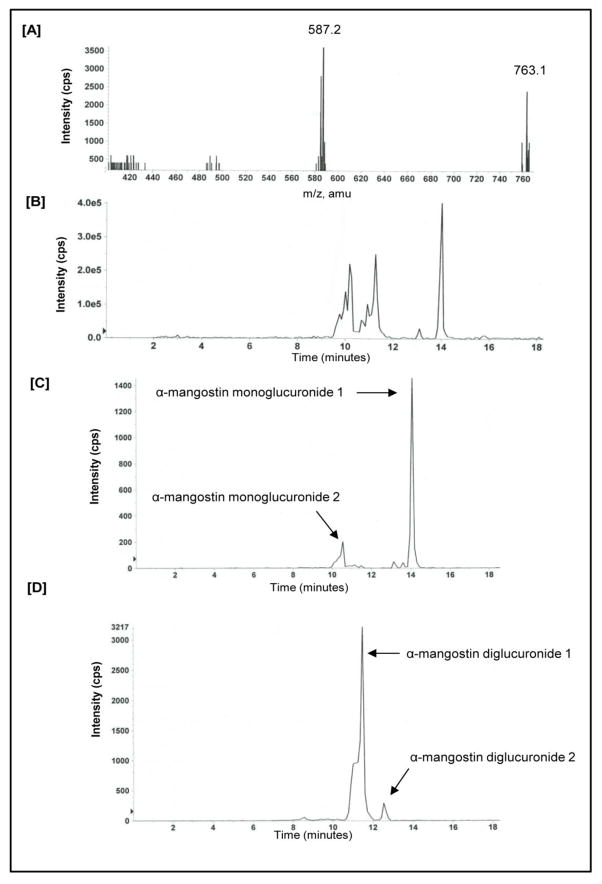
After determining the pharmacokinetic parameters of α-mangostin, plasma samples from four hours post dosing were scanned for evidence of glucuronidation and sulfation of α-mangostin. This time point was selected as evidence in a decrease of circulating α-mangostin and is observed in the 24 hour pharmacokinetic profile. To identify evidence of glucuronidation, samples were scanned at 587 and 763 for mono-glucuronides and bi-glucuronides, respectively. Evidence for at least two different glucuronides is presented in Figure 5A. To identify evidence of α-mangostin sulfation, samples were scanned at 491 and 571 for mono-sulfates and bi-sulfates, respectively. Based on these results, α-mangostin did not appear to undergo sulfation; however, further analysis is ongoing. Next, we performed a precursor ion chromatogram and identified constituents that were 587 and 763 (Fig 5B). Finally, we performed multiple reaction monitoring (MRM) to scan at masses of 587 and 763. At the 587 mass (monoglucuronide) we observed evidence of at least two metabolites at 10.5 and 14.1 minutes, respectively (Fig 5C). It is possible that there are actually three metabolites, with two being near 10.5 and one at 14.1 minutes. At the 763 mass (i.e. diglucuronide), we observed evidence of at least two metabolites with a retention time of 11.5 and 12.2 minutes, respectively (Fig 5D). In total, there is evidence to suggest that there are 5 different glucuronides.
Figure 5.
Mouse plasma was evaluated 4 hours following a single dose of oral mangosteen fruit extract (100 mg/kg) standardized to α-mangostin for [A] Neutral loss scan of 176 and 352 of α-mangostin and [B] Precursor ion chromatogram of α-mangostin [C] Multiple Reaction Monitoring (MRM) of α-mangostin (587/411) and [D] Multiple Reaction Monitoring (MRM) of α-mangostin (763/411).
3.4 Evaluation of mangosteen fruit extract standardized to α-mangostin on hematology values
Following the administration of oral α-mangostin, we did not observe any abnormalities in hematological values compared to mice that received vehicle only (Table 2). All values were within the normal expected ranges following a single dose of mangosteen fruit extract (100 mg/kg). Previously, we evaluated 100 mg/kg of pure α-mangostin and did not observe any abnormalities in hematological values (17).
Table 2.
Hematological values of male C57BL/6 mice 14 days after receiving a single dose of vehicle or mangosteen fruit extract (100 mg/kg)
| Control (Vehicle) | Mangosteen Fruit Extract (100 mg/kg) | |||||||||
|---|---|---|---|---|---|---|---|---|---|---|
| 1 | 2 | 3 | 4 | Average | 1 | 2 | 3 | 4 | Average | |
|
|
|
|||||||||
| WBC (x 103/μL) | 7.6 | 10.4 | 8.2 | 7.0 | 8.3 ± 1.5 | 8.9 | 7.5 | 5.2 | 7.8 | 7.3 ± 1.6 |
| RBC (x 106/μL) | 10 | 9.38 | 10 | 10.3 | 9.9 ± 0.4 | 10.6 | 9.6 | 9.4 | 9.5 | 9.8 ± 0.6 |
| HGB (g/dL) | 14.5 | 13.5 | 14.2 | 15.1 | 14.3 ± 0.7 | 15.6 | 14.1 | 14 | 14 | 14.4 ± 0.8 |
| HCT (%) | 48.3 | 45.3 | 47 | 48.8 | 47.4 ± 1.6 | 56.5 | 51.8 | 50.4 | 50.5 | 52.3 ± 2.9 |
| MCV (fL) | 48.3 | 48.3 | 47 | 47.2 | 47.7 ± 16.9 | 53.3 | 53.9 | 53.6 | 53.3 | 53.5 ± 0.3 |
| PLT (x 103/μL) | 1230 | 1064 | 1071 | 239 | 901 ± 448 | 992 | 1392 | 616 | 1231 | 1058 ± 337 |
| MPV (fL) | 6.4 | 7 | 7 | 7.7 | 7.0 ± 0.5 | 4.7 | 6 | 5.1 | 6.1 | 5.5 ± 0.7 |
| RDW (%) | 12.6 | 13.3 | 12.4 | 11.6 | 12.5 ± 0.7 | 11.6 | 12.7 | 12.2 | 11.8 | 12.1 ± 0.5 |
| Retic (%) | 3.3 | 5.4 | 3.1 | 3.4 | 3.8 ± 1.1 | 4.3 | 3.9 | 3.3 | 4.6 | 4.0 ± 0.6 |
| Retic (x 109/μL) | 328 | 510 | 308 | 308 | 363.3 ± 98 | 460 | 374 | 313 | 432 | 395 ± 65 |
| Neutrophil (%) | 9.5 | 13.8 | 6.6 | 14.4 | 11.1 ± 3.7 | 6.8 | 18.1 | 4.6 | 6.3 | 9.5 ± 6.2 |
| Lymphocyte (%) | 86.4 | 79.5 | 88.5 | 75.1 | 82.4 ± 6.2 | 86.7 | 74.9 | 85.1 | 88.5 | 83.8 ± 6.1 |
| Monocyte (%) | 0.6 | 0.6 | 1 | 1.5 | 0.9 ± 0.4 | 1.3 | 2 | 4.9 | 1.2 | 2.4 ± 1.7 |
| Eosinophil (%) | 1.9 | 4 | 2.3 | 8 | 4.1 ± 2.8 | 3.4 | 2.6 | 4.3 | 1.9 | 3.1 ± 1.0 |
| Basophil (%) | 0.3 | 0.4 | 0.4 | 0.5 | 0.4 ± 0.1 | 0.5 | 0.6 | 0.5 | 0.7 | 0.6 ± 0.1 |
The values are expressed as mean ± SD. WBC = White Blood Cells; RBC = Red Blood Cells; HGB = hemoglobin; HCT = hematocrit; MCV = Mean Corpuscular Volume; MCH = Mean Corpuscular Hemoglobin; MCHC = Mean Corpuscular Hemoglobin Concentration; MPV = Mean Platelet Volume; RDW = Red Cell Distribution Width; Retic = Reticulocyte Count
3.5 Stability of α-mangostin and mangosteen fruit extract in intestinal microsomes
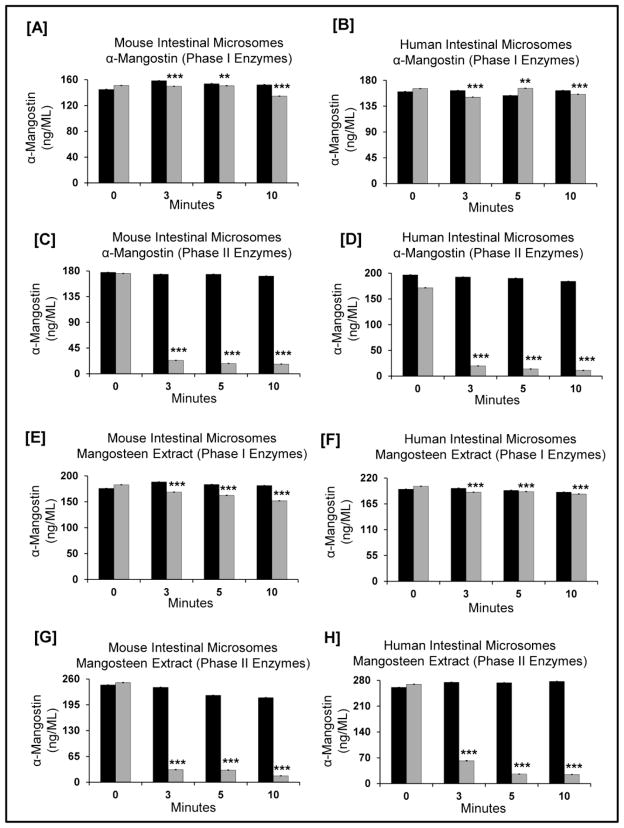
To characterize the extent of Phase I and Phase II metabolism, α-mangostin and mangosteen fruit extract was incubated in the presence of intestinal microsomes from mouse and human sources. By 10 minutes, the stability of α-mangostin, or as an extract, was observed to be stable in mouse and human intestinal microsomes, respectively (Fig 6A, B, E & F). Consistent with our in vivo studies, we observed a significant decrease (p<0.0001) of α-mangostin in mouse and human microsomes in the presence of Phase II enzymes (Fig 6C&D). From 0 to 3 minutes, α-mangostin in Phase II enzymes decreases by 89 and 87%, respectively.
Figure 6.
α-Mangostin and mangosteen fruit extract, was incubated with gastrointestinal microsomes to mimic Phase I and II metabolism in the mouse or human GI tract. Human and mouse gastrointestinal microsomes were prepared as described in the materials and methods. Black bars represent the respective control for that individual time point. Gray bars represent the microsomal stability of α-Mangostin/MFE in the indicated enzyme system in both mouse and human gastrointestinal microsomes. A ‘no preincubation’ was performed (data not shown) and did not have any impact on the interpretation of this data. [A] α-Mangostin was incubated with mouse gastrointestinal microsomes (Phase 1); [B] α-Mangostin was incubated with human gastrointestinal microsomes (Phase 1); [C] α-Mangostin was incubated with mouse gastrointestinal microsomes (Phase 2); [D] α-Mangostin was incubated with human gastrointestinal microsomes (Phase 2); [E] Mangosteen Fruit Extract standardized to α-Mangostin was incubated with mouse gastrointestinal microsomes (Phase 1); [F] Mangosteen Fruit Extract standardized to α-Mangostin was incubated with human gastrointestinal microsomes (Phase 1); [G] Mangosteen Fruit Extract standardized to α-Mangostin was incubated with mouse gastrointestinal microsomes (Phase 2); [H] Mangosteen Fruit Extract standardized to α-Mangostin was incubated with human gastrointestinal microsomes (Phase 2);
Next, we evaluated mangosteen extract standardized to α-mangostin to understand if other xanthones present may modulate the stability of α-mangostin. In the presence of Phase I enzymes, α-mangostin was stable in both mouse and human microsomes. When mangosteen fruit extract standardized to α-mangostin was incubated in the presence of Phase II enzymes, a significant decrease (p<0.0001) in stability was observed. From 0 to 3 minutes, α-mangostin in a mangosteen fruit extract in Phase II enzymes decreased by 88% and 77%, respectively. These results suggest that Phase I metabolism has a minimal role in the metabolism of α-mangostin. This is true whether it is given alone or in the form of a standardized mangosteen fruit extract. Phase II metabolism in microsomes appears to be the primary route of metabolism.
3.7 α-Mangostin increases the mRNA expression of MDR1
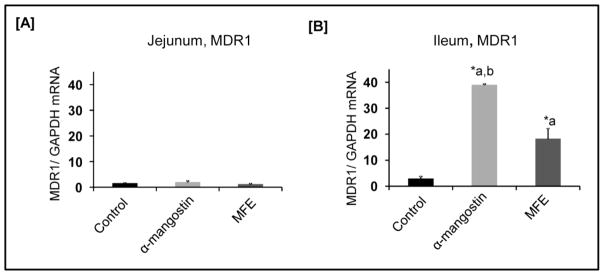
For 14 days, C57BL/6 mice were administered α-mangostin, mangosteen fruit extract, or a vehicle daily. After 14 days, intestines were collected and mRNA levels of MDR1 were determined by real-time quantitative PCR. No observable increases in MDR1 jejunum were observed (Figure 7A). As shown in figure 7B, MDR1 levels were significantly increased in the ileum following treatment with both α-mangostin and MFE. Treatment with α-mangostin resulted in a 13.1 fold increase in mRNA expression of MDR1 in the ileum compared to the control (P < 0.001). Treatment with MFE resulted in a 6.2 fold increase in MRNA expression of MDR1 in the ileum compared to the control (P < 0.01). When comparing α-mangostin to MFE, a 2.1 fold increase in mRNA expression was observed (P < 0.001).
Figure 7. P-gp and DRA expression in C57/BL6 mice small intestine in response to treatment with α-mangostin and MFE.
[A] Relative abundance of mdr1a mRNA from the ileum of control and treated mice normalized to GAPDH mRNA. [B] Relative abundance of mdr1a mRNA from the jejunum of control and treated mice normalized to GAPDH mRNA. Values are the means ± standard error of the mean. **P < 0.001 vs. untreated control. *P < 0.01 vs. untreated control. ‘a’ = versus control, ‘b’ = versus MFE.
4 Discussion
Mangosteen fruit extract has been used for centuries in Southeast Asia for arthritis, dysentery, inflammation, skin disorders, and wound infections. It is fast becoming a popular dietary supplement and juice beverage composed of different xanthones. The most abundant xanthone present in the extract is α-mangostin and has been associated with a multitude of health promoting properties. As a strategy to reduce the layers of complexity associated with multi-ingredient products, we evaluated the pharmacokinetic parameters of α-mangostin (36 mg/kg) in a standardized mangosteen extract. Previously, we reported in mice that individual α-mangostin can achieve a Cmax of 1,382 nmol/L, a Tmax of 0.5 hr, and a half-life of 5 hours. We also identified evidence of Phase II metabolism using multiple reaction monitoring (MRM) to identify at least 2 mono-glucuronides and 2 bi-glucuronides. In our analysis, we did not observe evidence of sulfation. The relatively quick elimination of α-mangostin could reasonably be assumed to be attributable to the presence of 3 hydroxyl groups. These hydroxyl groups can function as handles for the UGT enzyme system, thus resulting in glucuronidation and quick elimination. In our study described above, we performed a nearly identical experiment to define the PK parameters of α-mangostin when in a standardized mangosteen extract. There are a few subtle differences that should be noted. Our mangosteen extract contained α-mangostin along with additional xanthones. Using MS/MS we estimate that up to 26 xanthones may be present in this extract (data not shown), however, further work is required to identify these xanthones. Furthermore, based on dose translation, which we have described previously, the human dose equivalent of mangosteen fruit extract would be approximately 500 mg in a 60 kg adult (17).
Another possible consideration is the role of P-gp (MDR1) in preventing the absorption of α-mangostin (23). P-gp is an important component in the protection of intestinal epithelial cells which pumps out xenobiotics and bacterial toxins from inside the cells back into the intestinal lumen. It was interesting to observe that a specific portion of the gastrointestinal tract, specifically the ileum, resulted in a dramatic change in the mRNA expression of MDR1. Being that the mice received the same amount of α-mangostin, it is important to note that a further increase was observed in the intestines of mice treated with α-mangostin compared to MFE. One possibility is that when α-mangostin is administered with additional xanthones, the overall activity of P-gp is decreased, thereby allowing enhanced absorption of α-mangostin. Further work will be required to understand the interactions of additional xanthones against P-gp.
There are several possible explanations for the differences of the pharmacokinetic parameters of α-mangostin when administered with other xanthones. First, in our previous study we evaluated a single xanthone (e.g. α-mangostin). Second, the mice in our previous study were administered 100 mg/kg of α-mangostin while in this study, mice received 100 mg/kg of mangosteen fruit extract (standardized to 36% α-mangostin; equivalent to 36 mg/kg of α-mangostin). Third, phytochemicals have been reported previously to inhibit the UGT enzyme system (24–26). In most instances, drugs follow linear kinetics which suggests that if a dose is reduced to 1/3 the PK, parameters should reasonably be reduced in a similar manner (27). Given this line of logic, a 100 mg/kg of extract containing 36% of α-mangostin should achieve a Cmax near 497 nmol/L; however, we observed a Cmax of 871 nmol/L. This represents a 75% increase in Cmax when α-mangostin is delivered as a mangosteen extract when compared to individual α-mangostin. Previously, individual α-mangostin had an AUC of 5,736 hr*nmol/L when we should have expected an AUC near 2065; however, the observed AUC was 2,807 hr*nmol/L. This represents a 25% increase in AUC when α-mangostin is delivered as a mangosteen extract compared to individual α-mangostin. Interestingly, we did observe an increase in Tmax from 0.5 hr to 1 hr when α-mangostin is administered as a mangosteen extract compared to individual α-mangostin representing a 100% increase in Tmax. Finally, we observed an increase in the half-life from 5 hrs to 8.2 hrs when α-mangostin was administered as a mangosteen extract, representing a 64% increase in half life. Based on these observations, it is reasonable to assume the pharmacokinetic parameters of α-mangostin may be influenced by other polyphenols present in this complex mixture that may improve the absorption and stability to enhance the pharmacokinetic parameters in mice. Another observation is the potential that the xanthones, which are known to be highly lipophilic as estimated by their LogP (17), were administered in an oil vehicle. A major factor in mangostin solubility, micellarization, and epithelial absorption could possibly be attributed to the vehicle, similar to what has been observed with carotenoids (28).
In conclusion, the present study is the first evaluation of oral pharmacokinetics of mangosteen fruit extract standardized to α-mangostin in mice. There is evidence to support that our hypothesis of a mangosteen fruit extract displays the same pharmacokinetic profile and evidence to reject the null hypothesis which was that α-mangostin absorption will be different when administered as an extract. α-Mangostin, when administered as an extract, undergoes extensive first pass metabolism with rapid conjugation following oral administration. This data suggests that the pharmacokinetic parameters of α-mangostin can be enhanced when administered as a standardized extract as opposed to an individual phytochemical; however, additional work will be required to characterize these potential interactions. Furthermore, evaluation of individual xanthones for potential drug interactions should be investigated further.
Acknowledgments
This work was supported by R03CA138953 (JJJ) NIH/NCI, R03DK096258 (RKG) NIH/NIDDK, and R21 DK96245 (SS) NIH/NIDDK, as well as funding from the University of Illinois at Chicago College of Pharmacy and Department of Pharmacy Practice.
Footnotes
Conflicts of interest statement
The authors do not have any conflicts of interest.
Publisher's Disclaimer: This is a PDF file of an unedited manuscript that has been accepted for publication. As a service to our customers we are providing this early version of the manuscript. The manuscript will undergo copyediting, typesetting, and review of the resulting proof before it is published in its final citable form. Please note that during the production process errors may be discovered which could affect the content, and all legal disclaimers that apply to the journal pertain.
References
- 1.Obolskiy D, Pischel I, Siriwatanametanon N, Heinrich M. Garcinia mangostana L: a phytochemical and pharmacological review. Phytother Res. 2009;23:1047–1065. doi: 10.1002/ptr.2730. [DOI] [PubMed] [Google Scholar]
- 2.Pedraza-Chaverri J, Cardenas-Rodriguez N, Orozco-Ibarra M, Perez-Rojas JM. Medicinal properties of mangosteen (Garcinia mangostana) Food Chem Toxicol. 2008;46:3227–3239. doi: 10.1016/j.fct.2008.07.024. [DOI] [PubMed] [Google Scholar]
- 3.Jung HA, Su BN, Keller WJ, Mehta RG, Kinghorn AD. Antioxidant xanthones from the pericarp of Garcinia mangostana (Mangosteen) J Agric Food Chem. 2006;54:2077–2082. doi: 10.1021/jf052649z. [DOI] [PubMed] [Google Scholar]
- 4.Kondo M, Zhang L, Ji H, Kou Y, Ou B. Bioavailability and antioxidant effects of a xanthone-rich Mangosteen (Garcinia mangostana) product in humans. J Agric Food Chem. 2009;57:8788–8792. doi: 10.1021/jf901012f. [DOI] [PubMed] [Google Scholar]
- 5.Bumrungpert A, Kalpravidh RW, Chitchumroonchokchai C, Chuang CC, West T, et al. Xanthones from mangosteen prevent lipopolysaccharide-mediated inflammation and insulin resistance in primary cultures of human adipocytes. J Nutr. 2009;139:1185–1191. doi: 10.3945/jn.109.106617. [DOI] [PubMed] [Google Scholar]
- 6.Bumrungpert A, Kalpravidh RW, Chuang CC, Overman A, Martinez K, et al. Xanthones from mangosteen inhibit inflammation in human macrophages and in human adipocytes exposed to macrophage-conditioned media. J Nutr. 2010;140:842–847. doi: 10.3945/jn.109.120022. [DOI] [PubMed] [Google Scholar]
- 7.Chen LG, Yang LL, Wang CC. Anti-inflammatory activity of mangostins from Garcinia mangostana. Food Chem Toxicol. 2008;46:688–693. doi: 10.1016/j.fct.2007.09.096. [DOI] [PubMed] [Google Scholar]
- 8.Chomnawang MT, Surassmo S, Nukoolkarn VS, Gritsanapan W. Antimicrobial effects of Thai medicinal plants against acne-inducing bacteria. J Ethnopharmacol. 2005;101:330–333. doi: 10.1016/j.jep.2005.04.038. [DOI] [PubMed] [Google Scholar]
- 9.Chomnawang MT, Surassmo S, Wongsariya K, Bunyapraphatsara N. Antibacterial activity of Thai medicinal plants against methicillin-resistant Staphylococcus aureus. Fitoterapia. 2009;80:102–104. doi: 10.1016/j.fitote.2008.10.007. [DOI] [PubMed] [Google Scholar]
- 10.Dharmaratne HR, Sakagami Y, Piyasena KG, Thevanesam V. Antibacterial activity of xanthones from Garcinia mangostana (L.) and their structure-activity relationship studies. Nat Prod Res. 2013;27:938–941. doi: 10.1080/14786419.2012.678348. [DOI] [PubMed] [Google Scholar]
- 11.Koh JJ, Qiu S, Zou H, Lakshminarayanan R, Li J, et al. Rapid bactericidal action of alpha-mangostin against MRSA as an outcome of membrane targeting. Biochim Biophys Acta. 2013;1828:834–844. doi: 10.1016/j.bbamem.2012.09.004. [DOI] [PubMed] [Google Scholar]
- 12.Ee GC, Daud S, Izzaddin SA, Rahmani M. Garcinia mangostana: a source of potential anti-cancer lead compounds against CEM-SS cell line. J Asian Nat Prod Res. 2008;10:475–479. doi: 10.1080/10286020801948490. [DOI] [PubMed] [Google Scholar]
- 13.Johnson JJ, Petiwala SM, Syed DN, Rasmussen JT, Adhami VM, et al. alpha-Mangostin, a xanthone from mangosteen fruit, promotes cell cycle arrest in prostate cancer and decreases xenograft tumor growth. Carcinogenesis. 2012 doi: 10.1093/carcin/bgr291. [DOI] [PMC free article] [PubMed] [Google Scholar]
- 14.Liu Z, Antalek M, Nguyen L, Li X, Tian X, et al. The Effect of Gartanin, a Naturally Occurring Xanthone in Mangosteen Juice, on the mTOR Pathway, Autophagy, Apoptosis, and the Growth of Human Urinary Bladder Cancer Cell Lines. Nutr Cancer. 2013;65 (Suppl 1):68–77. doi: 10.1080/01635581.2013.785011. [DOI] [PMC free article] [PubMed] [Google Scholar]
- 15.Matsumoto K, Akao Y, Ohguchi K, Ito T, Tanaka T, et al. Xanthones induce cell-cycle arrest and apoptosis in human colon cancer DLD-1 cells. Bioorg Med Chem. 2005;13:6064–6069. doi: 10.1016/j.bmc.2005.06.065. [DOI] [PubMed] [Google Scholar]
- 16.Devi Sampath P, Vijayaraghavan K. Cardioprotective effect of alpha-mangostin, a xanthone derivative from mangosteen on tissue defense system against isoproterenol-induced myocardial infarction in rats. J Biochem Mol Toxicol. 2007;21:336–339. doi: 10.1002/jbt.20199. [DOI] [PubMed] [Google Scholar]
- 17.Ramaiya A, Li G, Petiwala SM, Johnson JJ. Single Dose Oral Pharmacokinetic Profile of alpha-Mangostin in Mice. Curr Drug Targets. 2012;13:1698–1704. doi: 10.2174/138945012804545524. [DOI] [PubMed] [Google Scholar]
- 18.Udani JK, Singh BB, Barrett ML, Singh VJ. Evaluation of Mangosteen juice blend on biomarkers of inflammation in obese subjects: a pilot, dose finding study. Nutr J. 2009;8:48. doi: 10.1186/1475-2891-8-48. [DOI] [PMC free article] [PubMed] [Google Scholar]
- 19.Nabandith V, Suzui M, Morioka T, Kaneshiro T, Kinjo T, et al. Inhibitory effects of crude alpha-mangostin, a xanthone derivative, on two different categories of colon preneoplastic lesions induced by 1, 2-dimethylhydrazine in the rat. Asian Pac J Cancer Prev. 2004;5:433–438. [PubMed] [Google Scholar]
- 20.Li G, Thomas S, Johnson JJ. Polyphenols from the mangosteen (Garcinia mangostana) fruit for breast and prostate cancer. Front Pharmacol. 2013;4:80. doi: 10.3389/fphar.2013.00080. [DOI] [PMC free article] [PubMed] [Google Scholar]
- 21.Li G, Petiwala SM, Pierce DR, Nonn L, Johnson JJ. Selective modulation of endoplasmic reticulum stress markers in prostate cancer cells by a standardized mangosteen fruit extract. PLoS One. 2013;8:e81572. doi: 10.1371/journal.pone.0081572. [DOI] [PMC free article] [PubMed] [Google Scholar]
- 22.Johnson JJ, Syed DN, Suh Y, Heren CR, Saleem M, et al. Disruption of androgen and estrogen receptor activity in prostate cancer by a novel dietary diterpene carnosol: implications for chemoprevention. Cancer Prev Res (Phila) 2010;3:1112–1123. doi: 10.1158/1940-6207.CAPR-10-0168. [DOI] [PMC free article] [PubMed] [Google Scholar]
- 23.Saksena S, Goyal S, Raheja G, Singh V, Akhtar M, et al. Upregulation of P-glycoprotein by probiotics in intestinal epithelial cells and in the dextran sulfate sodium model of colitis in mice. Am J Physiol Gastrointest Liver Physiol. 2011;300:G1115–1123. doi: 10.1152/ajpgi.00027.2011. [DOI] [PMC free article] [PubMed] [Google Scholar]
- 24.Johnson JJ, Nihal M, Siddiqui IA, Scarlett CO, Bailey HH, et al. Enhancing the bioavailability of resveratrol by combining it with piperine. Mol Nutr Food Res. 2011;55:1169–1176. doi: 10.1002/mnfr.201100117. [DOI] [PMC free article] [PubMed] [Google Scholar]
- 25.Lambert JD, Hong J, Kim DH, Mishin VM, Yang CS. Piperine enhances the bioavailability of the tea polyphenol (−)-epigallocatechin-3-gallate in mice. J Nutr. 2004;134:1948–1952. doi: 10.1093/jn/134.8.1948. [DOI] [PubMed] [Google Scholar]
- 26.Shoba G, Joy D, Joseph T, Majeed M, Rajendran R, et al. Influence of piperine on the pharmacokinetics of curcumin in animals and human volunteers. Planta Med. 1998;64:353–356. doi: 10.1055/s-2006-957450. [DOI] [PubMed] [Google Scholar]
- 27.Lin JH. Dose-dependent pharmacokinetics: experimental observations and theoretical considerations. Biopharm Drug Dispos. 1994;15:1–31. doi: 10.1002/bdd.2510150102. [DOI] [PubMed] [Google Scholar]
- 28.Nagao A. Absorption and function of dietary carotenoids. Forum Nutr. 2009;61:55–63. doi: 10.1159/000212738. [DOI] [PubMed] [Google Scholar]


