

Summary
Background
Hemoglobin A1c, (HbA1c) which is the major constituent of glycated hemoglobin, has been used in the follow-up of retrospective glycemia for years and in the diagnosis of diabetes mellitus nowadays. Since the analytical performance of HbA1c should be high likewise all laboratory tests, various quality control measures are used. Sigma metrics is one of these measures and it is the combination of bias, precision and total allowable error that ensures a general evaluation of analytical quality. The aim of our study was to evaluate the analytical performance of Bio-Rad’s Variant Turbo II HbA1c analyzer according to sigma metrics.
Methods
Sigma levels were calculated using the data obtained from two levels of internal and 12 external quality control materials (Bio-Rad) of Variant II Turbo HbA1c analyzer according to σ = (TEa% - Bias%) / CV% formula.
Results
The mean sigma levels for low and high quality control materials were found to be 3.0 and 4.1, respectively.
Conclusions
The annual mean analytical performance of Variant II Turbo HbA1c analyzer was found to be acceptable according to sigma metrics. In order to be sure of the difference in HbA1c results indicating the success or failure in treatment but not arise from analytical variation, it is thought that more stringent quality control measures should be applied to reach higher sigma levels.
Keywords: HbA1c, sigma, total allowable error
Kratak sadržaj
Uvod
Hemoglobin A1c (HbA1c) koji je glavni sastojak glikoziliranog hemoglobina koristi se za procenu glikemije godinama kao i za dijagnostikovanje dijabetes mellitusa danas. S obzirom da anlitička izvodljivost HbA1c mora da bude jako visoka kao i kod drugih analitičkih testova, za procenu se koriste različite vrste kontrolnih procedura. Sigma metriks je jedna od takvih mera i kombinuje se sa odstupanjem, preciznošću i ukupno dozvoljivom greškom što osigurava visok analitički kvalitet. Svrha ovog rada je bila da se proceni analitička izvodljivost Bio-Rad Variant Turbo II HbA1c analizatora prema Sigma metriks.
Metode
Vrednosti Sigma su računate korišćenjem podataka dobijenih iz dva nivoa internih i 12 eksternih kontrola kvaliteta (Bio-Rad) za Variant II Turbo Analizator HbA1c prema for-muli σ = (TEa% -Bias%)/CV%.
Rezultati
Glavni Sigma nivoi za niski i visoki kontrolni materijal su bili 3,0, odnosno 4,1.
Zaključak
Nađeno je da je godišnja analitička izvodljivost Variant Turbo HbA1c analizatora bila prihvatljiva shodno Sigma matriksu. Da bi bili sigurni da razlike u rezultatima HbA1c potiču od propusta u tretmanu pacijenta, a ne od analitičkih varijacija potrebno je spovoditi intenzivnu kontrolu kvaliteta kako bi se postigli visoki Sigma nivoi.
Ključne reči: HbA1c, Sigma, ukupno dozvoljiva greška
Introduction
Hemoglobin A1c, (HbA1c) which is the major constituent of glycated hemoglobin, has been used in the follow-up of retrospective glycemia for years and in the diagnosis of diabetes mellitus nowadays (1, 2). As the relationship between glycemic control, HbA1c and complications related to diabetes mellitus was clearly shown, HbA1c test has gained a great importance (3, 4). By the help of the steps taken towards accurate measurement of HbA1c levels, a big progress was made in separation techniques in addition to immunoassay and enzymatic techniques (5). The target of these technological developments is to measure HbA1c levels accurately which will facilitate the monitoring the treatment of diabetes patients and diagnosis of diabetes mellitus.
As 0.5% change in HbA1c level is considered as a clinically significant change (6, 7), accurate measurement of HbA1c is crucial. Therefore, when making a clinical decision it is important to be sure that a change at HbA1c level is not due to analytical variation (6). In order to achieve this, medical laboratories use quality control programs. Proximity of the result of the internal and external quality controls to target value determines the accuracy of HbA1c test results. Data of quality control results carried out to determine systematic or random mistakes play a crucial role in quality controls in accuracy of measurements. Low bias (B) and coefficient of variation values (CV) are indicators of a good analytical performance. The CV derived from the internal quality control of the HbA1c analyzer should be less than 2% (8, 9). In the case that CV is higher than 2%, accuracy of 0.5% change in patient’s HbA1c level may be unreliable (6). Therefore, in evaluating the analytical performance, more stringent quality control rules should be applied. Six sigma has been used in laboratories in the recent years in order to evaluate analytical performance (10). Sigma is calculated using CV, B and total allowable error (TEa), and Six-sigma allows 3.4 defects per million (11). With the aid of Six Sigma principles, it is possible to reach the desired quality in laboratory testing processes and measurements (12).
The aim of this study is to evaluate the analytical performance of Variant II Turbo HbA1c analyzer according to sigma metrics.
Materials and Methods
The study was made in Medical Biochemistry Laboratory of Bozyaka Research and Education Hospital between January-December 2015. One year HbA1c internal and external quality control data were collected for further statistical analysis.
Whole blood HbA1c testing was made by Variant II Turbo HbA1c analyzer (Bio-Rad Laboratories, Hercules, CA, USA) with the Variant II Turbo HbA1c kit from the same manufacturer which uses cation exchange high performance liquid chromatography.
Between run CV for normal and diabetic patients were 0.66% and 0.69%, respectively which were determined in a precision study that was written in the instruction manual of Variant II Turbo HbA1c Kit-2.0.
Two levels of internal quality control (IQC) materials were used daily with mean values 5.3% (range: 4.70–5.90%) and 9.8% (range: 8.60–11.0%) for Level 1 and Level 2, respectively (Lyphocheck Diabetes Control, Level 1 and Level 2, Bio-Rad Laboratories, Irvine, CA, USA). The lot number of the controls was same with the same mean values all the year. These ICQ materials were used every day before the routine determinations.
Monthly External Quality Assurance Service (EQAS) was provided from Bio-Rad (Hemoglobin Program, Cycle 12) which consisted of 4 different concentrations. Our peer group consisted of at least 88 participants each month.
Statistical analysis
The mean, the standard deviation (SD) and coefficient of variation (CV)% levels were calculated every month from a total of 239 level 1 and 239 level 2 IQC data of 12 months between January-December 2015 by using SPSS 21.0 (SPSS Inc., Chicago, IL, USA) statistical program.
Monthly bias% was calculated from 12 External Quality Assessment (EQA) data which was performed monthly (Bio-Rad) by the following formula: [(our result – peer group mean)/peer group mean] x 100. The mean bias was calculated by dividing bias% with 12.
In calculation of sigma values, 6% was used as TEa level which was suggested by both National Glycohemoglobin Standardization Program (NGSP) and Coll ege of American Pathologists (CAP) (13). The sigma values were calculated with the following formula: »sigma = (TEa% – Bias%) / CV%« (13). The analytical performance of Variant II Turbo HbA1c analyzer was evaluated according to obtained sigma levels.
Results
The results are considered on monthly basis and separately for each level of control material and are presented in Tables I and II. The mean, SD, CV% of level 1 and level 2 control results are shown in Table I. The mean CVs were 1.70% and 1.33% for level 1 and level 2, respectively. The Bias % of 12 EQAS results is shown in Table I The mean bias was 1.46%.
Table I.
Mean, SD, CV% and Bias% values on monthly basis.
| Months | Level 1 IQC Mean: 5.3% (4.7%–5.9%) | Level 2 IQC Mean: 9.8% (8.6%–11.0%) | EQAS | |||||
|---|---|---|---|---|---|---|---|---|
| Mean | SD | CV% | Mean | SD | CV% | B | B% | |
| January | 5.3 | 0.03 | 0.55 | 10.0 | 0.07 | 0.65 | 0.01 | 1.21 |
| February | 5.4 | 0.07 | 1.34 | 9.7 | 0.17 | 1.78 | 0.02 | 1.98 |
| March | 5.4 | 0.19 | 3.46 | 9.8 | 0.25 | 2.53 | 0.00 | 0.44 |
| April | 5.4 | 0.10 | 1.93 | 9.7 | 0.09 | 0.89 | 0.03 | 2.53 |
| May | 5.2 | 0.10 | 2.00 | 9.7 | 0.09 | 0.96 | 0.01 | 1.00 |
| June | 5.4 | 0.12 | 2.14 | 9.6 | 0.13 | 1.40 | 0.03 | 2.66 |
| July | 5.5 | 0.08 | 1.43 | 9.8 | 0.22 | 2.19 | 0.02 | 2.47 |
| August | 5.5 | 0.12 | 2.24 | 9.9 | 0.08 | 0.84 | 0.01 | 0.93 |
| September | 5.5 | 0.09 | 1.68 | 9.9 | 0.08 | 0.86 | 0.02 | 1.62 |
| October | 5.4 | 0.09 | 1.75 | 9.7 | 0.14 | 1.47 | 0.01 | 0.73 |
| November | 5.5 | 0.13 | 2.37 | 9.7 | 0.07 | 0.74 | 0.02 | 1.71 |
| December | 5.6 | 0.06 | 1.16 | 9.9 | 0.16 | 1.62 | 0.00 | 0.19 |
Abbreviations: SD: standard deviation, CV: coefficient of variation, IQC: internal quality control, EQAS: External Quality Assurance Service.
Table II.
Sigma levels for Level 1 and Level 2 controls.
| Sigma (σ) (TEa=6%) | |||
|---|---|---|---|
| Level 1 | Level 2 | ||
| January | 8.7 | 7.4 | |
| February | 3.0 | 2.3 | |
| March | 1.6 | 2.2 | |
| April | 1.8 | 3.9 | |
| May | 2.5 | 5.2 | |
| June | 1.6 | 2.4 | |
| July | 2.5 | 1.6 | |
| August | 2.3 | 6.0 | |
| September | 2.6 | 5.1 | |
| October | 3.0 | 3.6 | |
| November | 1.8 | 5.8 | |
| December | 5.0 | 3.6 | |
Abbreviations: TEa: total error allowable.
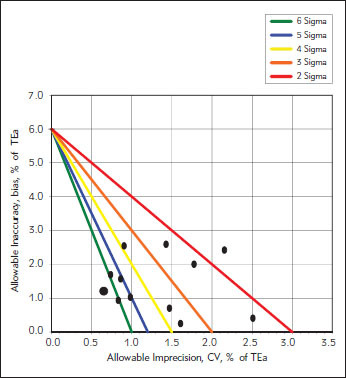
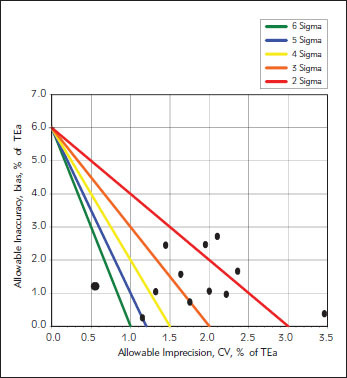
The calculated sigma levels are shown in Table II and presented in Figures II and III. The mean sigma levels were 3.0 and 4.1 for level 1 and level 2, respectively.
Figure 2.
Normalized sigma metric method decision chart for level 2 controls.
Discussion
As several scientific studies such as Diabetes Control and Complications Trial (DCCT), Epidemiology of Diabetes Intervention and Complications (EDIC) and United Kingdom Prospective Diabetes Study (UKPDS) have shown the relationship between glycemic control and complications related to diabetes mellitus clearly, HbA1c test which is an indicator of long term glycemic control has gained great importance (6, 8).
One of the main conditions of accurate measurement of HbA1c is to be in the allowable range in quality control studies and to narrow these ranges even further. The studies on the evaluation of analytical performance of HbA1c analyzers through sigma metrics are very limited in the literature (13, 14, 15). The use of sigma metrics could allow the measurement of HbA1c to be brought up to international standards. This will help clinicians to use HbA1c results with confidence for monitoring the treatment of diabetes patients and diagnosis of diabetes mellitus. According to the study on the development of quality control targets on measurements of HbA1c carried out by International Federation of Clinical Chemistry (IFCC) Task Force, sigma metrics model should be preferred and it was determined that sigma level should be at least 2 for HbA1c measurements in routine laboratories (14). According to the results of our study, Variant II Turbo HbA1c Analyzer that is used for routine HbA1c measurements in our laboratory is shown to have sigma level of 3 which is higher than the suggested level. In a survey conducted by CAP, the performance of 26 examination subgroups obtained from a total of 3187 laboratories was evaluated and it was seen that about two thirds of the method subgroups demonstrated quality of 2 sigma or less (15). EQAS data from 137 laboratories in Netherlands revealed that 70.1% of the laboratories met the criteria for sigma greater than 2 with a TEa of 6%. In the same study, mean sigma level of Variant II Turbo users was 1.3 (16). The performance of HbA1c analyzers in China was investigated and the results showed that 65.2% of participating 135 laboratories had sigma levels below 3 with a TEa of 8%, including Bio-Rad Variant systems (17). In a study carried out in Turkey, the sigma level for another HbA1c analyzer was found to be 1.19 calculated with a TEa of 10% which means lower sigma levels with TEa of 6%. (18). These results show that the Variant II Turbo HbA1c Analyzer that we use in our laboratory has a higher annual analytical performance than many of the other analyzers used worldwide. The high performance of Variant II Turbo HbA1c Analyzer has been observed in both level controls, especially in level 2 (Table II, Figures 1 and 2).
Figure 1.
Normalized sigma metric method decision chart for level 1 control.
According to the results of the evaluation of monthly sigma levels, we saw that sigma values in January are high. This may be due to the novelty of the Variant II Turbo HbA1c Analyzer. Since the analyzer was new and firstly used in our laboratory, all its adjustments were so fine that its measurements were perfect. The CV%’s of both IQC levels in January were 0.55 and 0.65, respectively and the bias was 0.01 which altogether resulted high sigma levels. As higher sigma levels mean better analytical performance, we thought that there is no problem.
It was also seen that sigma levels for the first control level in March, April, June and November and for second control level in July were lower than the targeted sigma level which is 2. When we searched the reason of low sigma levels in these months, it was observed that CV levels derived from the results of the internal quality control carried out in March, April, June and November for the first control level were 3.46%, 1.93%, 2.14% and 2.37%, respectively. For second control level CV in July was 2.19%. Observed Bias levels for March, April, June, July and November were 0.44%, 2.53%, 2.66%, 2.47% and 1.71%, respectively. We think that high CV levels combined with high bias in these months are the reason of low sigma levels. However our laboratory is not the only one obtained high CV levels. In a study carried out to evaluate the analytical performance of Variant II Turbo analyzer, CV was found to be 2.97% for low quality control and 1.81% for high quality control (13). These values are higher than the yearly average CV% that is observed in our study (Table I). In the CAP survey, the average subgroup CVs observed were 2.87%, 2.81% and 2.71% for three different control levels, respectively (15). At the same survey, the average CVs of 151 laboratories using Bio-Rad Variant II Turbo were 2.5%, 2.2% and 2.2% which are also higher than our laboratory mean CVs (NGSP web site). Analyzing the quality control results helped us to understand the reason why sigma levels were low in these months. Even though the results obtained from internal quality controls were very close to the mean, small deviations in measurements impact CV levels to increase. Therefore, it was understood that why optimal CV level should be lower than 2% (19, 20) and the bias should be as low as possible.
The clinicians should feel certain that the change in HbA1c result compared to previous measurement, provided by laboratory specialist, is the indicator of treatment success or failure but not due to the analytical variations in HbA1c measurement. To achieve this, HbA1c analyzer should have a high analytical performance. The fact that Variant II Turbo HbA1c analyzer that is used in our laboratory has been shown to have an acceptable mean sigma level, creates confidence on our HbA1c results provided by our laboratory. This will enable us to contribute to prevention or delay of any complication that may arise due to the strategy changes of the treatment carried out based on HbA1c levels. This target can be achieved through obtaining appropriate sigma levels.
Acknowledgments
No conflict of interest.
Footnotes
Conflict of interest statement
The authors stated that they have no conflicts of interest regarding the publication of this article.
References
- 1.American Diabetes Association. Standards of medical care in diabetes. Diabetes Care. 2010;33:S11. doi: 10.2337/dc10-S011. –. [DOI] [PMC free article] [PubMed] [Google Scholar]
- 2.International Expert Committee. International expert committee report on the role of the A1C assay in the diagnosis of diabetes. Diabetes Care. 2009;32:1327. doi: 10.2337/dc09-9033. –. [DOI] [PMC free article] [PubMed] [Google Scholar]
- 3.White NH, Sun W, Cleary PA, Tamborlane WV, Danis RP, Hainsworth DP. Effect of prior intensive therapy in type 1 diabetes on 10-year progression of retinopathy in the DCCT/EDIC: comparison of adults and adolescents. Diabetes. 2010;59:1244. doi: 10.2337/db09-1216. et al. –. [DOI] [PMC free article] [PubMed] [Google Scholar]
- 4.John G, English E. IFCC standardized HbA1c: should the world be as one? Clin Chem Lab Med. 2012;50:1243. doi: 10.1515/cclm-2011-0853. –. [DOI] [PubMed] [Google Scholar]
- 5.Weykamp C, John WG, Mosca A. A review of the challenge in measuring hemoglobin A1c. J Diabetes Sci Technol. 2009;3:439. doi: 10.1177/193229680900300306. –. [DOI] [PMC free article] [PubMed] [Google Scholar]
- 6.Little RR, Rohlfing CL, Sacks DB. Status of hemoglobin A1c measurement and goals for improvement: from chaos to order for improving diabetes care. Clin Chem. 2011;57:205. doi: 10.1373/clinchem.2010.148841. –. [DOI] [PubMed] [Google Scholar]
- 7.Little RR, Rohlfing CL. The long and winding road to optimal HbA1c measurement. Clinica Chimica Acta. 2013;418:63. doi: 10.1016/j.cca.2012.12.026. –. [DOI] [PMC free article] [PubMed] [Google Scholar]
- 8.Weykamp C. HbA1c: a review of analytical and clinical aspects. Ann Lab Med. 2013;33:393. doi: 10.3343/alm.2013.33.6.393. –. [DOI] [PMC free article] [PubMed] [Google Scholar]
- 9.Sacks DB, Arnold M, Bakris GL, Bruns DE, Horvath AR, Kirkman MS. Executive summary: guidelines and recommendations for laboratory analysis in the diagnosis and management of diabetes mellitus. Clin Chem. 2011;57:793. doi: 10.1373/clinchem.2011.163634. et al. –. [DOI] [PubMed] [Google Scholar]
- 10.Milenković N, Ignjatović S, Šumarac Z, Majkić-Singh N. Uncertainty of measurement im laboratory medicine. J Med Biochem. 2018;37:279. doi: 10.2478/jomb-2018-0002. –. [DOI] [PMC free article] [PubMed] [Google Scholar]
- 11.Westgard JO, Westgard SA. The Quality of Laboratory Testing Today: An assessment of sigma metrics for analytic quality using performance data from proficiency testing surveys and the clia criteria for acceptable performance. Am J Clin Pathol. 2006;125:343. –. [PubMed] [Google Scholar]
- 12.Nar R, Emekli ID. The evaluation of analytical performance of immunoassay tests by using six-sigma method Nar R, Emekli DI. J Med Biochem. 2017;36:301. doi: 10.1515/jomb-2017-0026. –. [DOI] [PMC free article] [PubMed] [Google Scholar]
- 13.Woodworth A, Korpi-Steiner N, Miller JJ, Rao LV, Yundt-Pacheco J, Kuchipudi L. Utilization of assay performance characteristics to estimate hemoglobin A1c result reliability. Clin Chem. 2014;60:1073. doi: 10.1373/clinchem.2013.220772. et al. –. [DOI] [PubMed] [Google Scholar]
- 14.Weykamp C, John G, Gillery P, English E, Ji L, Lenters-Westra E. Investigation of 2 models to set and evaluate quality targets for HbA1c: biological variation and sigma-metrics. Clin Chem. 2015;61:752. doi: 10.1373/clinchem.2014.235333. et al. –. [DOI] [PMC free article] [PubMed] [Google Scholar]
- 15.Westgard JO, Westgard SA. Assessing quality on the sigma scale from proficiency testing and external quality assessment surveys. Clin Chem Lab Med. 2015;53:1531. doi: 10.1515/cclm-2014-1241. –. [DOI] [PubMed] [Google Scholar]
- 16.Lenters-Westra E, English E. Understanding the use of sigma metrics in hemoglobin A1c analysis. Clin Lab Med. 2017;37:57. doi: 10.1016/j.cll.2016.09.006. –. [DOI] [PubMed] [Google Scholar]
- 17.Zhao HJ, Zhang TJ, Zeng J, Hu CH, Ma R, Zhang CB. Investigation and analysis of HbA1c measurement systems’ performance for 135 laboratories in China. Chin Med J. 2017;130:1079. doi: 10.4103/0366-6999.204932. –. [DOI] [PMC free article] [PubMed] [Google Scholar]
- 18.Huysal K, Budak YU. Application of sigma metrics for the assessment of quality assurance using the MQ-2000 PT HbA1c analyzer. Biochem Med. 2015;25:416. doi: 10.11613/BM.2015.042. –. [DOI] [PMC free article] [PubMed] [Google Scholar]
- 19.Braga F, Dolci A, Montagnana M, Pagani F, Paleari GC, Guidi GC. Revaluation of biological variability of glycated haemoglobin using an accurately designed protocol and assay traceable to the IFCC reference system. Clin Chim Acta. 2011;412:1412. doi: 10.1016/j.cca.2011.04.014. et al. –. [DOI] [PubMed] [Google Scholar]
- 20.Goodall I, Colman PG, Schneider HG, McLean M, Barker G. Desirable performance standards for HbA1c analysis– precision, accuracy and standardization: Consensus statement of the Australian Association of Clinical Biochemists (AACB), the Australian Diabetes Society (ADS), the Royal College of Pathologists of Australia (RCPA, Endocrine Society of Australia (ESA), and the Australian Diabetes Educators Association (ADEA) Clin Chem Lab Med. 2007;45:1083. doi: 10.1515/CCLM.2007.158. –. [DOI] [PubMed] [Google Scholar]