

Abstract
Many biological functions performed by RNAs arise from their in vivo structures. The structure of the same RNA can differ in vitro and in vivo owing in part to the influence of molecules ranging from protons to secondary metabolites to proteins. Chemical reagents that modify the Watson–Crick (WC) face of unprotected RNA bases report on the absence of base-pairing and so are of value to determining structures adopted by RNAs. Reagents have thus been sought that can report on the native RNA structures that prevail in living cells. Dimethyl sulfate (DMS) and glyoxal penetrate cell membranes and inform on RNA secondary structure in vivo through modification of adenine (A), cytosine (C), and guanine (G) bases. Uracil (U) bases, however, have thus far eluded characterization in vivo. Herein, we show that the water-soluble carbodiimide 1-ethyl-3-(3-dimethylaminopropyl)carbodiimide (EDC) is capable of modifying the WC face of U and G in vivo, favoring the former nucleobase by a factor of ∼1.5, and doing so in the eukaryote rice, as well as in the Gram-negative bacterium Escherichia coli. While both EDC and glyoxal target Gs, EDC reacts with Gs in their typical neutral state, while glyoxal requires Gs to populate the rare anionic state. EDC may thus be more generally useful; however, comparison of the reactivity of EDC and glyoxal may allow the identification of Gs with perturbed pKas in vivo and genome-wide. Overall, use of EDC with DMS allows in vivo probing of the base-pairing status of all four RNA bases.
Keywords: EDC, 1-ethyl-3-(3-dimethylaminopropyl)carbodiimide, RNA structure, in vivo RNA probing
INTRODUCTION
Structures of RNAs are essential to every step of gene regulation. During the eukaryotic mRNA lifecycle, structure regulates alternative polyadenylation and splicing (Ding et al. 2014), is integral to miRNA maturation (Teixeira et al. 2004; West et al. 2004), modulates mRNA turnover (Wan et al. 2012), and contributes to translational control (Kumari et al. 2007; Kwok et al. 2015a). RiboSNitches that affect RNA structure and are associated with disease phenotypes (Wan et al. 2014) illustrate the importance of RNA structure to human health. Catalytic RNAs, such as self-splicing introns and RNase P, are examples wherein a highly specific structure is requisite for biological function (Guerrier-Takada et al. 1983; Zaug and Cech 1986; Fedorova and Zingler 2007; Mitchell and Russell 2014). Prokaryotes also possess an abundance of mechanisms of structure-based gene regulation. For example, in transcription attenuation, terminator structures halt transcription of the operon, while antiterminator structures reverse this effect (Yanofsky 1981; Babitzke 1997; Naville and Gautheret 2010). Ligand-binding riboswitches can exert control of gene expression at the transcriptional and translational level, enabling facile response to altered metabolic states (Winkler et al. 2002; Peselis and Serganov 2014), while specific RNA-based thermometers in 5′-UTRs control translation in response to temperature (Altuvia et al. 1989; Kortmann et al. 2011; Barnwal et al. 2016). These examples demonstrate the essential nature of RNA structure to both eukaryotes and prokaryotes, and motivate development of methodologies to reveal RNA structure, particularly as it prevails in vivo.
Traditionally, probes of RNA structure in vitro include both enzymes that cleave the RNA backbone specifically at single- or double-stranded regions, and chemicals that modify RNA in a structure-specific manner. Because enzymes are essentially membrane-impermeant, in vivo methods of RNA structure determination have relied on chemical reagents that can enter living cells. These reagents, which tend to be small, hydrophobic, and neutral compounds, covalently modify nucleotides to allow retention of in vivo structural information after the RNA is extracted (Bevilacqua and Assmann 2018). Covalent modification at certain positions terminates reverse transcription (RT), allowing identification of the modified nucleotide one base upstream of the site of the RT stop. This strategy was originally applied to individual RNA species, with RT stops read out by primer extension followed by denaturing PAGE. More recently, this strategy has been coupled with next-generation sequencing techniques to provide a global snapshot of the RNA structurome (Kwok et al. 2015b; Bevilacqua et al. 2016).
Reagents that modify different positions of the nucleotides have been used in in vivo structure-probing. SHAPE reagents, which react with the ribose sugar, have the advantage of modifying all four nucleotides, and can provide structural information because reactivity is strongly diminished by base-pairing (Merino et al. 2005). While the original SHAPE reagents are not strongly membrane-permeant, the SHAPE reagent NAI crosses cell membranes, allowing in vivo application (Spitale et al. 2013; Lee et al. 2017). Other reagents modify the Watson–Crick (WC) face of nucleotides such that the presence of reactivity directly indicates that the nucleotide is not engaged in standard base-pairing or interaction with proteins. Dimethyl sulfate (DMS) alkylates the N1 of adenines (A) and the N3 of cytosines (C) and was the first reagent used to provide a genome-wide picture of the RNA structurome (Ding et al. 2014; Rouskin et al. 2014). Recently, our laboratory developed glyoxal and its hydrophobic derivatives, methylglyoxal and phenylglyoxal, as in vivo probes that block RT through modification of the WC amidine functionality of guanine (G), with significant but lesser reactivity on the amidine faces of A and C (Mitchell et al. 2018). Methyl- and phenylglyoxal proved more effective than glyoxal, likely because their more hydrophobic character allows increased permeation through the lipid bilayer. Finally, the recently developed LASER reagent nicotinoyl azide (NAz) reacts via a light-triggered nitrene at the C8 position of purines, which is away from the WC face, and induces an RT stop (Feng et al. 2018). This reagent is of special interest because it is sensitive to protein protection and tertiary structure but is not generally influenced by base-pairing.
Missing within this arsenal of in vivo structure-probing reagents is one that modifies the WC face of uracils (U), which make unique and important contributions to RNA structure. For instance, A–U pairing in the 3′-UTR is especially important in gene regulation (Wan et al. 2012; Rabani et al. 2017). Moreover, U tends to pair with both A and G, making absence of U base-pairing particularly notable. The carbodiimide 1-cyclohexyl-3-(2-morpholinoethyl)-carbodiimide methyl-p-toluenesulfonate (CMCT) has been used for many years to probe Us and Gs in vitro (Harris et al. 1995; Ziehler and Engelke 2001), but is not generally amenable to in vivo work. Cellular application of CMCT has been described but requires either sonication, cell lysates, or cell-damaging agents such as DMSO, high concentrations of CaCl2, or sodium borate (Noller and Chaires 1972; Harris et al. 1995; Balzer and Wagner 1998; Antal et al. 2002; Incarnato et al. 2014). Therefore, currently only As, Cs, and Gs can be probed directly in vivo without cellular damage.
In this work, we demonstrate that the water-soluble carbodiimide 1-ethyl-3-(3-dimethylaminopropyl)carbodiimide (EDC) can enter intact, nonpermeabilized cells and react with the WC face of Us and Gs in RNAs with high specificity. EDC is a common reagent that is often used to catalyze the formation of peptide bonds (Wiliams and Ibrahim 1981; Nakajima and Ikada 1995; Madison and Carnali 2013). We show that EDC can enter intact plant and bacterial cells without previous disruption of the cell wall or cell membrane and covalently modify accessible Us and Gs on the WC face at neutral pH, marking novel use of this reagent as a valuable in vivo RNA secondary structure probe. Paired with glyoxal, EDC also provides a probe for identifying pKa-perturbed Gs in vivo and genome-wide.
RESULTS AND DISCUSSION
While in vitro reactions with RNA-modifying reagents typically are inapplicable to a biological context, they can often provide valuable information on the efficacy of the reagent and conditions for in vivo probing. We initially determined the U modification activity of the carbodiimide EDC in vitro, using primer extension and denaturing PAGE of rice 5.8S rRNA. Selected buffers spanned a pH range of 6–9.2 and contained 50 mM K+ and 0.5 mM Mg2+ to mimic typical cytoplasmic cation concentrations (Walker et al. 1996; Karley and White 2009; Gout et al. 2014). In the examined region of G53 to C143, EDC displayed robust and specific modification of Us and Gs to different extents that reflect RNA structure (Fig. 1A; also see Supplemental Fig. S1, where the same EDC concentrations are tested for a shorter reaction time). EDC did not modify any As or Cs throughout the examined region, consistent with the known chemistry of carbodiimide reagents (Fig. 2). Increasing the concentration of EDC increased the extent of reaction and resulted in several new sites (Fig. 1B).
FIGURE 1.

In vitro modification of rice 5.8S rRNA by EDC analyzed by denaturing page of cDNAs after reverse transcription. (A) Reactions with the indicated EDC concentrations for 5 min. Dideoxy sequencing lanes, a control reaction lacking EDC, and reactions with EDC are shown. Blue text to the left indicates nucleotides within the sequence of the examined range of G53 to C143. (B) Reactive nucleotides in either 57 mM or 85 mM EDC mapped as hexagons and circles, respectively, onto the relevant portion of the rice 5.8S rRNA comparative structure. Colors indicate the level of modification for nucleotides exceeding the calculated significance value for which a base is considered modified (defined in Materials and Methods) after normalization and scaling such that all values fall between 0 and 1.
FIGURE 2.
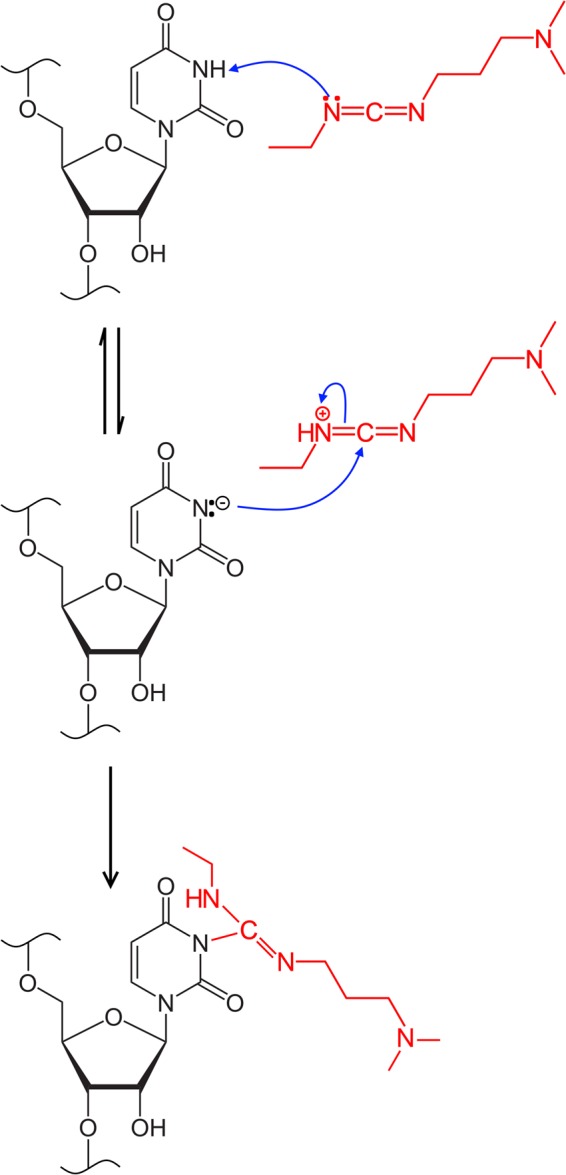
Reaction scheme for base modification by EDC, shown in red. In the first step, EDC abstracts a proton from the endocyclic N3 of U. The resulting anionic lone pair on the nucleobase attacks the cationic carbodiimide moiety, leading to neutralization and covalent attachment of the EDC adduct to the base. EDC reacts with the endocyclic N1 of G in a similar fashion.
In comparing our current in vitro studies of EDC to our in vitro study of glyoxal (Mitchell et al. 2018), we found that ∼10× more EDC was required to achieve observable base modifications in the same timeframe of 5 min (2.5 mM for glyoxal, methylglyoxal, and phenylglyoxal vs. >28 mM for EDC). Notably, EDC concentrations above 85 mM led to excessive modification of the RNA and resultant loss of single-hit kinetics (Fig. 1A). We observed a slight pH dependence for in vitro EDC reactivity when using low (28 mM) concentrations of EDC; reactions at pH 6 (Supplemental Fig. S2) and pH 7 (Fig. 3; also see Supplemental Fig. S2) gave no observed modifications while reactions at pH 8 or pH 9.2 resulted in modifications, which might reflect deprotonation of the carbodiimide moiety (Fig. 3; also see Supplemental Fig. S2). Notably, increasing the EDC concentration eliminated this pH dependence. Finally, across all of the in vitro conditions tested, while EDC readily modifies both Us and Gs, it appears to favor modification of Us by a factor of ∼1.6.
FIGURE 3.

In vitro EDC modification of rice 5.8S rRNA at various pH and EDC concentrations. (A) Denaturing PAGE analysis of cDNAs generated after RT. Reaction conditions at pH 7, pH 8, and pH 9.2 are shown along with dideoxy sequencing lanes. (B) Comparison of band intensities for all Us and Gs within the examined range of G55 to G138; reactions at 113 mM EDC are excluded due to excessive modification of the RNA. Colored boxes represent U or G modification above the calculated significance value (S); green boxes represent S to 3 S; yellow boxes represent >3 S to 6 S; orange boxes represent >6 S to 10 S; and dark red boxes represent >10 S. White boxes represent Us or Gs that are not significantly modified by EDC.
Interestingly, one intense region of EDC reactivity aligns with a long-range phylogenetically predicted four base helical strand containing U104 to G107, and another is found along a local stem–loop spanning G111 to G119 (Figs. 1, 3). For the long-range pairing, U106 forms a wobble pair with G46, and G107 forms a sheared pair with A45 (Heus and Pardi 1991; SantaLucia and Turner 1993). The sheared G–A pair exposes the WC face of the G to EDC, while the G•U wobble is significantly weaker than WC base pairs (Turner 2000). The two remaining base pairs are A–U pairs, which are relatively weak leading to a high probability of transient unwinding of the helix, which would allow access to EDC. For the local stem–loop of G111 to G119, while U117 is shown paired with A113 in the secondary structure derived from comparative analysis (Cannone et al. 2002; Gutell et al. 2002), it is unpaired and flipped outward in the homologous yeast cryo-EM structure (see Supplemental Fig. S3; Schmidt et al. 2016). This is not unlike the highly reactive G107 being flipped out in its sheared base pair. On the other hand, the 10-bp stem–loop spanning G120 to C143, analogous to the G-C rich 9-bp stem–loop in the yeast cryo-EM structure, did not give any modifications except for a single base in the loop (Fig. 1B), indicating that Gs in strong helices do not react with EDC.
Upon determining that EDC specifically modified Us and Gs in vitro, we next exposed rice tissue to EDC to test whether the reagent could probe RNA structure within intact cells without artificially permeabilizing the cell wall or membrane with detergents or other reagents (Holmberg et al. 1994; Incarnato et al. 2014). As in our previous study with glyoxal and its derivatives, we incubated the excised shoots of 2-wk-old rice seedlings for 15 min in buffers containing 50 mM K+, 0.5 mM Mg2+, and EDC ranging from 113 to 565 mM. Similar to the aforementioned in vitro results, EDC modified almost all Us and Gs within single-stranded loops and weak helices when probing 5.8S rRNA in vivo (Fig. 4A). No modification is observed at As or Cs, indicating that EDC is base specific in vivo. EDC concentrations above 283 mM led to a sharp decrease in the intensity of the full-length band and of the bands for many of the modified nucleotides (Fig. 4A), indicating excessive modification. As such, all subsequent in vivo experiments in rice used a maximum EDC concentration of 283 mM. Similar to the in vitro conditions tested above, varying the external buffer pH from 6 to 9.2 had no effect on modifications in 113 mM and 283 mM EDC (Fig. 4B). Again, EDC preferably reacted with U over G, with a U-to-G reactivity ratio of 1.4 in vivo, similar to the value of 1.6 found in vitro. Varying the EDC reaction time from 2 min to 10 min revealed a time dependence for in vivo base modification, with increasing reactivity observed at longer times (Fig. 4C; also see quantitation of reactivity time dependence in Supplemental Fig. S4B).
FIGURE 4.

In vivo EDC modification of rice 5.8S rRNA analyzed by denaturing PAGE of cDNAs after RT. (A) Reaction conditions at buffer pH 8 with 113 mM, 283 mM, and 565 mM EDC are shown along with dideoxy sequencing lanes. (B) Reaction conditions at buffer pH from 6 to 9.2 and at 113 mM or 283 mM EDC are shown along with dideoxy sequencing lanes. Reactions with 113 mM EDC at buffer pH 9.2 are shown twice, in lanes 12 and 13. (C) Reaction conditions at buffer pH 7 and 283 mM EDC with 2 min, 5 min, and 10 min durations are shown along with dideoxy sequencing lanes. The sequencing lanes were run on a different portion of the same gel as the experimental lanes, as indicated by the gray brackets.
In vivo probing of both rice 5.8S rRNA (Fig. 5A,B) and 28S rRNA (Fig. 5C,D; also see Supplemental Fig. S5 for additional data on 28S rRNA) reveals EDC modification of almost all unpaired Us and Gs within loops or within or immediately adjacent to relatively unstable helices, confirming that EDC reports on RNA secondary structure. While some nucleotides are denoted as unmodified as a result of uncertainty owing to natural RT stops, the vast majority of unmodified bases form WC base pairs within stable helices. For example, Gs present within helices H16–H20, which are predicted to be base-paired, are not modified by EDC or phenylglyoxal (Fig. 5D). H15 provides a stark illustration of high EDC reactivity within a subregion of an otherwise stable and unreactive helix. Specifically, the subregion G115 to U124 has five noncanonical WC interactions near the base of the stem and is quite reactive with EDC, while the apex of the stem is mostly GC base pairs and is unreactive. Figure 5 and Supplemental Figure S4 confirm by several approaches that the reaction is quenched prior to RNA extraction. Thus, EDC is capable of reporting on RNA secondary structure in vivo.
FIGURE 5.

Comparison of in vivo EDC and phenylglyoxal modification of rice 5.8S and 28S rRNAs analyzed by denaturing PAGE of cDNAs after RT. (A) Comparison of EDC and phenylglyoxal (PG) modification of rice 5.8S rRNA under conditions where either a water wash (W) or 1 g of DTT (D) was used as a reaction quench, along with dideoxy sequencing lanes. Rice tissue not treated with reagent nor subjected to quenching is shown as NRT in lane 11. The three Gs modified by phenylglyoxal are indicated in purple text, while Gs modified by both EDC and phenylglyoxal are in red text. The section from C122 to C133 was run on a different portion of the same gel. (B) Nucleotides reactive with phenylglyoxal or EDC mapped as hexagons or circles, respectively, onto the relevant portion of rice 5.8S rRNA comparative structure. Colors indicate the level of modification after normalization and scaling such that all values fall between 0 and 1. The quench composition (water wash or DTT; see Supplemental Information) had no effect on observed EDC reactivity. (C) Comparison of EDC and phenylglyoxal modification of rice 28S rRNA. Conditions are the same as in panel A. (D) Nucleotides reactive with EDC or phenylglyoxal mapped onto the relevant portion of rice 28S rRNA comparative structure. Red discs indicate nucleotides modified solely by EDC while cyan discs indicate nucleotides modified by both EDC and phenylglyoxal. Data between 280 and 270 are omitted as too close to the primer, which ends at 280.
To test whether EDC can probe RNA structure in vivo within multiple domains of life, we treated Gram-negative E. coli strain MG1655 with EDC and probed 16S rRNA. Examining a range of EDC concentrations from 28 mM to 141 mM revealed that EDC successfully entered cells and modified RNA (Fig. 6A). Treatment with ≥57 mM EDC led to an excessive number of bands upon separation of RT products by denaturing PAGE, including As and Cs that EDC cannot modify, that we attribute to degradation of the RNA. Separation of in vivo EDC-treated total RNA on an agarose gel confirmed degradation of the RNA at ≥57 mM EDC, with the loss of the discrete rRNA bands and the formation of a broad smear (Fig. 6B). Furthermore, treatments with EDC concentrations above 57 mM severely diminished yields from RNA extraction and led to the formation of an unidentified precipitate upon quenching the EDC reaction with DTT.
FIGURE 6.

In vivo EDC modification of E. coli 16S rRNA. (A) EDC concentration assays. Denaturing PAGE analysis of cDNAs generated after RT. Reactions in EDC from 28 mM to 85 mM are shown along with sequencing lanes. Blue text inset in the gel shows the true position of the sequence in relation to the experimental lanes, as part of the sequencing lanes were shifted by a crease in the gel. Red text indicates Gs and Us, while orange text indicates As and Cs. (B) Agarose gel analysis of rRNA extracted from E. coli after treatment with 28 mM to 113 mM EDC. (C) Lower EDC concentration trials. Denaturing PAGE analysis of cDNAs after RT. Reactions in EDC from 6 mM to 28 mM are shown along with sequencing lanes. Red text indicates modified nucleotides. (D) Nucleotides reactive with EDC mapped onto the relevant portion of E. coli 16S rRNA comparative structure. Arrows pointing to the reactive nucleotides show reactions in 17 mM, 23 mM, and 28 mM EDC in separate segments, with the 17 mM EDC segment located closest to the arrow head. The color within each segment indicates the relative extent of modification above the significance value (S).
Based on these initial results, we then tested in vivo modification of E. coli cells in a range of 6 mM to 28 mM EDC. We detected EDC modification specifically at Gs and Us (Fig. 6C). At the tested concentration of 28 mM, EDC favored modification of Us in E. coli, giving a U-to-G ratio of 1.5, similar to the in vitro and in vivo ratios with rice. Lower EDC concentrations resulted in ratios <1, with the value skewed by unusually strong EDC modification of G68—a G that forms a sheared pair with A101 and exposes its WC face in what is apparently a highly reactive conformation, as described above for rice 5.8S rRNA. Upon mapping the modified bases onto the E. coli 16S rRNA secondary structure derived from comparative analysis (Cannone et al. 2002), we observed that the nucleotides with highest EDC reactivity were the sheared G68 and the hairpin loop nucleotides U84, U85, and G86 (Fig. 6D). All other EDC-modified nucleotides are positioned adjacent to bulges (G39, U56, and U70) or are involved in a G•U wobble pair (G62), presumably providing access to modification. Interestingly, EDC did not modify four Gs and Us (G31, G38, U49, and G64) shown as single-stranded within the 16S rRNA secondary structure (Fig. 6D). Examination of the E. coli 70S ribosome crystal structure revealed that the base of G31 and the entirety of U49 are buried within the interior of the ribosome and thus are solvent inaccessible, consistent with their observed lack of modification (see Supplemental Fig. S6). Conversely, G38 and G64 are solvent exposed. However, all four unmodified nucleotides exhibit interactions involving the endocyclic N1 of G or N3 of U that would inhibit deprotonation by EDC (see Supplemental Fig. S6; also see Fig. 2 for EDC reaction scheme). G31 and G38 each are in position to hydrogen bond with the bridging O5′ of C48 and the nonbridging oxygen of A397, respectively, with the bonding distances being ∼3 Å for each pair (see Supplemental Fig. S6). U49 is further protected by base-pairing between its WC face and the sugar edge of G362. A similar interaction exists between the WC face of G64 and the Hoogsteen face of G68 (see Supplemental Fig. S6).
It is of interest to compare the properties of EDC with glyoxal, which also reacts with Gs in vivo (Mitchell et al. 2018). In the G50 to C143 region of rice 5.8S rRNA, EDC modified 34 out of 47 possible nucleotides, consisting of 16 out of 29 Gs and 18 out of 18 Us (Fig. 5B). By comparison, phenylglyoxal only modified three nucleotides (G82, G89, G99) within that same region. The larger examined region for 28S rRNA, spanning from G35 in H11 to C270 just upstream of H21, provides another example of this effect. Here, 54 out of 113 Gs and Us are modified by EDC, consisting of 35 out of 80 Gs and 19 out of 33 Us (Fig. 5D). Conversely, phenylglyoxal only modified three Gs (G121, G134, and G260) within this extended region of 28S rRNA. Only N1-deprotonated anionic Gs can react with glyoxals, since glyoxal is an electrophile, which likely accounts for the lower reactivity of glyoxal compared to EDC. Moreover, Gs typically have a pKa of 9 on the N1, which is further elevated in WC base pairs (Legault and Pardi 1997; Wilcox et al. 2011). Given that the cytosol of most cells is at a pH of ∼7, any sites of glyoxalation may arise from Gs with pKas shifted toward neutrality. When comparing EDC, a nucleophilic reagent that reacts with N1-protonated neutral Gs (Fig. 3), with glyoxal, unpaired Gs with shifted pKas may thus become apparent.
In conclusion, we present a novel application of the water-soluble carbodiimide EDC as an in vivo probe of RNA secondary structure. EDC targets the WC face of unpaired Us and to a lesser extent Gs with high specificity at neutral pH and within intact cells across multiple domains of life. Importantly, EDC finally resolves the information gap that has existed for 30 yr for in vivo structural probing of base-pairing interactions. The combined application of WC-specific probes in EDC and DMS, along with sugar-reactive SHAPE reagents and the C8-A/G reactive reagent NAz, will provide a once-unattainable comprehensive picture of in vivo base-pairing, backbone flexibility, secondary structure formation, and protein protection for all four RNA bases.
MATERIALS AND METHODS
Plant materials and growth conditions
Standard 100 mm × 15 mm petri dishes were inverted and the lids (now on the bottom) were lined with filter paper (VWR; Catalog #28320-187) prior to the addition of ∼30–40 Oryza sativa (rice) seeds per 100 mm dish or ∼50–60 seeds per 150 mm dish. Approximately 100 mL of tap water was added and the seeds were covered with the bottom of the dish. The seeds were incubated in a 30°C–37°C greenhouse under light of intensity ∼500 µmol photons m−2 s−1 supplied by natural daylight supplemented with 1000 W metal halide lamps (Philips Lighting Co.) for 7–8 d. Seedlings then were transferred to pre-moistened Sunshine LC1 RSi potting soil (SunGro Horticulture) in 15 cm tall pots so that the seeds were ∼1 cm below the soil surface and the radicle or roots were completely buried within the soil. Water was added to an underlying plastic tray to ∼6 cm depth and the level was allowed to drop during the course of the growth incubation, since excessive watering of the seedlings can inhibit growth. A spoonful (∼0.5–1 g) of Sprint 330 powdered iron chelate (BASF) was added to the water to prevent seedling iron deficiency. The seedlings were illuminated with ∼500 µmol photons m−2 s−1 light intensity as above for another 7–8 d until attaining a height of ∼8–12 cm.
E. coli growth conditions
E. coli (strain MG1655) was inoculated in liquid LB media and incubated overnight at 37°C without shaking. The overnight culture was diluted 1:100 into 125 mL side-arm flasks each containing 19 mL of fresh LB media for each reaction condition and incubated at 37°C in a shaking water bath until attaining a Klett value of 80 (mid-exponential growth phase).
In vitro EDC probing of rice RNA
All reactions involving 1-Ethyl-3-(3-dimethylaminopropyl)carbodiimide (EDC) were performed in a chemical fume hood. For all in vitro experiments, untreated rice seedlings that were grown for 14–16 d as described above were cut 5–10 mm above the soil line, and total RNA was extracted from these plants using the procedure described below. Reaction buffer was added to 1 µg total RNA to give a final total volume of 5 µL containing 50 mM pH buffer (one of the following: MES for pH 6, HEPES for pH 7–8, or CHES for pH 9.2), 50 mM KCl, and 0.5 mM MgCl2. The reaction was mixed thoroughly and incubated at room temperature for 5 min to allow equilibration. EDC stock solution (5.65 M; Sigma-Aldrich; 39391-10ML [listed as N-(3-Dimethylaminopropyl)-N′-ethylcarbodiimide]) was diluted to twice the desired final concentration in deionized water, and 5 µL of this diluted stock was added to the reaction mixture to give the desired final EDC concentration in a final reaction volume of 10 µL. In the control (–EDC) treatment, an equivalent volume of deionized water was added to the reaction mixture in place of EDC. Reactions proceeded for 2 min, 5 min, or 15 min at room temperature (∼22°C) before being quenched by the addition of 3 µL of 1 M sodium acetate (pH 6), 1 µL glycogen, and 35 µL 95% ethanol, followed immediately by freezing on dry ice for 1 h and subsequent ethanol precipitation of the RNA. For reactions testing a dithiothreitol (DTT) quench, three separate quench solutions were prepared: DL-1,4 dithiothreitol (Acros Organics; 16568_0250) dissolved to 2.5 M in deionized water; 1 g of DTT dissolved in 5 mL of 1 M sodium acetate (pH 5); or 1 M sodium acetate (pH 5). With each quench condition, 20 µL of the quench solution was added either prior to the addition of 5 µL EDC or after a 5 min reaction with EDC.
In vivo EDC probing of rice
All reactions involving EDC were performed in a chemical fume hood. Rice seedlings grown for 14–16 d as described above were cut 5–10 mm above the soil line. For reactions in a desired EDC concentration, 4–6 excised seedlings were placed in a 50 mL Falcon tube that contained buffer (HEPES, pH 7, HEPES, pH 8, or CHES, pH 9.2), KCl, and MgCl2 such that the addition of EDC diluted in deionized water gave a final total volume of 10 mL containing 50 mM pH buffer, 50 mM KCl, 0.5 mM MgCl2, and EDC of the desired final concentration (110–565 mM). In control (–EDC) reactions, equivalent volumes of deionized water were added in place of EDC. For all experimental and control conditions, the reactions occurred for 15 min at room temperature with periodic shaking and swirling. For treatments using only a water wash, the reaction buffer was decanted and the seedlings were washed six times with ∼20 mL deionized water each wash before immediate drying and freezing in liquid N2. For treatments using a DTT quench, 1 g of DL-1,4 dithiothreitol (Acros Organics; 16568_0250) was added to the tube, which was then shaken vigorously for 2 min. Then, the reaction buffer was decanted and the seedlings were washed three times with ∼20 mL deionized water for each wash before immediate drying and quick freezing in liquid N2. Frozen seedlings then were subjected to total RNA extraction as described below, with separate mortars and pestles used for each treatment.
In vivo phenylglyoxal probing of rice
All reactions involving phenylglyoxal were performed in a chemical fume hood. Control and experimental treatments with phenylglyoxal were performed as described previously (Mitchell et al. 2018). For treatments using only a water wash, the reaction buffer was decanted and the seedlings were washed six times with ∼20 mL deionized water each wash before immediate drying and freezing in liquid N2. For treatments using a DTT quench, 1 g of DL-1,4 dithiothreitol (Acros Organics; 16568_0250) was added to the tube, which was then shaken vigorously for 2 min. Then, the reaction buffer was decanted and the seedlings were washed three times with ∼20 mL deionized water each wash before immediate drying and quick freezing in liquid N2. Frozen seedlings then were subjected to total RNA extraction as described above, with separate mortars and pestles used for each treatment.
Total RNA extraction from rice
Untreated or EDC-treated rice seedlings were quickly frozen in liquid nitrogen and stored at −80°C until use. Frozen tissue was ground to fine powder using a mortar and pestle pre-cleaned with RNase Zap (Ambion). In an Eppendorf tube, 80–100 mg of powder was added to 350 mL of lysis buffer (Macherey-Nagel) and 35 mL of 500 mM dithiothreitol (DTT), then centrifuged for 1 min at >11,000 rpm. The supernatant was then subjected to total RNA extraction following the protocol described in the NucleoSpin RNA Plant kit (Macherey-Nagel).
In vivo EDC probing of E. coli
All reactions involving EDC were performed in a chemical fume hood. EDC diluted in distilled water was added to E. coli cells grown as described above to give final concentrations of EDC ranging from 5.7 to 113 mM in a total volume of 20 mL. The reactions were allowed to proceed for 5 min at 37°C with continuous shaking, followed by the addition of 0.8 g DTT and additional shaking for 2 min at 37°C to quench the reaction. Cell growth was arrested by removing 6 mL of treated cells and adding to 6 mL of a frozen slurry buffer containing 10 mM Tris-HCl (pH 7.2), 5 mM MgCl2, 25 mM NaN3, 1.5 mM chloramphenicol, and 12.5% ethanol, followed by incubation on ice for 10 min. Cell pellets were washed twice in the same buffer. Total RNA was extracted from the final cell pellets using the RNeasy Mini kit (Qiagen), and the extracted RNA was subjected to phenol chloroform extraction and ethanol precipitation after treatment with Turbo DNase (Ambion).
Gene-specific reverse transcription
RT was performed on in vitro or in vivo total RNA extracted from rice or E. coli as previously described (Mitchell et al. 2018), using 32P-radiolabeled primer targeting rice 5.8S rRNA (5′-GCGTGACGCCCAGGCA-3′), rice 28S rRNA (5′-GGACGCCTCTCCAGACTACAATTCGG-3′), or E. coli 16S rRNA (5′-TTACTCACCCGTCCGCCACTCG-3′).
Gene-specific reverse transcription for E. coli
E. coli total RNA extracted as described above was combined with 10× First-Strand Synthesis buffer (Invitrogen) and nuclease-free water to give 2 μg of total RNA in a 4.5 μL volume. Next, 1 µL of ∼500,000 cpm/µL 32P-radiolabeled primer complementary to 16S rRNA (shown above) was added to the total RNA sample. The solution was incubated at 95°C for 1 min then cooled to 35°C for 1 min to anneal the primer. Once cooled, 3 µL of RT reaction buffer was added to a final concentration of 8 mM MgCl2, 10 mM DTT, and 1 mM dNTPs. The solution was heated to 55°C for 1 min, 0.5 µL of 200 U/µL Superscript III reverse transcriptase (Invitrogen) was added to the reaction, and RT was allowed to proceed at 55°C for 15 min. Next, 1 µL of 1M NaOH was added to the solution, which was then heated to 95°C for 5 min to hydrolyze all contaminating RNAs and to heat denature reverse transcriptase. Lastly, an equal volume (11 µL) of 2× stop solution containing 100% deionized formamide, 20 mM Tris-HCl, 40 mM EDTA, 0.1% xylene cyanol, and 0.025% bromophenol blue was added to the reaction. The mixture was loaded onto a 6% denaturing polyacrylamide gel (8.3 M Urea) and run at a constant 80 W for ∼90 min. The resulting data were analyzed using semi-automated footprinting analysis software (SAFA) (Das et al. 2005).
Calculation of significant EDC modification
Chemical modification was calculated essentially as previously described (Mitchell et al. 2018). Briefly, in all plots constructed from SAFA results, significant EDC modification was calculated in the following manner. The background-corrected band intensity for all residues within the examined nucleotide range—except for Us, Gs, and the largest and smallest values for each reaction condition—were averaged and their SD was calculated. Next, the value for significant EDC modification (S) for a number of reaction conditions n was calculated as the grand average of the averages (Ai) plus three times the SD for each reaction condition (σi), as shown below:
Here, as most reaction conditions give bands of light intensity even in the absence of modification by a reagent, three SDs from the mean ensure sufficient separation between such background bands and bands genuinely caused by modified nucleotides.
SUPPLEMENTAL MATERIAL
Supplemental material is available for this article.
Supplementary Material
ACKNOWLEDGMENTS
We thank Raghav Poudyal for providing ATP aptamer RNA and the associated DNA primer used in this work. This work was supported by the National Science Foundation Plant Genome Research Program under NSF-IOS-1612170 and NSF-IOS-1339282, National Institutes of Health 1R35GM127064, and by the Charles E. Kaufman Foundation of the Pittsburgh Foundation under KA2016-85222.
Footnotes
Article is online at http://www.rnajournal.org/cgi/doi/10.1261/rna.067868.118.
REFERENCES
- Altuvia S, Kornitzer D, Teff D, Oppenheim AB. 1989. Alternative mRNA structures of the cIII gene of bacteriophage λ determine the rate of its translation initiation. J Mol Biol 210: 265–280. 10.1016/0022-2836(89)90329-X [DOI] [PubMed] [Google Scholar]
- Antal M, Boros E, Solymosy F, Kiss T. 2002. Analysis of the structure of human telomerase RNA in vivo. Nucleic Acids Res 30: 912–920. 10.1093/nar/30.4.912 [DOI] [PMC free article] [PubMed] [Google Scholar]
- Babitzke P. 1997. Regulation of tryptophan biosynthesis: Trp-ing the TRAP or how Bacillus subtilis reinvented the wheel. Mol Microbiol 26: 1–9. 10.1046/j.1365-2958.1997.5541915.x [DOI] [PubMed] [Google Scholar]
- Balzer M, Wagner R. 1998. A chemical modification method for the structural analysis of RNA and RNA-protein complexes within living cells. Anal Biochem 256: 240–242. 10.1006/abio.1997.2499 [DOI] [PubMed] [Google Scholar]
- Barnwal RP, Loh E, Godin KS, Yip J, Lavender H, Tang CM, Varani G. 2016. Structure and mechanism of a molecular rheostat, an RNA thermometer that modulates immune evasion by Neisseria meningitidis. Nucleic Acids Res 44: 9426–9437. 10.1093/nar/gkw584 [DOI] [PMC free article] [PubMed] [Google Scholar]
- Bevilacqua PC, Assmann SM. 2018. Technique development for probing RNA structure in vivo and genome-wide. Cold Spring Harb Perspect Biol 10: a32250 10.1101/cshperspect.a032250 [DOI] [PMC free article] [PubMed] [Google Scholar]
- Bevilacqua PC, Ritchey LE, Su Z, Assmann SM. 2016. Genome-wide analysis of RNA secondary structure. Annu Rev Genet 50: 235–266. 10.1146/annurev-genet-120215-035034 [DOI] [PubMed] [Google Scholar]
- Cannone JJ, Subramanian S, Schnare MN, Collett JR, D'Souza LM, Du Y, Feng B, Lin N, Madabusi LV, Müller KM, et al. 2002. The Comparative RNA Web (CRW) Site: an online database of comparative sequence and structure information for ribosomal, intron, and other RNAs. BMC Bioinformatics 3: 2 10.1186/1471-2105-3-2 [DOI] [PMC free article] [PubMed] [Google Scholar]
- Das R, Laederach A, Pearlman SM, Herschlag D, Altman RB. 2005. SAFA: semi-automated footprinting analysis software for high-throughput quantification of nucleic acid footprinting experiments. RNA 11: 344–354. 10.1261/rna.7214405 [DOI] [PMC free article] [PubMed] [Google Scholar]
- Ding Y, Tang Y, Kwok CK, Zhang Y, Bevilacqua PC, Assmann SM. 2014. In vivo genome-wide profiling of RNA secondary structure reveals novel regulatory features. Nature 505: 696–700. 10.1038/nature12756 [DOI] [PubMed] [Google Scholar]
- Fedorova O, Zingler N. 2007. Group II introns: structure, folding and splicing mechanism. Biol Chem 388: 665–678. 10.1515/BC.2007.090 [DOI] [PubMed] [Google Scholar]
- Feng C, Chan D, Joseph J, Muuronen M, Coldren WH, Dai N, Corrêa IR Jr, Furche F, Hadad CM, Spitale RC. 2018. Light-activated chemical probing of nucleobase solvent accessibility inside cells. Nat Chem Biol 14: 276–283. 10.1038/nchembio.2548 [DOI] [PMC free article] [PubMed] [Google Scholar]
- Gout E, Rébeillé F, Douce R, Bligny R. 2014. Interplay of Mg2+, ADP, and ATP in the cytosol and mitochondria: unravelling the role of Mg2+ in cell respiration Proc Natl Acad Sci 111: E4560–E4567. 10.1073/pnas.1406251111 [DOI] [PMC free article] [PubMed] [Google Scholar]
- Guerrier-Takada C, Gardiner K, Marsh T, Pace N, Altman S. 1983. The RNA moiety of ribonuclease P is the catalytic subunit of the enzyme. Cell 35: 849–857. 10.1016/0092-8674(83)90117-4 [DOI] [PubMed] [Google Scholar]
- Gutell RR, Lee JC, Cannone JJ. 2002. The accuracy of ribosomal RNA comparative structure models. Curr Opin Struct Biol 12: 301–310. 10.1016/S0959-440X(02)00339-1 [DOI] [PubMed] [Google Scholar]
- Harris KA Jr, Crothers DM, Ullu E. 1995. In vivo structural analysis of spliced leader RNAs in Trypanosoma brucei and Leptomonas collosoma: a flexible structure that is independent of cap4 methylations. RNA 1: 351–362. [PMC free article] [PubMed] [Google Scholar]
- Heus HA, Pardi A. 1991. Structural features that give rise to the unusual stability of RNA hairpins containing GNRA loops. Science 253: 191–194. 10.1126/science.1712983 [DOI] [PubMed] [Google Scholar]
- Holmberg L, Melander Y, Nygård O. 1994. Probing the structure of mouse Ehrlich ascites cell 5.8S, 18S and 28S ribosomal RNA in situ. Nucleic Acids Res 22: 1374–1382. 10.1093/nar/22.8.1374 [DOI] [PMC free article] [PubMed] [Google Scholar]
- Incarnato D, Neri F, Anselmi F, Oliviero S. 2014. Genome-wide profiling of mouse RNA secondary structures reveals key features of the mammalian transcriptome. Genome Biol 15: 491 10.1186/s13059-014-0491-2 [DOI] [PMC free article] [PubMed] [Google Scholar]
- Karley AJ, White PJ. 2009. Moving cationic minerals to edible tissues: potassium, magnesium, calcium. Curr Opin Plant Biol 12: 291–298. 10.1016/j.pbi.2009.04.013 [DOI] [PubMed] [Google Scholar]
- Kortmann J, Sczodrok S, Rinnenthal J, Schwalbe H, Narberhaus F. 2011. Translation on demand by a simple RNA-based thermosensor. Nucleic Acids Res 39: 2855–2868. 10.1093/nar/gkq1252 [DOI] [PMC free article] [PubMed] [Google Scholar]
- Kumari S, Bugaut A, Huppert JL, Balasubramanian S. 2007. An RNA G-quadruplex in the 5′ UTR of the NRAS proto-oncogene modulates translation. Nat Chem Biol 3: 218–221. 10.1038/nchembio864 [DOI] [PMC free article] [PubMed] [Google Scholar]
- Kwok CK, Ding Y, Shahid S, Assmann SM, Bevilacqua PC. 2015a. A stable RNA G-quadruplex within the 5′-UTR of Arabidopsis thaliana ATR mRNA inhibits translation. Biochem J 467: 91–102. 10.1042/BJ20141063 [DOI] [PubMed] [Google Scholar]
- Kwok CK, Tang Y, Assmann SM, Bevilacqua PC. 2015b. The RNA structurome: transcriptome-wide structure probing with next-generation sequencing. Trends Biochem Sci 40: 221–232. 10.1016/j.tibs.2015.02.005 [DOI] [PubMed] [Google Scholar]
- Lee B, Flynn RA, Kadina A, Guo JK, Kool ET, Chang HY. 2017. Comparison of SHAPE reagents for mapping RNA structures inside living cells. RNA 23: 169–174. 10.1261/rna.058784.116 [DOI] [PMC free article] [PubMed] [Google Scholar]
- Legault P, Pardi A. 1997. Unusual dynamics and pKa shift at the active site of a lead-dependent ribozyme. J Am Chem Soc 119: 6621–6628. 10.1021/ja9640051 [DOI] [Google Scholar]
- Madison SA, Carnali JO. 2013. pH optimization of amidation via carbodiimides. Ind Eng Chem Res 52: 13547–13555. 10.1021/ie401724m [DOI] [Google Scholar]
- Merino EJ, Wilkinson KA, Coughlan JL, Weeks KM. 2005. RNA structure analysis at single nucleotide resolution by selective 2′-hydroxyl acylation and primer extension (SHAPE). J Am Chem Soc 127: 4223–4231. 10.1021/ja043822v [DOI] [PubMed] [Google Scholar]
- Mitchell D III, Russell R. 2014. Folding pathways of the Tetrahymena ribozyme. J Mol Biol 426: 2300–2312. 10.1016/j.jmb.2014.04.011 [DOI] [PMC free article] [PubMed] [Google Scholar]
- Mitchell D III, Ritchey LE, Park H, Babitzke P, Assmann SM, Bevilacqua PC. 2018. Glyoxals as in vivo RNA structural probes of guanine base-pairing. RNA 24: 114–124. 10.1261/rna.064014.117 [DOI] [PMC free article] [PubMed] [Google Scholar]
- Nakajima N, Ikada Y. 1995. Mechanism of amide formation by carbodiimide for bioconjugation in aqueous media. Bioconjug Chem 6: 123–130. 10.1021/bc00031a015 [DOI] [PubMed] [Google Scholar]
- Naville M, Gautheret D. 2010. Transcription attenuation in bacteria: theme and variations. Brief Funct Genomics 9: 178–189. 10.1093/bfgp/elq008 [DOI] [PubMed] [Google Scholar]
- Noller HF, Chaires JB. 1972. Functional modification of 16S ribosomal RNA by kethoxal. Proc Natl Acad Sci 69: 3115–3118. 10.1073/pnas.69.11.3115 [DOI] [PMC free article] [PubMed] [Google Scholar]
- Peselis A, Serganov A. 2014. Themes and variations in riboswitch structure and function. Biochim Biophys Acta 1839: 908–918. 10.1016/j.bbagrm.2014.02.012 [DOI] [PMC free article] [PubMed] [Google Scholar]
- Rabani M, Pieper L, Chew GL, Schier AF. 2017. A massively parallel reporter assay of 3′ UTR sequences identifies in vivo rules for mRNA degradation. Mol Cell 68: 1083–1094.e5. 10.1016/j.molcel.2017.11.014 [DOI] [PMC free article] [PubMed] [Google Scholar]
- Rouskin S, Zubradt M, Washietl S, Kellis M, Weissman JS. 2014. Genome-wide probing of RNA structure reveals active unfolding of mRNA structures in vivo. Nature 505: 701–705. 10.1038/nature12894 [DOI] [PMC free article] [PubMed] [Google Scholar]
- SantaLucia J Jr, Turner DH. 1993. Structure of (rGGCGAGCC)2 in solution from NMR and restrained molecular dynamics. Biochemistry 32: 12612–12623. 10.1021/bi00210a009 [DOI] [PubMed] [Google Scholar]
- Schmidt C, Becker T, Heuer A, Braunger K, Shanmuganathan V, Pech M, Berninghausen O, Wilson DN, Beckmann R. 2016. Structure of the hypusinylated eukaryotic translation factor eIF-5A bound to the ribosome. Nucleic Acids Res 44: 1944–1951. 10.1093/nar/gkv1517 [DOI] [PMC free article] [PubMed] [Google Scholar]
- Spitale RC, Crisalli P, Flynn RA, Torre EA, Kool ET, Chang HY. 2013. RNA SHAPE analysis in living cells. Nat Chem Biol 9: 18–20. 10.1038/nchembio.1131 [DOI] [PMC free article] [PubMed] [Google Scholar]
- Teixeira A, Tahiri-Alaoui A, West S, Thomas B, Ramadass A, Martianov I, Dye M, James W, Proudfoot NJ, Akoulitchev A. 2004. Autocatalytic RNA cleavage in the human β-globin pre-mRNA promotes transcription termination. Nature 432: 526–530. 10.1038/nature03032 [DOI] [PubMed] [Google Scholar]
- Turner DH. 2000. Conformational changes. In Nucleic acids: structure, properties, and functions (ed. Bloomfield VA, et al. ), pp. 259–334. University Science Books, Sausalito, CA. [Google Scholar]
- Walker DJ, Leigh RA, Miller AJ. 1996. Potassium homeostasis in vacuolate plant cells. Proc Natl Acad Sci 93: 10510–10514. 10.1073/pnas.93.19.10510 [DOI] [PMC free article] [PubMed] [Google Scholar]
- Wan Y, Qu K, Ouyang Z, Kertesz M, Li J, Tibshirani R, Makino DL, Nutter RC, Segal E, Chang HY. 2012. Genome-wide measurement of RNA folding energies. Mol Cell 48: 169–181. 10.1016/j.molcel.2012.08.008 [DOI] [PMC free article] [PubMed] [Google Scholar]
- Wan Y, Qu K, Zhang QC, Flynn RA, Manor O, Ouyang Z, Zhang J, Spitale RC, Snyder MP, Segal E, et al. 2014. Landscape and variation of RNA secondary structure across the human transcriptome. Nature 505: 706–709. 10.1038/nature12946 [DOI] [PMC free article] [PubMed] [Google Scholar]
- West S, Gromak N, Proudfoot NJ. 2004. Human 5′→3′ exonuclease Xrn2 promotes transcription termination at co-transcriptional cleavage sites. Nature 432: 522–525. 10.1038/nature03035 [DOI] [PubMed] [Google Scholar]
- Wilcox JL, Ahluwalia AK, Bevilacqua PC. 2011. Charged nucleobases and their potential for RNA catalysis. Acc Chem Res 44: 1270–1279. 10.1021/ar2000452 [DOI] [PMC free article] [PubMed] [Google Scholar]
- Wiliams A, Ibrahim IT. 1981. Carbodiimide chemistry: recent advances. Chem Rev 81: 589–636. 10.1021/cr00046a004 [DOI] [Google Scholar]
- Winkler W, Nahvi A, Breaker RR. 2002. Thiamine derivatives bind messenger RNAs directly to regulate bacterial gene expression. Nature 419: 952–956. 10.1038/nature01145 [DOI] [PubMed] [Google Scholar]
- Yanofsky C. 1981. Attenuation in the control of expression of bacterial operons. Nature 289: 751–758. 10.1038/289751a0 [DOI] [PubMed] [Google Scholar]
- Zaug AJ, Cech TR. 1986. The intervening sequence RNA of Tetrahymena is an enzyme. Science 231: 470–475. 10.1126/science.3941911 [DOI] [PubMed] [Google Scholar]
- Ziehler WA, Engelke DR. 2001. Probing RNA structure with chemical reagents and enzymes. Curr Protoc Nucleic Acid Chem Chapter 6: Unit 6.1 10.1002/0471142700.nc0601s00 [DOI] [PMC free article] [PubMed] [Google Scholar]
Associated Data
This section collects any data citations, data availability statements, or supplementary materials included in this article.