Abstract
Preoperative progesterone intervention has been shown to confer a survival benefit to breast cancer patients independently of their progesterone receptor (PR) status. This observation raises the question how progesterone affects the outcome of PR-negative cancer. Here, using microarray and RNA-Seq–based gene expression profiling and ChIP-Seq analyses of breast cancer cells, we observed that the serum- and glucocorticoid-regulated kinase gene (SGK1) and the tumor metastasis–suppressor gene N-Myc downstream regulated gene 1 (NDRG1) are up-regulated and that the microRNAs miR-29a and miR-101-1 targeting the 3′-UTR of SGK1 are down-regulated in response to progesterone. We further demonstrate a dual-phase transcriptional and post-transcriptional regulation of SGK1 in response to progesterone, leading to an up-regulation of NDRG1 that is mediated by a set of genes regulated by the transcription factor AP-1. We found that NDRG1, in turn, inactivates a set of kinases, impeding the invasion and migration of breast cancer cells. In summary, we propose a model for the mode of action of progesterone in breast cancer. This model helps decipher the molecular basis of observations in a randomized clinical trial of the effect of progesterone on breast cancer and has therefore the potential to improve the prognosis of breast cancer patients receiving preoperative progesterone treatment.
Keywords: progesterone, breast cancer, functional genomics, cell signaling, microRNA (miRNA), N-Myc-downstream regulated gene 1 (NDRG1), post-transcriptional regulation, Serum- and glucocorticoid-regulated kinase 1 (SGK1), transcription factor AP-1
Introduction
The increasing complexity of multicellular organisms correlates with the increasing number of microRNAs rather than the number of coding genes encoded by the genome (1, 2), reflecting a gradual increase in the extent and intricacy of gene regulation (3). Hierarchically, microRNAs function downstream of transcriptional regulation of genes because microRNAs repress post-transcription of mRNAs (4). However, emerging evidence suggests that transcriptional and post-transcriptional regulation is often highly coordinated (5, 6). Hormones, for instance, have been hypothesized to regulate expression of target genes at the transcriptional and post-transcriptional level (7, 8). Estrogen up-regulates the expression of progesterone receptor (PR)4 by transcriptionally recruiting estrogen receptor (ER) at the promoter and, post-transcriptionally, by silencing expression of microRNAs targeting the 3′-UTR of PR in breast cancer cells (9). A similar example for the ATP1B1 gene has been reported (10). However, systematic approaches to discern dual-regulated molecular targets of hormones in breast cancer remains poorly understood.
Understanding the molecular basis of clinical phenomena in response to therapeutic interventions has been an important point of intersection between medical and biological sciences. Whereas the clinical benefit of preoperative endocrine therapy is well documented in the literature (11, 12), more recently, we described the first randomized trial with preoperative progesterone resulting in greater than 10% absolute improvement in 5-year disease-free survival among node-positive breast cancer patients (13). Of several hypothesis-generating results from this study, the impact of progesterone on PR-negative patients particularly lends itself to a systematic characterization of molecular changes that progesterone may induce in breast cells.
Gene expression studies probing the targets of progesterone have been performed either restrictively in PR-positive breast cancer cell lines or in the presence of other hormones (14–18). Although few studies suggest a beneficial effect of progesterone, progesterone-responsive genes in PR-negative cells have not been studied (14, 15, 17, 19). To identify targets of progesterone independent of PR status of cells, we set out to perform an integrated genomic profiling of a panel of PR-positive and PR-negative breast cancer cell lines treated with progesterone, followed by functional analysis of the components found to be significantly altered. This study details the molecular action of progesterone on breast cancer cells, mediated by the up-regulation of a genomic axis inclusive of a tumor metastasis suppressor gene in breast cancer, independent of the PR status of cells.
Results
Gene expression analyses reveal a novel dual-phase regulation of SGK1 by progesterone in breast cancer cells
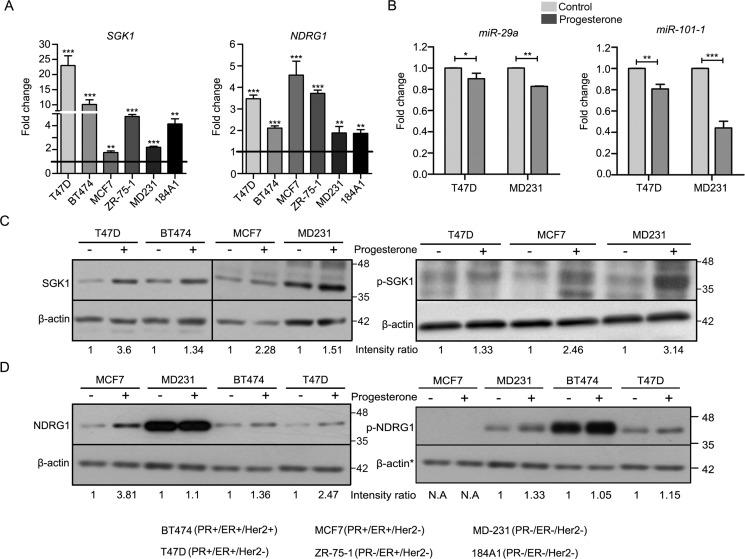
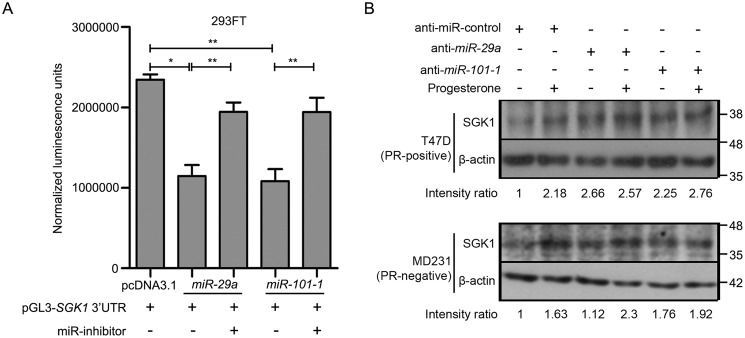
An integrated analysis of microarray-based mRNA expression profile and deep sequencing of noncoding small RNA of breast cancer cells (as described under “Experimental procedures”) led us to identify up-regulation of a serum- and glucocorticoid-regulated kinase gene (SGK1) and N-Myc downstream regulated gene 1 (NDRG1), along with down-regulation of miR-29a and miR-101-1, predicted to bind the 3′-UTR of SGK1, independent of the hormonal receptor status of the cells (Fig. S1A and Tables S1 and S2). The up-regulation of SGK1, known to harbor multiple progesterone response elements (PREs) (20, 21), and NDRG1 were observed to be relatively higher among the PR-positive cells, whereas miR-29a and miR-101-1 were lower in PR-negative cells in response to progesterone (Fig. 1, A–D). Also, knockdown of PR significantly decreased the progesterone-induced up-regulation in expression of SGK1 in PR-positive cells (Fig. S2C). Moreover, SGK1 showed an increased expression based on analysis of the RNA-Seq data, reported earlier (15) (Fig. S2B), along with differentially enriched binding of PR and p300 at the SGK1 loci in response to progesterone treatment, based on ChIP-Seq data (15) analysis (Fig. S2A), in T47D and MCF7 PR-positive cells (as explained under “Experimental procedures”). Interestingly, SGK1 activation (induction of p-SGK1 in response to progesterone) was found to be comparable in breast cancer cells, regardless of their PR status (Fig. 1C). Next, we validated SGK1 as a target of miR-29a and miR-101-1 by co-expressing the microRNAs along with firefly luciferase reporter genes cloned upstream to 3′-UTR of SGK1. Ectopic expression of both of the microRNAs decreased the firefly luciferase activity in 293FT cells expressing the 3′-UTR of SGK1. Consistent with the findings, transfection with anti-miRs targeting miR-29a and miR-101-1 not only rescued the repression of luciferase activity in 293FT cells (Fig. 2A) but also led to sustained expression levels of SGK1 based on Western blot analysis of breast cancer cells (Fig. 2B). Taken together, the data suggest convergence of the dual mode of regulation at SGK1 in response to progesterone treatment, along with up-regulation of NDRG1 in multiple breast cancer cell lines independent of their PR status.
Figure 1.
Validation of expression of SGK1 and NDRG1, and miR-29a and miR-101-1 expression in breast cell lines treated with progesterone. A, quantitative real-time PCR analysis for validation of expression of SGK1 and NDRG1 transcripts in breast cell lines in response to progesterone. Expression of both of the genes was normalized with respect to expression of GAPDH in each cell line. Data are plotted as -fold change for each gene with respect to the expression in control sample of each cell line. Horizontal black line, gene expression in control cells. The figure is representative of three independent experiments performed in triplicates. p value was calculated using Student's unpaired t test. *, p < 0.05; **, p < 0.005; ***, p < 0.0005. B, transcript levels of miR-29a and miR-101-1 were measured using real-time PCR analysis in T47D and MDA-MB-231 cells treated with progesterone. The graph is plotted as expression -fold change of the two microRNAs normalized to expression of U6 small RNA in progesterone-treated versus control cells. Transcript levels in both control and progesterone-treated cells are shown. The figure is representative of two independent experiments performed in triplicates. C, Western blot analysis for SGK1 (left) and p-SGK1 (right) in breast cancer cells treated with progesterone. Minus sign, control; plus sign, progesterone-treated samples. β-Actin was used as an internal loading control. Numbers on the blot indicate intensity ratio for SGK1 and p-SGK1, normalized to β-actin levels in the respective cell lines. The Western blot analyses for SGK1 and p-SGK1 are representative of three independent experiments. D, Western blot analysis of NDRG1 (left) and p-NDRG1 (right) in breast cancer cells treated with (+) and without (−) progesterone. *, β-actin protein was used as a loading control for Western blotting and is common for both of the blots, shown twice. Numbers on the blot indicate intensity ratio for NDRG1 normalized with respect to β-actin levels, whereas p-NDRG1 levels have been normalized with respect to total NDRG1 expression. The Western blot analysis is representative of three independent experiments. Error bars indicate S.D.
Figure 2.
Functional validation of miR-29a– and miR-101-1–mediated regulation of expression of SGK1. A, quantification of luminescence units normalized to Renilla luciferase activity is plotted for pCDNA3.1-miR-29a or pCDNA3.1-miR-101-1 and pGL3-SGK1 3′-UTR in different combinations with anti-miR-29a or anti-miR-101-1 in 293FT cells. The figure is representative of three independent experiments performed in triplicates. p value was calculated using Student's unpaired t test. *, p < 0.05; **, p < 0.001; ***, p < 0.0001. B, Western blot analysis of SGK1 in T47D (PR-positive, top) and MDA-MB-231 (PR-negative, bottom) treated with anti-miR-control, anti-miR-29a, or anti-miR-101-1. As indicated in the panel, cells were either treated with progesterone or untreated. β-Actin was used as an internal protein-loading control. Numbers on the blot indicate intensity ratio of expression of SGK1 with respect to the anti-miR-control lane and expression normalized with respect to individual β-actin levels. The figure is representative of three independent experiments. Error bars indicate S.D.
SGK1 overexpression mimics progesterone treatment to up-regulate NDRG1
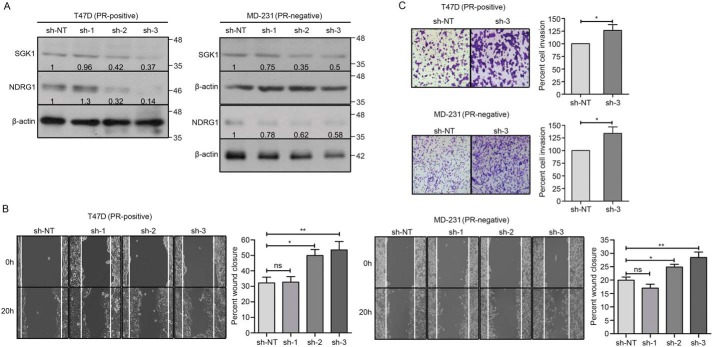
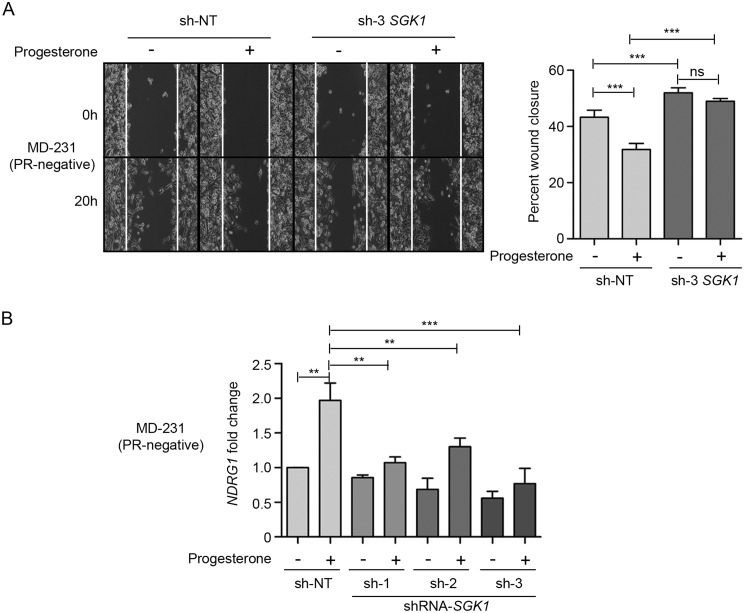
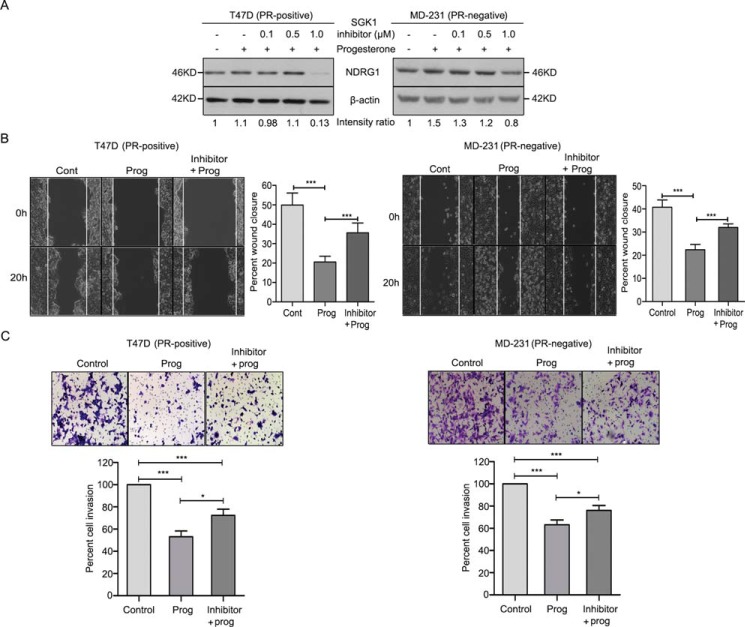
SGK1, when overexpressed in PR-positive T47D and PR-negative MDA-MB-231 breast cancer cells, mimicked the effect of progesterone by up-regulating the expression of NDRG1 (Fig. 3A), which in turn led to a significant reduction in cell migration and cell invasion (Fig. 3, B and C). In a reciprocal approach, depletion of SGK1 in T47D and MDA-MB-231 cells led to a decrease in expression of NDRG1 (Fig. 4A) with an inverse effect observed on migration and invasion of the breast cancer cells (Fig. 4, B and C), regardless of progesterone treatment (Fig. 5, A and B). Furthermore, consistent with the genetic perturbation, pharmacological inhibition of SGK1 with 1 μm GSK650394A similarly blocked the effect of progesterone on breast cancer cell migration and cell invasion, suggesting an essential role of the SGK1/NDRG1 axis downstream to progesterone in breast cancer cells independent of their hormonal receptor status (Fig. 6).
Figure 3.
Ectopic expression of SGK1 mimics the effect of progesterone in breast cancer cells. A, Western blot analysis indicating expression of SGK1 and NDRG1 in T47D (PR-positive, left) and MDA-MB-231 cells (PR-negative, right) overexpressing SGK1. β-Actin was used as an internal loading control. Numbers on the blot indicate intensity ratio for SGK1 and NDRG1, normalized to respective β-actin levels. The analysis is representative of three independent experiments. B, cell migration of T47D (left) and MDA-MB-231 (right) cells overexpressing SGK1 was compared with untransfected parent cells in a wound scratch assay. The bar plots indicate percentage cellular migration of the cells, with a direct comparison between untransfected cells and cells overexpressing SGK1, and the analysis is representative of three independent experiments performed in triplicates. C, in cells overexpressing SGK1, cell invasion was studied in T47D (top) and MDA-MB-231 (bottom), and percentage cell invasion was compared with respective parent cells. Parent cells treated with progesterone were also used to compare the level of cell invasion upon SGK1 overexpression. The bar plot depicts percentage cell invasion, and the figure is representative of three independent experiments performed in triplicates. p value was calculated using Student's unpaired t test. **, p < 0.005; ***, p < 0.0005. Error bars indicate S.D. UNT, untransfected.
Figure 4.
Knockdown of SGK1 decreases expression of NDRG1 and increases cell migration and invasion in breast cancer cells. A, Western blot analysis depicting expression of SGK1 and NDRG1 in T47D (PR-positive, left) and MDA-MB-231 (PR-negative, right) upon depleting the expression of SGK1. Expression of SGK1 and NDRG1 for each knockdown clone was compared with expression in non-targeting shRNA (sh-NT) clone. β-Actin was used as a loading control. Numbers on the blot indicate intensity ratio for expression of SGK1 and NDRG1, normalized to respective β-actin levels. The analysis is representative of three independent experiments. B, cell migration was studied upon knockdown of SGK1 in T47D (left) and MDA-MB-231 (right) cells. The distance traversed by migrating cells was calculated from the start point to the migrated point over a period of 20 h. Data are plotted as percentage wound closure, and the figure panel is representative of three independent experiments performed in triplicates. C, invasion assay upon depletion of SGK1 as compared with sh-NT clone of T47D (top) and MDA-MB-231 (bottom) cells, respectively. The bar plot represents percentage cell invasion with respect to invasion in sh-NT clone. The analysis is representative of three independent experiments performed in triplicates. p value was calculated using Student's unpaired t test. *, p < 0.05; **, p < 0.005; ***, p < 0.0005; ns, not significant. Error bars indicate S.D.
Figure 5.
Depletion of SGK1 renders breast cancer cells partially responsive to progesterone. A, cell migration assay upon depletion of SGK1 in MDA-MB-231 cells (PR-negative), in the presence and absence of progesterone treatment. Cells were monitored by a time-lapse wound-healing assay for 20 h. Cell migration from the 0- to 20-h time point is plotted as percentage wound closure, and the comparison was with respect to sh-NT clone. The bar plot indicates percentage wound closure for each of the clones, treated with or without progesterone, and the quantification is an average of three independent experiments performed in triplicates. B, transcript levels of NDRG1 have been analyzed in MDA-MB-231 cells (PR-negative) upon depletion of SGK1, in the presence and absence of progesterone stimulation. Data are plotted as -fold change of NDRG1 with respect to expression in untreated sh-NT cells and individual SGK1 knockdown clones. GAPDH was used as an internal normalization control. The analysis is representative of three independent experiments performed in triplicates. p value was calculated using Student's unpaired t test. **, p < 0.001; ***, p < 0.0001; ns, not significant. Error bars indicate S.D.
Figure 6.
SGK1 inhibitor phenocopies the effect of depletion of SGK1 in breast cancer cells. A, Western blot analysis representing the expression of NDRG1 in T47D (PR-positive) and MDA-MB-231 cells (PR-negative) treated with the SGK1 inhibitor and progesterone. Expression of NDRG1 was normalized with respect to β-actin levels in the respective cell lines. The numbers on the blot indicate the intensity ratio of expression of NDRG1 with respect to untreated cells in each cell line. The Western blot analysis is representative of three independent experiments. B, cell migration assay of breast cancer cells treated with SGK1 inhibitor and progesterone. The motility of cells from the initial to the 20-h time point is plotted as percentage cell migration, and the comparison was between control, progesterone-treated, and SGK1 inhibitor + progesterone–treated conditions. The bar plot indicates percentage wound closure in each of the three treatment conditions. Analysis is representative of three independent experiments performed in triplicates. C, cellular invasion assay was performed with SGK1 inhibitor treatment in T47D and MDA-MB-231 cells. Panels show cells with no treatment, cells with progesterone treatment, and cells with both inhibitor and progesterone combination treatment. The bar plot represents percentage cell invasion for each of the treatment conditions. The figure is representative of three independent experiments performed in triplicates. p value was calculated using Student's unpaired t test. *, p < 0.05; ***, p < 0.0005. Error bars indicate S.D.
AP-1 transcription factors mediate up-regulation of NDRG1
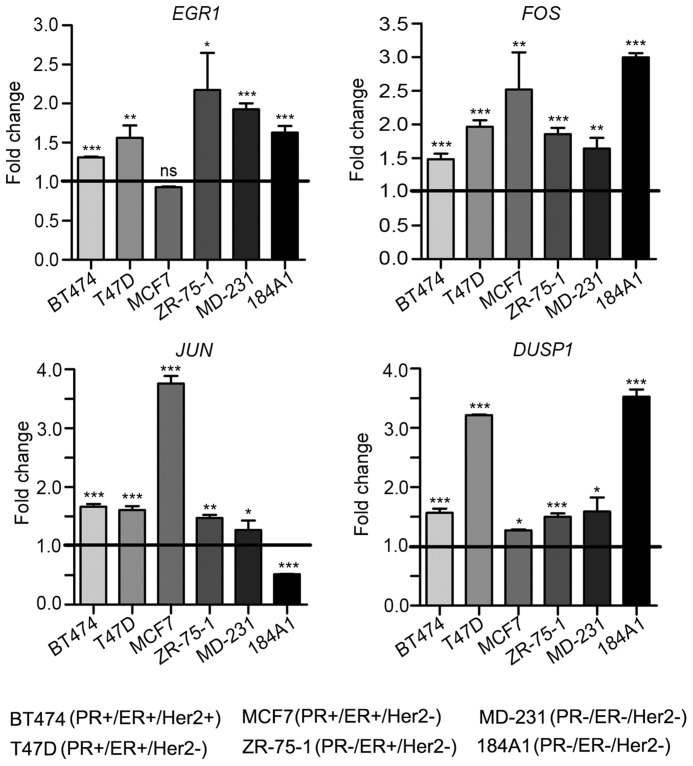
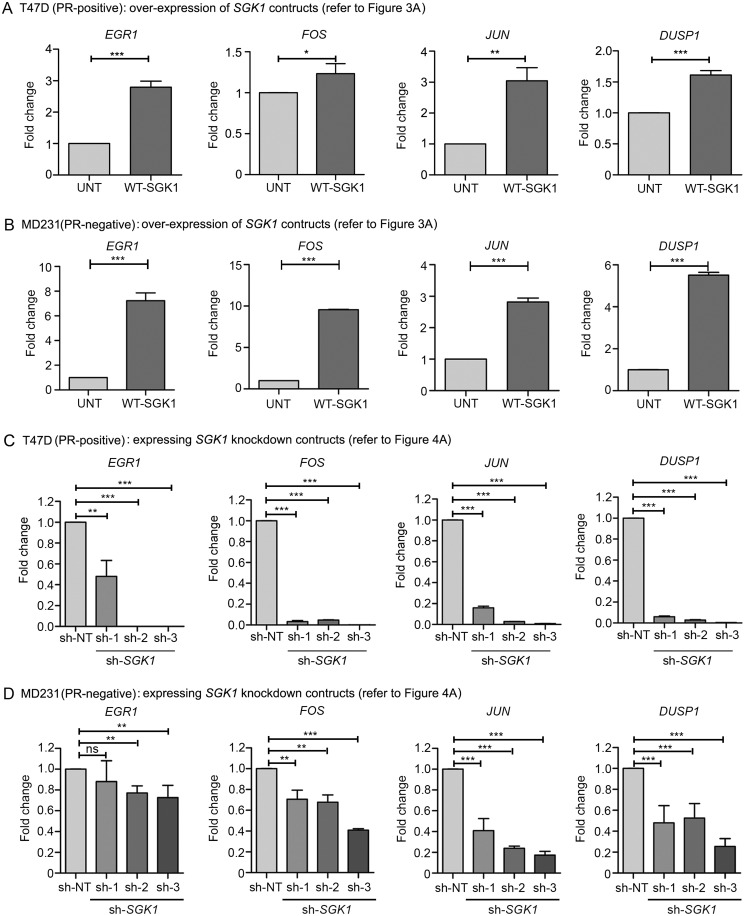
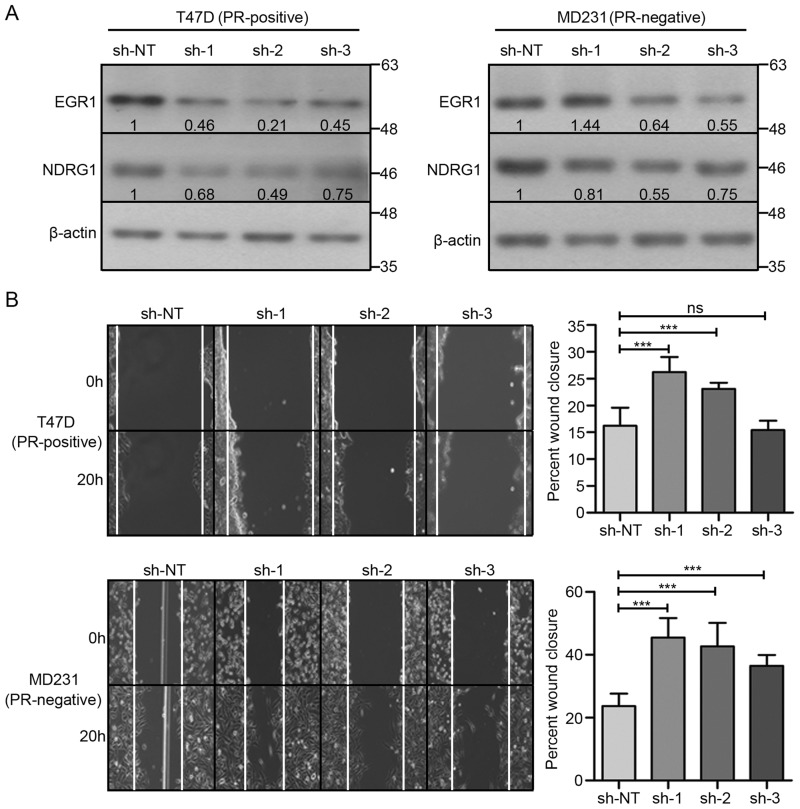
NDRG1 is known to be regulated by AP-1 (FOS/JUN) and EGR1 in response to stress-induced activation of kinases such as p38, JNK, and ERK (22–25). We recently showed that progesterone modulates the effect of surgical stress in primary breast cancer patients (26). Thus, we asked whether NDRG1 could be regulated by AP-1 network genes in response to progesterone-induced activation of SGK1 in a similar manner in breast cancer cells. Indeed, treatment with progesterone or overexpression of SGK1 led to severalfold overexpression of the AP-1 network genes in a panel of breast cell lines irrespective of their PR status (Figs. 7 and 8 (A and B)). Consistent with this finding, knockdown of SGK1 significantly reduced the expression of AP-1 network genes (Fig. 8, C and D), and depleting the expression of an AP-1 network gene, EGR1, abrogated the expression of NDRG1 (Fig. 9A), a downstream component of the pathway, in T47D and MDA-MB-231. Taken together, these results suggest that progesterone and SGK1 regulate the expression of NDRG1 via the AP-1 network genes.
Figure 7.
Progesterone up-regulates expression of the AP-1 network genes in breast cell lines. In the panel of breast cell lines representing different receptor status, transcript levels of AP-1 network genes (EGR1, FOS, JUN, and DUSP1) were studied using quantitative real-time PCR analysis. Horizontal black line, expression of individual genes in the control sample of respective cell line. Data are plotted as -fold change with respect to expression in control after normalization to expression of GAPDH. The figure is representative of three independent experiments performed in triplicates. p value was calculated using Student's unpaired t test. *, p < 0.05; **, p < 0.001; ***, p < 0.0001; ns, not significant. Error bars indicate S.D.
Figure 8.
SGK1 regulates expression of the AP-1 network genes in breast cancer cells. Transcript levels of AP-1 network genes (EGR1, FOS, JUN, and DUSP1) were studied using quantitative real-time PCR in T47D (PR-positive) and MD231 (PR-negative) overexpressing SGK1 (A and B) and upon knockdown of SGK1 (C and D) in both of the cell lines, respectively. Gene expression analysis upon overexpression of SGK1 is plotted compared with the untransfected cells. In the case of analysis upon knockdown of SGK1, transcript levels of AP-1 network genes were compared against sh-NT clone. Data are plotted as -fold change for each individual gene with respect to expression in sh-NT clone and normalized with respect to GAPDH. Both of the real-time PCR analyses are representative of three independent experiments performed in triplicates. p value was calculated using Student's unpaired t test. *, p < 0.05; **, p < 0.005; ***, p < 0.0005. Error bars indicate S.D.
Figure 9.
Knockdown of EGR1 decreases expression of NDRG1 in breast cancer cells. A, Western blot analysis of EGR1 and NDRG1 in T47D (PR-positive, left) and MDA-MB-231 (PR-negative, right) cells upon genetic depletion of EGR1. sh-NT was used as vector control. β-Actin protein was used as a loading control for Western blotting. Numbers on the blot indicate the intensity ratio for expression of EGR1 and NDRG1, normalized to respective β-actin levels. Western blot analysis is representative of three independent experiments. B, cell migration analysis upon depletion of EGR1 in T47D (top) and MDA-MB-231 (bottom) breast cancer cells. Cells were monitored by a time-lapse wound-healing assay for 20 h. Cell migration from the 0- to 20-h time point is plotted as percentage wound closure, and the comparison was with respect to the sh-NT clone. The analysis is representative of three independent experiments performed in triplicates. p value was calculated using Student's unpaired t test. ***, p < 0.0001; ns, not significant. Error bars indicate S.D.
SGK1/NDRG1 axis inactivates the EGFR–mitogen-activated protein kinase pathway to inhibit migration and invasion of breast cancer cells
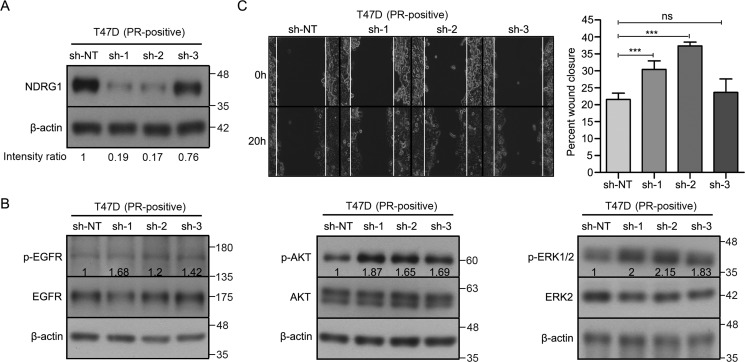
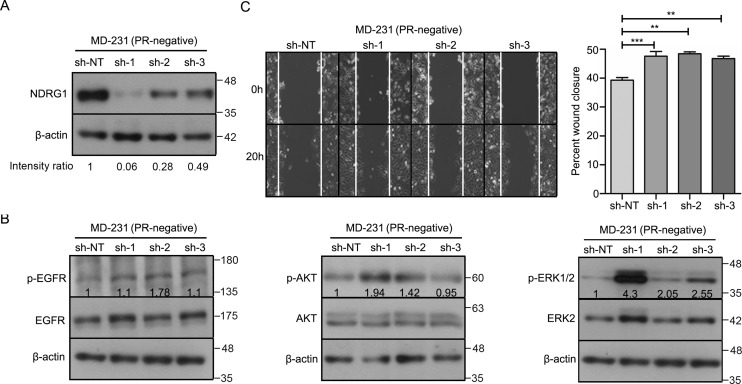
We recently showed that progesterone decreases the activation of multiple kinases like EGFR, AKT1, and ERK1/2 in breast cancer cells, leading to suppression of cell migration (19). To test whether NDRG1 mediates inactivation of EGFR/AKT1/ERK1/2 kinases in response to progesterone, we knocked down the expression of NDRG1 in T47D and MDA-MB-231 cells (Figs. 10A and 11A). Interestingly, two of three shRNA clones targeting NDRG1 significantly increased the phosphorylation of EGFR (Tyr-1068), AKT (Ser-473), and ERK1/2 (Thr-202/Tyr-204) (Figs. 10B and 11B), which remained unaffected even upon treatment with progesterone, suggesting an essential role of NDRG1 to mediate progesterone response (Figs. S3 (A and B) and S4 (A and B)). Furthermore, breast cancer cells expressing constructs targeting EGR1 and NDRG1 displayed an increase in breast cancer cell migration (Figs. 9B, 10C, and 11C). Also, the NDRG1-depleted cells continued to show an increased cell migration regardless of progesterone treatment (Figs. S3C and S4C). Taken together, our results suggest that the SGK1/NDRG1 axis mediates regulation of activation of kinases involved in breast cancer cell migration, independent of their hormonal receptor status.
Figure 10.
NDRG1 regulates the activation of multiple cellular kinases and cell migration in T47D cells. A, Western blot analysis depicting knockdown of NDRG1 in T47D cells (PR-positive). sh-NT was used as vector control for NDRG1 expression. β-Actin protein was used as a loading control for Western blotting. Numbers on the blot indicate intensity ratio for NDRG1 expression normalized to respective β-actin levels. The analysis is representative of three independent experiments. B, Western blot analysis of p-EGFR (Tyr-1086), p-AKT (Ser-473), and p-ERK1/2 (Thr-202/Tyr-204) in NDRG1 knockdown clones of T47D cells. β-Actin used as a loading control for Western blotting. The figure is representative of three independent experiments. Numbers on the blot indicate average intensity ratio calculated from all of the three replicate experiments for phosphorylation levels of EGFR, AKT, and ERK1/2, normalized to the respective total protein levels (EGFR, AKT, and ERK2). Western blot analysis is representative of three independent experiments. C, cell migration analysis upon depletion of NDRG1 in T47D breast cancer cells. Cells were monitored by a time-lapse wound healing assay for 20 h. Cell migration from the initial to the 20-h time point was plotted as percentage wound closure (average of the three biological replicate experiments), and the comparison was with respect to sh-NT. The figure is representative of three independent experiments performed in triplicates. p value was calculated using Student's unpaired t test. ***, p < 0.0005; ns, not significant. Error bars indicate S.D.
Figure 11.
Depletion of NDRG1 activates multiple cellular kinases and increases migration of MDA-MB-231 cells. A, Western blot analysis depicting knockdown of NDRG1 in MD-231 breast cancer cells (PR-negative). sh-NT was used as vector control for NDRG1 expression. β-Actin protein was used as a loading control for Western blotting. Numbers on the blot indicate the intensity ratio for NDRG1, normalized to respective β-actin levels. The analysis is representative of three independent experiments. B, Western blot analysis of p-EGFR (Tyr-1086), p-AKT (Ser-473), and p-ERK1/2 (Thr-202/Tyr-204) in NDRG1 knockdown clones of MD231 cells. β-Actin was used as a loading control for Western blotting, and β-actin for the p-EGFR and p-ERK1/2 panels is the same. The numbers on the blot indicate average intensity ratio calculated from all of the three replicate experiments for phosphorylation levels of EGFR, AKT, and ERK1/2, normalized to respective total protein levels (EGFR, AKT, and ERK2). Western blot analysis is representative of three independent experiments. C, migration of cells was measured from 0 to 20 h by using a time-lapse wound healing assay. The bar plot represents percentage wound closure (average of the three biological replicate experiments), and the comparison was with respect to sh-NT. The figure is representative of three independent experiments performed in triplicates. p value was calculated using Student's unpaired t test. **, p < 0.005; ***, p < 0.0005; ns, not significant. Error bars indicate S.D.
Discussion
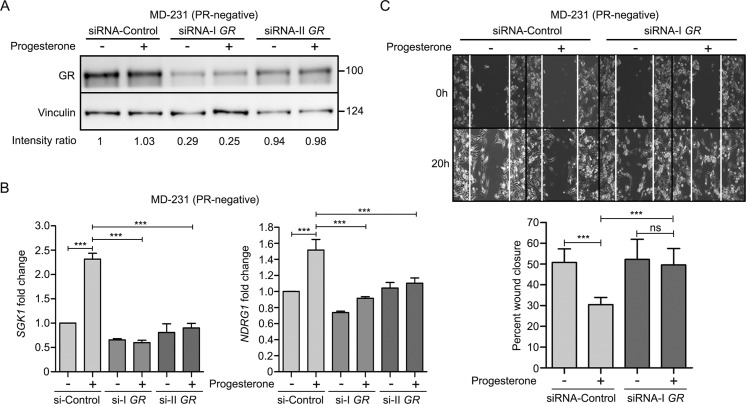
Preoperative endocrine therapies, in contrast to neoadjuvant chemotherapy, are much simpler and more economical to deliver. An understanding of the targets could thus be of immense potential utility in monitoring the response of hormones in human cancer. This study details the underlying molecular mechanism associated with benefits of preoperative progesterone treatment as observed in our randomized trial (13). We present an intricate convergence model indicating a dual-phase regulation downstream to progesterone treatment to regulate the expression of serum- and glucocorticoid-regulated kinase gene 1 (SGK1), predominantly driven as a direct transcriptional target, consistent with earlier reports (20, 21), in PR-positive breast cancer cells and down-regulation of miR-29a and miR-101-1 targeting SGK1 with a relatively distinct effect in PR-negative breast cells in response to progesterone. Furthermore, our analysis suggests that in PR-negative cells, the glucocorticoid receptor (GR) mediates the effect of progesterone by regulating the expression of SGK1 and NDRG1 and cell migration (Fig. 12). However, the role of membrane progesterone receptors (PGRMC1 and SERBP1), which are uniformly expressed across breast cancer cells (Table 1), remains to be elucidated in these cells. The stringent up-regulation of SGK1 in response to progesterone led to an activation of a tumor metastasis suppressor gene, NDRG1, via a set of AP-1 network genes to inactivate AKT1, ERK1/2, and EGFR kinases, impeding the invasion and migration of breast cancer cells. Moreover, NDRG1 is known to regulate the activity of EGFR, either by decreasing its expression or by impeding its heterodimerization with other ErbB family members (27, 28). Furthermore, NDRG1 also suppresses the activation of downstream targets such as EGFR, AKT, and ERK1/2 kinases (29, 30). Thus, consistent with the literature, we show that NDRG1 regulates the activation of EGFR and downstream kinases in breast cancer in response to progesterone. As NDRG1 is known to be regulated by AP-1 network genes in response to stress-induced activation of kinases (22–25), this model confirms and extends our recent report that progesterone modulates the effect of surgical stress by up-regulation of NDRG1 in primary breast cancer patients (26), affecting the invasive characteristics of breast cancer cells most likely by regulating their migration.
Figure 12.
GR mediates progesterone action in PR-negative breast cancer cells. A, Western blot analysis of GR upon knockdown of GR in MDA-MB-231 (PR-negative) cells using two siRNAs targeting GR. The cells were treated with (+) and without (−) progesterone. Vinculin was used as an internal protein loading control. The numbers on the blot indicate intensity ratio for GR expression normalized to respective vinculin levels. The analysis is representative of three independent experiments. B, quantitative real-time PCR for SGK1 and NDRG1 in GR-depleted MD-231 cells in the presence of progesterone. The bar plot indicates -fold expression of both the genes in each of the siRNAs, compared with respect to expression in siRNA-control. GAPDH was used as an internal normalization control. The analysis is representative of three independent experiments performed in triplicates. C, cell migration in MD-231 cells expressing siRNA-I targeting GR and siRNA-control, treated with (+) and without (−) progesterone, was performed for 21 h. The bar plot indicates percentage cellular migration of the cells upon depletion of GR compared with siRNA-control in the presence and absence of progesterone, and the analysis is representative of three independent experiments performed in triplicates. p value was calculated using Student's unpaired t test. ***, p < 0.0005; ns, not significant. Error bars indicate S.D.
Table 1.
Selection of breast cell lines and validation of PR/ER/Her2 hormone receptor status
A panel of breast cell lines with varying receptor status, as reported in the literature, was selected for studying the effect of progesterone independent of the receptor status. The PR/ER/Her2 transcript expression of all of the cell lines was confirmed by RT-PCR and using gene expression array analysis. The RT-PCR analysis for PR/ER/Her2 for T47D, MCF7, BT474, ZR-75-1, and MDA-MB-231 was as described earlier (19).
| Breast cell lines | Literature-reported receptor status |
Validation of receptor status at expression level |
|||||||||||
|---|---|---|---|---|---|---|---|---|---|---|---|---|---|
| Expression array analysis |
RT-PCR |
||||||||||||
| PR | ER | HER2 | PR | ER | HER2 | PR | ER | HER2 | GR | PGRMC1 | SERBP1 | ||
| 1 | T47D | + | + | − | + | + | − | + | + | − | + | + | + |
| 2 | MCF7 | + | + | − | + | + | − | + | + | − | + | + | + |
| 3 | BT474 | + | + | + | + | + | + | + | + | + | + | + | + |
| 4 | ZR-75-1 | − | + | − | − | + | − | − | + | − | + | + | + |
| 5 | MDA-MB-231 | − | − | − | − | − | − | − | − | − | + | + | + |
| 6 | 184A1 (immortalized cell line) | − | − | − | − | − | − | − | − | − | + | + | + |
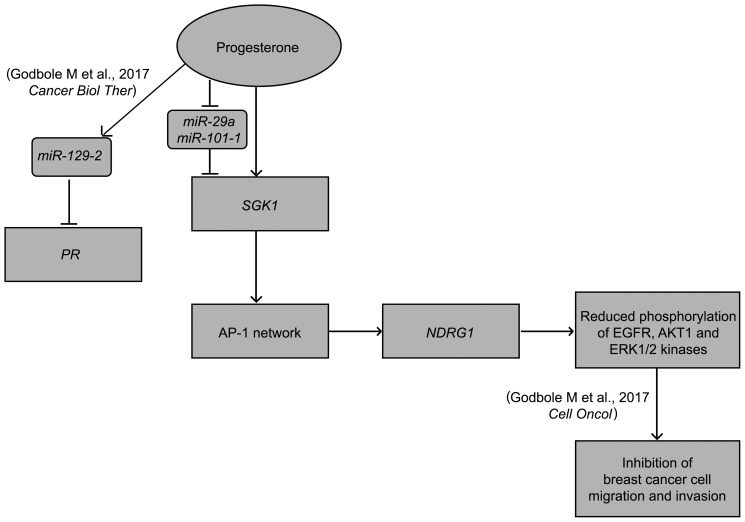
Interestingly, SGK1 and NDRG1 are known to be down-regulated in human cancers as compared with adjacent normal tissues, and increased expression of both of these genes has been associated with better survival of cancer patients (31–35). Even the recently described panel of 38 gene signatures that predict favorable prognosis of breast cancer patients includes SGK1 (15). Thus, enhanced expression of SGK1 and NDRG1 could explain better survival of breast cancer patients (13). Our study suggests that SGK1 up-regulates the expression of NDRG1, with no significant change in phosphorylation of NDRG1 in breast cancer cells. We describe that SGK1 regulates the expression of NDRG1 via regulation of expression of EGR1, a transcription factor from the AP-1 network genes, in breast cancer independent of the PR status of cells. In summary, we propose a model for the mode of action of progesterone in breast cancer deciphering the molecular basis of a randomized clinical trial studying the effect of progesterone in breast cancer (Fig. 13). Whereas there have been attempts to understand the effect of progesterone as a physiological hormone (17), our analysis provides mechanistic insights into the role of progesterone in breast cancer, detailing a possible genetic event leading to clinical observation of better survival of breast cancer patients treated with preoperative progesterone (13). However, it remains to be studied whether these molecular targets of progesterone could help in stratification of breast cancer patients and aid in better prognosis.
Figure 13.
Model depicting the action of progesterone in breast cancer. The figure summarizes our study where progesterone treatment of breast cancer cells increases the expression of SGK1, which up-regulates NDRG1 via the AP-1 network genes, independent of the PR status of the cells. We also show that progesterone suppresses the expression of miR-29a and miR-101-1 targeting the 3′-UTR of SGK1, a dual-regulatory mode of expression of SGK1 in breast cancer. The increased expression of NDRG1 causes reduction in phosphorylation of kinases and thus suppresses cell invasion and cell migration of the cells, thus providing a mechanism to our previous study (19). The model also summarizes our previous results where we have shown that progesterone-mediated up-regulation of miR-129-2 decreases the expression of PR in breast cancer (36). Thus, the model provides a molecular basis to the clinical findings of preoperative progesterone intervention in breast cancer.
Experimental procedures
Breast cell lines
T47D, BT474, MDA-MB-231, ZR-75-1, and MCF7 breast cancer cell lines and an immortalized normal-like breast cell line 184A1 were obtained as a gift from the laboratory of Dr. Dennis J. Slamon (UCLA, Los Angeles, CA). The cell lines were authenticated by DNA short tandem repeat profiling using the Promega GenePrint 10 system, and analysis was done using the GeneMarker HID software and the ATCC database (Table S3). Cells were tested for mycoplasma and were made mycoplasma-free using EZKill mycoplasma removal reagent (HiMedia). T47D, BT474, MDA-MB-231, MCF7, and ZR-75-1 cells were cultured as described previously (19, 36). The immortalized normal-like 184A1 cell line was cultured in DMEM/F-12 medium (HiMedia) supplemented with 28.18 IU of insulin, 20 ng/ml EGF, and 500 ng/ml hydrocortisone. Basal medium was supplemented with 10% (v/v) fetal bovine serum (Gibco), 2.5 mg/ml Amphotericin-B (Abbott), and 1.25 μl/ml gentamycin (Abbott). All of the cells were cultured at 37 °C in a 5% CO2 incubator. The ER/PR/Her2 receptor status of all of the cells was validated by RT-PCR and expression array analysis (Table 1).
Progesterone treatment and RNA isolation
Breast cancer cells were treated with progesterone, and RNA isolation was performed as described earlier (19, 36). Additionally, in the case of mifepristone + progesterone (M+P) combination treatment, 100 nm RU486 (mifepristone) was added to the cells for 2 h, followed by 10 nm progesterone treatment for 6 h in the same medium. An equal amount of alcohol was used as vehicle control. The treatment conditions for progesterone and mifepristone were standardized based on the expression change of three known candidate genes (Fig. S1A).
Gene expression profiling
Gene expression profiling was performed using the BeadChip Illumina microarray platform. Raw data (.idat files) of the BeadChip Illumina platform were converted to readable format using Genome studio software (version V2011.1). Probe level data were converted into gene-centric estimates and used for further processing. The Bioconductor lumi package was used for preprocessing the data, which includes quality control steps, background correction, normalization, log transformation, etc. and finally differential gene analysis. Robust spline normalization and variance stabilization transformation methods were used for normalization and transformation, respectively. To specifically select for highly variable genes, unexpressed, nonannotated, and false positive genes were excluded from the analysis. Median absolute deviation was carried out to make samples comparable with each other. The differential gene expression cut-off was set as 0.5 ≤ log (-fold change) ≤ −0.5 in at least one of the three conditions (control, progesterone, and mifepristone + progesterone). Heat maps were constructed using MeV software (version 4.9.0) (Fig. S5). All possible comparisons were taken into consideration as progesterone versus control (P versus C), mifepristone + progesterone versus control (M+P versus C), and progesterone versus mifepristone + progesterone (P versus M+P). From our analysis, we identified 623, 553, 1873, 532, 1764, and 4703 differentially expressed genes in T47D, MCF7, BT474, ZR-75-1, MDA-MB-231, and 184A1 breast cell lines, respectively. The microarray raw data are available on ArrayExpress (https://www.ebi.ac.uk/arrayexpress/experiments/E-MTAB-6742/)5 (47).
ChIP-Seq analysis
ChIP-Seq data for PR and p300 pulldown in PR-positive breast cancer cell lines (MCF7 and T47D) was obtained from the gene expression omnibus (37) (GSE68359). The raw data were analyzed to identify differential binding sites upon progesterone treatment. Reads were aligned against the GENCODE human reference genome (GRCh38, release 28) (38) using BWA (version 0.7.17) (39). Reads with an alignment quality score less than 15 were filtered using SAMtools (40). MACS2 (41) was used for peak calling from individual replicates to identify PR-binding sites. Further processing of the peaks was performed using DiffBind (42), a bioconductor package to determine replicate clustering, formulation of consensus peak sets, and identification of differential binding sites. A false discovery rate cut-off of 0.0001 was used to identify reliable sites. Annotation was performed for the ±5-kb window of the PR- and p300-binding genomic regions using the UROPA tool (43).
RNA-Seq analysis
Analysis of RNA-Seq–based gene raw counts for T47D and MCF7 cell lines, untreated and treated with progesterone (obtained from GSE68358), was performed using R language. DESeq2 bioconductor package (44) was used to identify the differentially expressed genes.
Integrated analysis
A weighted gene co-expression network was constructed based on the gene expression data to identify gene modules up-regulated in response to progesterone (45) across all of the breast cancer cells. SGK1 and NDRG1 were found to be the top up-regulated and recurrent gene in response to progesterone across multiple cells (Fig. S6). Next, we analyzed our small RNA-Seq data to identify differentially expressed microRNA in response to progesterone treatment predicted to bind to the 3′-UTR of the SGK1 gene using six different microRNA binding site prediction tools (36). Bioinformatics prediction analysis revealed identification of miR-29a and miR-101-1 to target the 3′-UTR of SGK1 that was down-regulated in response to progesterone treatment.
Small RNA-Seq analysis
To identify the microRNA's targeting SGK1, we analyzed our small RNA-Seq data, described earlier (36). The sequencing was performed on a single lane of the Illumina HiSeq 1000 platform with four breast cancer cell lines (T47D, BT474, MCF7, and MDA-MB-231). For identifying microRNAs targeting 3′-UTR of SGK1, differentially expressed microRNAs in response to progesterone were overlapped with microRNAs predicted to target SGK1 using the six algorithms used in our earlier study (36).
Quantitative real-time PCR
Transcript levels of candidate genes and microRNAs were analyzed by quantitative real-time PCR as described previously for genes and microRNAs (19, 36). Briefly, cDNAs from each cell line with the three conditions (control, progesterone, and M+P) were then subjected to qRT-PCR analysis. The GAPDH gene was used as an internal control, and an average of Ct values from each condition was used to normalize the Ct values of candidate genes in each cell line. In the case of microRNAs, U6 small RNA was used as an internal control for normalizing the expression of microRNAs. Expression change of candidate genes and microRNAs was calculated by the 2−ΔΔCt method. Primer sequences used for real-time PCR validation of genes and microRNAs are provided in Table S4. Sequences for real-time PCR primers against PR have been provided earlier (36).
Overexpression and knockdown studies
For overexpression of SGK1, a retrovirus-based pBABE-puro-SGK1 construct that expresses WT SGK1 (WT-SGK1) was used. Untransfected parent cells were used as control for overexpression. Positive clones were selected using 1 μg of puromycin. Overexpression experiments were performed in T47D (PR-positive) and MDA-MB-231 (PR-negative) breast cancer cells. For the knockdown of SGK1, NDRG1, and EGR1 genes in T47D and MDA-MB-231 cells, three lentiviral shRNA constructs (PLATINUM Select Human MLP lentiviral shRNA-mir vector, Transomic Technologies) each, against these genes, were used for genetic depletion. Positive clones were selected using 1 μg of puromycin. For transient knockdown of the progesterone receptor (PR or NR3C3), three lentiviral shRNAs targeting the PR were used. 48 h post-transduction, T47D cells, without selection, were used for further experimentation. The short hairpin-nontargeting (sh-NT) was used as vector/scrambled control for all knockdown experiments.
Knockdown of GR
A transient siRNA-mediated knockdown of the GR (NR3C1) was performed in PR-negative MDA-MB-231 cells. Two siRNAs targeting GR were used, along with one siRNA-control (all siRNAs were from Cell Signaling Technology) to compare the expression of GR and downstream targets. Following siRNA transfection for 72 h using Lipofectamine RNAiMAX (Thermo Fisher Scientific), cells were treated with progesterone as detailed above and processed for RNA isolation and protein sample preparation.
Protein sample preparation and Western blot analysis
Protein samples were prepared, and Western blots were developed as described earlier (19). Briefly, cells were serum-starved and treated with progesterone for 8 h or left untreated. Cell lysates were prepared, and equal amounts of lysate were resolved using 10% SDS-PAGE and transferred to a polyvinylidene difluoride membrane by the wet-transfer method. The immunoblots were then incubated with primary antibodies against SGK1 (Cell Signaling Technology, 1210S; dilution 1:800); p-SGK1 (Abcam, ab55281; dilution 1:500); NDRG1 (Cell Signaling Technology, 9485S; dilution 1:800); p-NDRG1 (Cell Signaling Technology, 5482S; dilution 1:800); EGR1 (Santa Cruz Biotechnology, Inc., sc-515830; dilution 1:1000); β-actin (I-19)-R (Santa Cruz Biotechnology, sc-1616-R; dilution 1:3000); p-EGFR (Tyr-1068) (Cell Signaling, 3777S; dilution 1:500), p-Akt (Ser-473) (Cell Signaling, 4060S; dilution 1:500); p-ERK1/2 (Thr-202/Tyr-204) (Cell Signaling, 9101S; dilution 1:1000); EGFR (1005) (Santa Cruz Biotechnology, sc-03; dilution 1:1000); AKT (11E7) (Cell Signaling, 4685S; dilution 1:1000); ERK2 (c-14) (Santa Cruz Biotechnology, sc-154; dilution 1:1000); GR (Cell Signaling Technology, 3660S; dilution 1:1000); and vinculin (Cell Signaling Technology, 4650S; dilution 1:4000). Goat anti-rabbit IgG-horseradish peroxidase (Santa Cruz Biotechnology, sc-2004; dilution 1:3000) and goat anti-mouse IgG-horseradish peroxidase (Santa Cruz Biotechnology, sc-2005; dilution 1:3000) were used as secondary antibodies.
Treatment with SGK1 inhibitor
Cells were grown until 70–80% confluence in a 6-well dish and then serum-starved using low-glucose DMEM (HiMedia) for 24 h. 1.0 μm concentration of GSK650394A (SGK1 inhibitor, Tocris) was added to the respective wells for 4 h, as discussed in other studies (46). After 4 h, medium was removed and fresh low-glucose medium was added to cells. Where indicated, cells were then treated with 10 nm progesterone for 6 h and then used for RNA or protein isolation.
Cell invasion assay
Cell invasion assay was performed as described earlier (19). Briefly, 35,000 cells were allowed to invade Matrigel in Boyden chambers (Corning) for 16–18 h at 37 °C. Cells were observed under an upright microscope, 10 random fields were chosen, and the number of cells in each field were counted and plotted as percentage cell invasion.
Wound-healing assay
Wound scratch migration assay and analysis was performed as described earlier (19). Briefly, confluent cell monolayer in a 6-well plate was subjected to a scratch manually with a sterile small pipette tip. Cell culture medium was replaced with low-glucose phenol-red free DMEM containing 10% charcoal-stripped fetal bovine serum. Cell migration was monitored for 20 h, and distance traversed by cells was quantified.
Dual-Luciferase assay with microRNAs/SGK1 3′-UTR
Cloning of microRNA sequences and SGK1 3′-UTR was performed as described earlier (36). Briefly, a 400-bp sequence of miR-29a and miR-101-1 containing the seed sequence was PCR-amplified using genomic DNA isolated from T47D. Amplicons were cloned in a T/A cloning vector (Fermentas), followed by subcloning in BamHI and HindIII sites of pCDNA 3.1(−) expression vector (Invitrogen). SGK1-3′-UTR of 1000 bp was PCR-amplified using T47D cDNA. Amplicons were cloned in a T/A cloning vector followed by subcloning between XbaI sites in a pGL3-promoter vector (Luciferase Expressing vector, Promega). For the Dual-Luciferase assay, 293FT cells (50,000 cells/well) were transfected using Lipofectamine 2000 reagent (Thermo Fisher Scientific) with a combination of these constructs along with a Renilla luciferase vector (for normalizing transfection efficiency) in separate wells. 5 nm miR inhibitors (anti-miRs) (Sigma) were also transfected in combination to expression vectors for specifically inhibiting the activity of both of the microRNAs. 48 h post-transfection, cells were lysed, and a luciferase assay was performed to measure firefly luciferase activity after normalization to Renilla luciferase values (Centro LB 960, Multimode Microplate Reader, Berthold Technologies, Bad Wildbad, Germany). The experiment was performed in triplicates, and differences between groups showing p values of <0.05 (calculated using an unpaired Student's t test) were considered significant.
Transfection of microRNA inhibitor in breast cancer cells
T47D cells were grown up to 60% confluence and transfected with 25 nm negative control miR inhibitor (anti-miR-129-2), anti-miR-29a, and anti-miR-101-1 (Sigma). Post-transfection, cells were incubated for 48 h and then treated with progesterone for 6 h as described above. Cell lysate was prepared, and Western blot analysis was performed to study expression of SGK1.
Statistical analysis
Statistical analysis was performed using GraphPad Prism version 5 software (GraphPad Software, Inc., La Jolla, CA). Student's unpaired t test was used to determine the statistical significance.
Author contributions
M. G. and A. D. designed the experiments. M. G., T. T., K. P., B. D., N. Y., S. J., N. G., K. T., P. T., S. D., R. P., H. D., S. S., K. K., D. K., and P. C. performed the experiments. S. D., S. G. and R. A. B. provided the reagents. M. G. and A. D. wrote the paper.
Supplementary Material
Acknowledgments
We thank all members of the Dutt laboratory for critically reviewing the manuscript, Pawan Upadhyay for short tandem repeat profiling, Hitesh Kore for data submission on ArrayExpress, Malika Ranjan for help in generating the MD231-NDRG1 knockdown clones, and Deepak Amburle and Shailesh Parvate for laboratory management. The breast cancer–derived cell lines were obtained as a gift from the laboratory of Dr. Dennis J. Slamon (UCLA, Los Angeles, CA).
This work was supported by Wellcome Trust/Department of Biotechnology India Alliance Grant IA/I/11/2500278 (to A. D.), intramural grants (IRB project 2712 to A.D.), and Department of Biotechnology Grant BT/MED/30/VNCI-Hr-RCA/2015 (to A. D.). The funders had no role in the study design, data collection and analysis, decision to publish, or preparation of the manuscript. The authors declare that they have no conflicts of interest with the contents of this article.
This article contains Tables S1–S4 and Figs. S1–S6.
The microarray raw data were deposited in ArrayExpress under accession number E-MTAB-6742.
Please note that the JBC is not responsible for the long-term archiving and maintenance of this site or any other third party hosted site.
- PR
- progesterone receptor
- ER
- estrogen receptor
- EGFR
- epidermal growth factor receptor
- GR
- glucocorticoid receptor
- DMEM
- Dulbecco's modified Eagle's medium
- M+P
- mifepristone + progesterone
- sh-NT
- short hairpin-nontargeting
- p-
- phosphorylated
- miR
- microRNA.
References
- 1. Griffiths-Jones S., Grocock R. J., van Dongen S., Bateman A., and Enright A. J. (2006) miRBase: microRNA sequences, targets and gene nomenclature. Nucleic Acids Res. 34, D140–D144 10.1093/nar/gkj112 [DOI] [PMC free article] [PubMed] [Google Scholar]
- 2. Hahn M. W., and Wray G. A. (2002) The g-value paradox. Evol. Dev. 4, 73–75 10.1046/j.1525-142X.2002.01069.x [DOI] [PubMed] [Google Scholar]
- 3. Mattick J. S. (2004) RNA regulation: a new genetics? Nat. Rev. Genet. 5, 316–323 10.1038/nrg1321 [DOI] [PubMed] [Google Scholar]
- 4. Catalanotto C., Cogoni C., and Zardo G. (2016) MicroRNA in control of gene expression: an overview of nuclear functions. Int. J. Mol. Sci. 17, E1712 10.3390/ijms17101712 [DOI] [PMC free article] [PubMed] [Google Scholar]
- 5. Shalgi R., Lieber D., Oren M., and Pilpel Y. (2007) Global and local architecture of the mammalian microRNA-transcription factor regulatory network. PLoS Comput. Biol. 3, e131 10.1371/journal.pcbi.0030131 [DOI] [PMC free article] [PubMed] [Google Scholar]
- 6. Tsang J., Zhu J., and van Oudenaarden A. (2007) MicroRNA-mediated feedback and feedforward loops are recurrent network motifs in mammals. Mol. Cell 26, 753–767 10.1016/j.molcel.2007.05.018 [DOI] [PMC free article] [PubMed] [Google Scholar]
- 7. Castellano L., Giamas G., Jacob J., Coombes R. C., Lucchesi W., Thiruchelvam P., Barton G., Jiao L. R., Wait R., Waxman J., Hannon G. J., and Stebbing J. (2009) The estrogen receptor-α-induced microRNA signature regulates itself and its transcriptional response. Proc. Natl. Acad. Sci. U.S.A. 106, 15732–15737 10.1073/pnas.0906947106 [DOI] [PMC free article] [PubMed] [Google Scholar]
- 8. Bethke A., Fielenbach N., Wang Z., Mangelsdorf D. J., and Antebi A. (2009) Nuclear hormone receptor regulation of microRNAs controls developmental progression. Science 324, 95–98 10.1126/science.1164899 [DOI] [PMC free article] [PubMed] [Google Scholar]
- 9. Maillot G., Lacroix-Triki M., Pierredon S., Gratadou L., Schmidt S., Bénès V., Roché H., Dalenc F., Auboeuf D., Millevoi S., and Vagner S. (2009) Widespread estrogen-dependent repression of micrornas involved in breast tumor cell growth. Cancer Res. 69, 8332–8340 10.1158/0008-5472.CAN-09-2206 [DOI] [PubMed] [Google Scholar]
- 10. Cochrane D. R., Jacobsen B. M., Connaghan K. D., Howe E. N., Bain D. L., and Richer J. K. (2012) Progestin regulated miRNAs that mediate progesterone receptor action in breast cancer. Mol. Cell Endocrinol. 355, 15–24 10.1016/j.mce.2011.12.020 [DOI] [PMC free article] [PubMed] [Google Scholar]
- 11. Fisher B., Gunduz N., Coyle J., Rudock C., and Saffer E. (1989) Presence of a growth-stimulating factor in serum following primary tumor removal in mice. Cancer Res. 49, 1996–2001 [PubMed] [Google Scholar]
- 12. Fisher B., Saffer E., Rudock C., Coyle J., and Gunduz N. (1989) Effect of local or systemic treatment prior to primary tumor removal on the production and response to a serum growth-stimulating factor in mice. Cancer Res. 49, 2002–2004 [PubMed] [Google Scholar]
- 13. Badwe R., Hawaldar R., Parmar V., Nadkarni M., Shet T., Desai S., Gupta S., Jalali R., Vanmali V., Dikshit R., and Mittra I. (2011) Single-injection depot progesterone before surgery and survival in women with operable breast cancer: a randomized controlled trial. J. Clin. Oncol. 29, 2845–2851 10.1200/JCO.2010.33.0738 [DOI] [PubMed] [Google Scholar]
- 14. Singhal H., Greene M. E., Tarulli G., Zarnke A. L., Bourgo R. J., Laine M., Chang Y. F., Ma S., Dembo A. G., Raj G. V., Hickey T. E., Tilley W. D., and Greene G. L. (2016) Genomic agonism and phenotypic antagonism between estrogen and progesterone receptors in breast cancer. Sci. Adv. 2, e1501924 10.1126/sciadv.1501924 [DOI] [PMC free article] [PubMed] [Google Scholar]
- 15. Mohammed H., Russell I. A., Stark R., Rueda O. M., Hickey T. E., Tarulli G. A., Serandour A. A., Birrell S. N., Bruna A., Saadi A., Menon S., Hadfield J., Pugh M., Raj G. V., Brown G. D., et al. (2015) Progesterone receptor modulates ERα action in breast cancer. Nature 523, 313–317 10.1038/nature14583 [DOI] [PMC free article] [PubMed] [Google Scholar]
- 16. Need E. F., Selth L. A., Trotta A. P., Leach D. A., Giorgio L., O'Loughlin M. A., Smith E., Gill P. G., Ingman W. V., Graham J. D., and Buchanan G. (2015) The unique transcriptional response produced by concurrent estrogen and progesterone treatment in breast cancer cells results in upregulation of growth factor pathways and switching from a Luminal A to a Basal-like subtype. BMC Cancer 15, 791 10.1186/s12885-015-1819-3 [DOI] [PMC free article] [PubMed] [Google Scholar]
- 17. Azeez J. M., Sithul H., Hariharan I., Sreekumar S., Prabhakar J., Sreeja S., and Pillai M. R. (2015) Progesterone regulates the proliferation of breast cancer cells: in vitro evidence. Drug Des. Devel. Ther. 9, 5987–5999 [DOI] [PMC free article] [PubMed] [Google Scholar]
- 18. Malet C., Spritzer P., Guillaumin D., and Kuttenn F. (2000) Progesterone effect on cell growth, ultrastructural aspect and estradiol receptors of normal human breast epithelial (HBE) cells in culture. J. Steroid Biochem. Mol. Biol. 73, 171–181 10.1016/S0960-0760(00)00061-3 [DOI] [PubMed] [Google Scholar]
- 19. Godbole M., Tiwary K., Badwe R., Gupta S., and Dutt A. (2017) Progesterone suppresses the invasion and migration of breast cancer cells irrespective of their progesterone receptor status: a short report. Cell Oncol. (Dordr.) 40, 411–417 10.1007/s13402-017-0330-z [DOI] [PMC free article] [PubMed] [Google Scholar]
- 20. Lang F., Böhmer C., Palmada M., Seebohm G., Strutz-Seebohm N., and Vallon V. (2006) (Patho)physiological significance of the serum- and glucocorticoid-inducible kinase isoforms. Physiol. Rev. 86, 1151–1178 10.1152/physrev.00050.2005 [DOI] [PubMed] [Google Scholar]
- 21. Firestone G. L., Giampaolo J. R., and O'Keeffe B. A. (2003) Stimulus-dependent regulation of serum and glucocorticoid inducible protein kinase (SGK) transcription, subcellular localization and enzymatic activity. Cell Physiol. Biochem. 13, 1–12 10.1159/000070244 [DOI] [PubMed] [Google Scholar]
- 22. Zhang P., Tchou-Wong K. M., and Costa M. (2007) Egr-1 mediates hypoxia-inducible transcription of the NDRG1 gene through an overlapping Egr-1/Sp1 binding site in the promoter. Cancer Res. 67, 9125–9133 10.1158/0008-5472.CAN-07-1525 [DOI] [PubMed] [Google Scholar]
- 23. Salnikow K., Kluz T., Costa M., Piquemal D., Demidenko Z. N., Xie K., and Blagosklonny M. V. (2002) The regulation of hypoxic genes by calcium involves c-Jun/AP-1, which cooperates with hypoxia-inducible factor 1 in response to hypoxia. Mol. Cell Biol. 22, 1734–1741 10.1128/MCB.22.6.1734-1741.2002 [DOI] [PMC free article] [PubMed] [Google Scholar]
- 24. Bandyopadhyay S., Pai S. K., Hirota S., Hosobe S., Tsukada T., Miura K., Takano Y., Saito K., Commes T., Piquemal D., Watabe M., Gross S., Wang Y., Huggenvik J., and Watabe K. (2004) PTEN up-regulates the tumor metastasis suppressor gene Drg-1 in prostate and breast cancer. Cancer Res. 64, 7655–7660 10.1158/0008-5472.CAN-04-1623 [DOI] [PubMed] [Google Scholar]
- 25. Lopez-Bergami P., Lau E., and Ronai Z. (2010) Emerging roles of ATF2 and the dynamic AP1 network in cancer. Nat. Rev. Cancer 10, 65–76 10.1038/nrc2681 [DOI] [PMC free article] [PubMed] [Google Scholar]
- 26. Chatterjee S., Chaubal R., Maitra A., Gardi N., Dutt A., Gupta S., Badwe R. A., Majumder P. P., and Pandey P. (2018) Pre-operative progesterone benefits operable breast cancer patients by modulating surgical stress. Breast Cancer Res. Treat. 170, 431–438 10.1007/s10549-018-4749-3 [DOI] [PubMed] [Google Scholar]
- 27. Kovacevic Z., Menezes S. V., Sahni S., Kalinowski D. S., Bae D. H., Lane D. J., and Richardson D. R. (2016) The metastasis suppressor, N-MYC downstream-regulated gene-1 (NDRG1), down-regulates the ErbB family of receptors to inhibit downstream oncogenic signaling pathways. J. Biol. Chem. 291, 1029–1052 10.1074/jbc.M115.689653 [DOI] [PMC free article] [PubMed] [Google Scholar]
- 28. Menezes S. V., Sahni S., Kovacevic Z., and Richardson D. R. (2017) Interplay of the iron-regulated metastasis suppressor NDRG1 with epidermal growth factor receptor (EGFR) and oncogenic signaling. J. Biol. Chem. 292, 12772–12782 10.1074/jbc.R117.776393 [DOI] [PMC free article] [PubMed] [Google Scholar]
- 29. Dixon K. M., Lui G. Y. L., Kovacevic Z., Zhang D., Yao M., Chen Z., Dong Q., Assinder S. J., and Richardson D. R. (2013) Dp44mT targets the AKT, TGF-β and ERK pathways via the metastasis suppressor NDRG1 in normal prostate epithelial cells and prostate cancer cells. Br. J. Cancer 108, 409–419 10.1038/bjc.2012.582 [DOI] [PMC free article] [PubMed] [Google Scholar]
- 30. Ma W., Na M., Tang C., Wang H., and Lin Z. (2015) Overexpression of N-myc downstream-regulated gene 1 inhibits human glioma proliferation and invasion via phosphoinositide 3-kinase/AKT pathways. Mol. Med. Rep. 12, 1050–1058 10.3892/mmr.2015.3492 [DOI] [PMC free article] [PubMed] [Google Scholar]
- 31. Hosoya N., Sakumoto M., Nakamura Y., Narisawa T., Bilim V., Motoyama T., Tomita Y., and Kondo T. (2013) Proteomics identified nuclear N-myc downstream-regulated gene 1 as a prognostic tissue biomarker candidate in renal cell carcinoma. Biochim. Biophys. Acta 1834, 2630–2639 10.1016/j.bbapap.2013.08.009 [DOI] [PubMed] [Google Scholar]
- 32. Blaes J., Weiler M., Sahm F., Hentschel B., Osswald M., Czabanka M., Thomé C. M., Schliesser M. G., Pusch S., Luger S., Winkler F., Radbruch A., Jugold M., Simon M., Steinbach J. P., et al. (2014) NDRG1 prognosticates the natural course of disease in WHO grade II glioma. J. Neurooncol. 117, 25–32 10.1007/s11060-013-1357-2 [DOI] [PubMed] [Google Scholar]
- 33. Marzook H., Deivendran S., George B., Reshmi G., Santhoshkumar T. R., Kumar R., and Pillai M. R. (2017) Cytoplasmic translocation of MTA1 coregulator promotes de-repression of SGK1 transcription in hypoxic cancer cells. Oncogene 36, 5263–5273 10.1038/onc.2017.19 [DOI] [PubMed] [Google Scholar]
- 34. Bartlett J. M., Thomas J., Ross D. T., Seitz R. S., Ring B. Z., Beck R. A., Pedersen H. C., Munro A., Kunkler I. H., Campbell F. M., Jack W., Kerr G. R., Johnstone L., Cameron D. A., and Chetty U. (2010) Mammostrat as a tool to stratify breast cancer patients at risk of recurrence during endocrine therapy. Breast Cancer Res. 12, R47 10.1186/bcr2604 [DOI] [PMC free article] [PubMed] [Google Scholar]
- 35. Sun J., Zhang D., Bae D.-H., Sahni S., Jansson P., Zheng Y., Zhao Q., Yue F., Zheng M., Kovacevic Z., and Richardson D. R. (2013) Metastasis suppressor, NDRG1, mediates its activity through signaling pathways and molecular motors. Carcinogenesis 34, 1943–1954 10.1093/carcin/bgt163 [DOI] [PubMed] [Google Scholar]
- 36. Godbole M., Chandrani P., Gardi N., Dhamne H., Patel K., Yadav N., Gupta S., Badwe R., and Dutt A. (2017) miR-129–2 mediates down-regulation of progesterone receptor in response to progesterone in breast cancer cells. Cancer Biol. Ther. 18, 801–805 10.1080/15384047.2017.1373216 [DOI] [PMC free article] [PubMed] [Google Scholar]
- 37. Clough E., and Barrett T. (2016) The Gene Expression Omnibus Database. Methods Mol. Biol. 1418, 93–110 10.1007/978-1-4939-3578-9_5 [DOI] [PMC free article] [PubMed] [Google Scholar]
- 38. Harrow J., Frankish A., Gonzalez J. M., Tapanari E., Diekhans M., Kokocinski F., Aken B. L., Barrell D., Zadissa A., Searle S., Barnes I., Bignell A., Boychenko V., Hunt T., Kay M., et al. (2012) GENCODE: the reference human genome annotation for the ENCODE Project. Genome Res. 22, 1760–1774 10.1101/gr.135350.111 [DOI] [PMC free article] [PubMed] [Google Scholar]
- 39. Li H., and Durbin R. (2010) Fast and accurate long-read alignment with Burrows-Wheeler transform. Bioinformatics 26, 589–595 10.1093/bioinformatics/btp698 [DOI] [PMC free article] [PubMed] [Google Scholar]
- 40. Li H., Handsaker B., Wysoker A., Fennell T., Ruan J., Homer N., Marth G., Abecasis G., Durbin R., and 1000 Genome Project Data Processing Subgroup (2009) The sequence alignment/map format and SAMtools. Bioinformatics 25, 2078–2079 10.1093/bioinformatics/btp352 [DOI] [PMC free article] [PubMed] [Google Scholar]
- 41. Feng J., Liu T., Qin B., Zhang Y., and Liu X. S. (2012) Identifying ChIP-seq enrichment using MACS. Nat. Protoc. 7, 1728–1740 10.1038/nprot.2012.101 [DOI] [PMC free article] [PubMed] [Google Scholar]
- 42. Ross-Innes C. S., Stark R., Teschendorff A. E., Holmes K. A., Ali H. R., Dunning M. J., Brown G. D., Gojis O., Ellis I. O., Green A. R., Ali S., Chin S. F., Palmieri C., Caldas C., and Carroll J. S. (2012) Differential oestrogen receptor binding is associated with clinical outcome in breast cancer. Nature 481, 389–393 10.1038/nature10730 [DOI] [PMC free article] [PubMed] [Google Scholar]
- 43. Kondili M., Fust A., Preussner J., Kuenne C., Braun T., and Looso M. (2017) UROPA: a tool for Universal RObust Peak Annotation. Sci. Rep. 7, 2593 10.1038/s41598-017-02464-y [DOI] [PMC free article] [PubMed] [Google Scholar]
- 44. Love M. I., Huber W., and Anders S. (2014) Moderated estimation of -fold change and dispersion for RNA-seq data with DESeq2. Genome Biol. 15, 550 10.1186/s13059-014-0550-8 [DOI] [PMC free article] [PubMed] [Google Scholar]
- 45. Langfelder P., and Horvath S. (2008) WGCNA: an R package for weighted correlation network analysis. BMC Bioinformatics 9, 559 10.1186/1471-2105-9-559 [DOI] [PMC free article] [PubMed] [Google Scholar]
- 46. Mansley M. K., and Wilson S. M. (2010) Effects of nominally selective inhibitors of the kinases PI3K, SGK1 and PKB on the insulin-dependent control of epithelial Na+ absorption. Br. J. Pharmacol. 161, 571–588 10.1111/j.1476-5381.2010.00898.x [DOI] [PMC free article] [PubMed] [Google Scholar]
- 47. Kolesnikov N., Hastings E., Keays M., Melnichuk O., Tang Y. A., Williams E., Dylag M., Kurbatova N., Brandizi M., Burdett T., Megy K., Pilicheva E., Rustici G., Tikhonov A., Parkinson H., et al. (2015) ArrayExpress update-simplifying data submissions. Nucleic Acids Res. 43, D1113–D1116 10.1093/nar/gku1057 [DOI] [PMC free article] [PubMed] [Google Scholar]
Associated Data
This section collects any data citations, data availability statements, or supplementary materials included in this article.


