Abstract
A dry reforming (DR) catalyst based on bimetallic Pd–Pt supported on carbon nanotubes is presented. The catalyst was prepared using a microwave-induced synthesis. It showed enhanced DR activity in the 773–923 K temperature range at 3 atm. Observed carbon balances between the reactant and product gases imply minimal carbon deposition. A global three-reaction (reversible) kinetic model—consisting of DR, reverse water gas shift, and CH4 decomposition (MD)—adequately simulates the observed concentrations, product H2/CO ratios, and reactant conversions. Analysis shows that, under the conditions of this study, the DR and MD reactions are net forward and far from equilibrium, while the RWGS is near equilibrium
Keywords: Carbon dioxide, catalysis, kinetics, methane, nanotubes, reforming
Introduction
Rapid increases in worldwide energy consumption require the development of alternative energy sources (Li, 2005; Elsayed et al., 2015). Hydraulic fracturing has revolutionized natural gas production, which is replacing petroleum and coal for power generation and other energy applications (Alvarez-Galvan et al., 2011). However, as much as 20% of the natural gas is lost via fugitive emissions or flaring—both adding to greenhouse gas emissions (Boothroyd et al., 2016). Therefore, surplus natural gas (CH4) conversion to liquid fuels is of great importance (Usman and Daud, 2015). Direct conversion of CH4 to liquids, remains a technical challenge since the C‒H bonds of the products are more reactive than the original C‒H bond in CH4 (Carstens and Bell, 1996).
Indirect CH4 conversion, therefore, is a preferred pathway to liquid fuel production from natural gas. These pathways begin with synthesis gas (syngas—primarily CO and H2) production by partial oxidation (Zhu and Barat, 2014), and steam or dry (CO2) dry reforming (DR) (Bartholomew and Farrauto, 2005). Methane DR (CH4 + CO2 = 2CO + 2H2) removes two greenhouse gases, thus offering both commercial and environmental benefits (Ma et al., 2013; Qu et al., 2008). The syngas is a feedstock for production of chemicals and synthetic hydrocarbons (Wu et al., 2015; Drif et al., 2015). Effective catalysts are key to efficient syngas generation.
Typical DR catalysts are supported on metal oxides such as Al2O3, SiO2, MgO, Ti2O2, and ZrO2, and can be classified into two groups (Usman and Daud, 2015; Yamagishi et al., 2006; Tomishige et al., 2004). The first group consists of supported base-metal catalysts where Fe, Co,and Ni are the common metals. Nickel displays considerable DR activity, though it has a high sintering tendency and weak coking resistance (Zhang and Li, 2015). The second group consists of supported noble metal catalysts including Rh, Ru, Pt, Pd, and Ir. Although more expensive, noble metal catalysts have superior coking resistance, higher stability, and better DR activity (Usman and Daud, 2015; Yamagishi et al., 2006).
Since the DR reactions are highly endothermic and require high temperatures, catalysts with higher activity, coking resistance, and stability are desirable. Nanoscale noble metal particles on nanosupports offer high surface-to-volume ratios and unique particle size distributions. Carbon nanotubes (CNTs) possess high thermal and electronic conductivities, high strength and specific surface area, and can serve as effective supports for nanometal (NM) particles. Together they represent hybrid structures (NM-CNTs) that combine the unique properties of both. Hence, they show promise in electronics, catalysis, and biosensors (Hull et al., 2006). Limited studies on CNTbased DR catalysis with Co/Mo/MgO and Ni immobilized on CNTs have shown moderate conversions at temperatures above 1,073 K (Khavarian et al., 2014; Ma et al., 2013).
In general, Pt is recognized as a promising catalyst in diverse applications, showing high stability and strong resistance to poisoning. Platinum is the key metal in automotive catalytic converters (Bartholomew and Farrauto, 2005), where sintering at high temperature leads to activity reduction (Wong et al., 2016; Kaneeda et al., 2009; Kim et al., 2013). Platinum/palladium (Pt–Pd) bimetallic automotive catalysts are more stable compared to Pt-only catalysts (Arai and Machida, 1996; Skoglundh et al., 1991). Platinum catalysts supported on metal oxides for DR have been widely studied (Bartholomew and Farrauto, 2005; Jing, 2005; Caprariis et al., 2016; Khani et al., 2016). The CNTs based catalysts were also applied on DR process with better performance observed. Khavarian et al. (2014) researched DR over Co–Mo–MgO/multiwall CNTs, good reaction activity was observed with lower coking tendency than other catalysts. Donphai et al. (2014) found Ni-CNTs/mesocellular silica show better stability than Ni/mesocellular silica. Therefore, Pt–Pd supported on CNTs is expected to be an effective DR catalyst.
Several synthetic routes for making NM-CNT hybrid materials were investigated. These include electrodeposition or spontaneous reduction (Correa-Duarte et al., 2004; Liu et al., 2002; Chen et al., 2007) where the NMs are deposited onto CNTs by physical adsorption; polymer-mediated deposition of prepared NMs on functionalized CNTs by electrostatic interaction or self-assembly (Che et al., 1998); and in situ synthesis of NM on functionalized CNTs. Many of these methods require elaborate procedures that limit their real-world applications. We have developed a microwave-induced reaction scheme for the synthesis of NM-CNTs (Chen and Mitra, 2008; Chen et al., 2010; Ramamurthy et al., 2011; Ntim and Mitra, 2011; Shan and Gao, 2005).
A fast, microwave-induced functionalization process offers definite advantages. Whereas a conventional covalent functionalization (refluxing, heating, sonication, and stirring) of the CNT might take many hours to even days, the microwave induced reaction time can be under 1 h. Therefore, from an industrial viewpoint, manufacturing, conventional CNT functionalization is tedious, time-consuming, and impractical. The microwave process synthesis also retains the CNT structural integrity, while distributing the metal nanoparticles.
This paper demonstrates the activity of bimetallic Pd–Pt catalyst supported on CNTs, prepared by this microwave technique, for DR reforming of CH4. Experimental data are presented along with equilibrium values. An engineering kinetic model based on three-reversible global reactions has been developed to simulate the DR experiments, including reactant conversions and product distributions.
Experimental
Catalyst preparation and characterization
The catalyst synthesis (Kumar et al., 2012) begins with the covalent carboxylation of (functionalize with –COOH groups) CNTs. 100 mg of CNTs (Cheap Tubes Inc.) were added to a microwave reaction vessel, together with 40 mL of 3:1 concentrated H2SO4 and HNO3 acids (Sigma-Aldrich). This mixture was irradiated (CEM Mars) with the microwave reaction technique (Chen and Mitra, 2008; Ramamurthy et al., 2011) for a preset temperature of 413 K for 40 min. After filtration using a 0.45 μm Teflon membrane, the resulting solid was washed with deionized (DI) water until the filtrate reached a neutral pH. The carboxylated CNTs were vacuum dried at 343 K for 12 h.
Next, 100 mg of the carboxylated CNTs was added to a microwave vessel with 30 mL of 12.5 mM PtCl2 and PdCl2 in ethylene glycol. The reaction vessel was then subjected to microwave radiation (1,280 W), resulting in a 463 K synthesis, for 10 min. In this step, the metals become involving the –COOH groups (Kumar et al., 2012). After reaction, the mixture was allowed to cool. The cooled mixture was filtered, then washed with 0.5 N aqueous HCl solution (removes excess PtCl2, PdCl2), and then DI water (removes excess HCl). The product was vacuum dried at room temperature for 12 h.
The synthesized catalyst, referred to as Pt–Pd/ CNTs, was characterized by several methods. Scanning electron microscopy and transmission electron microscopy confirm well-distributed Pt and Pd nanoparticles on the 20–30 nm diameter CNTs. Energy dispersive X-ray spectroscopy data confirm approximately equal mass (1.095 mass ratio Pd/Pt) metals content.
The composite Pt–Pd/CNT-zeolite catalyst used for the DR experiments was subjected to Brunauer–Emmett–Teller analysis for surface area, and CO Adsorption testing for Pt–Pd site density. The analyses indicated that the catalyst surface area is 14 m3/g, while the site density is 7.6 × 10⁻¹¹ mol/cm2.
To increase the bulk solids volume to facilitate loading and supporting the solid in the reactor tube, 0.4 g Pt–Pd/CNTs catalyst was mixed with 1.6 g Y-zeolite for the DR experiments described below. Blank DR tests were run for the pure Y-zeolite, and it showed no conversion of CH4 or CO2. Blank tests were also done for the CNT-zeolite (no Pt or Pd), and once again no CH4 or CO2 conversion was observed.
Dry reforming reaction apparatus
The DR experiments in this study were conducted with a previously shown setup (Zhu and Barat, 2014). Calibrated mass flow controllers govern CO2, CH4, and diluent He. A three-zone furnace contains the 0.01 m ID stainless steel reactor tube with the catalyst bed. A thin Type K thermocouple is inserted into the reactor tube to the edge of the bed. Two three-way valves allow the feed gas to either bypass the furnace or enter the reactor tube. A heated transfer line directs sample gas to a model 5890 Hewlett-Packard gas chromatograph with thermal conductivity detector (TCD). A heated six-port gas sample valve with loop is used for injecting sample or standard. The He carrier gas flow rate is 30 standard cubic centimeters per minute (sccm) through an isothermal (303 K) packed column (Hayesep D). The peaks are recorded and quantified with a lab PC and standard software. Special tests with thermocouples inserted into the leading and trailing edges of the bed confirm isothermality of the reaction bed for all cases due to the three-zone temperature controlled furnace heating.
For this DR research, the reactor temperature range studied was 773–923 K, with a 0.5–2.0 CH4/CO2 feed molar ratio range. Most experiments were run at a total flow rate of 67 sccm, with a system pressure at 308 kPa (abs.). The total catalyst mass was 2.0 g (0.4 g Pt–Pd/CNTs mixed with 1.6 g Y-zeolite), yielding a gas hourly space velocity of 1.7 L/h- gcat. Additional experiments were run at a fixed CH4/CO2 feed ratio of 1.0 while varying the total feed rate. In all experiments, a target of 85% He dilution was maintained.
Modeling
Simulations of the DR experiments will be presented in different forms. We begin with equilibrium calculations, followed by a three-step global kinetic model.
Equilibrium calculations
Equilibrium simulations of the experiments in this study were performed using the Equilibrium application within the Chemkin® (Chemkin-Pro, 2013) package. Both gaseous and condensed phases can be included so that both chemical and phase equilibria can be considered simultaneously. The fundamental calculation basis is the elementpotential method used within the Stanford software package Stanjan (Reynolds, 1986), which determines the composition that minimizes total Gibbs free energy at equilibrium at constant temperature and pressure.
In the current work, the equilibrium calculation is subject to the constraint of constant temperature and pressure, with just temperature, pressure, and feed composition specified. The available species that might exist at equilibrium are H2, H2O, CO, CO2, CH4, He, and solid carbon (Cs, when allowed), but no adsorbed species. The list includes a few other minor species that are insignificant at our DR conditions. Species thermodynamic properties are available through the Chemkin-Pro database. Graphite is assumed for solid carbon.
An example of the impact of the presence of solid carbon on the equilibrium composition is shown in Table 1 for an example experimental case. The impact of allowing Cs on the equilibrium composition is profound. Similar results were reported by Pakhare and Spivey (2014). For an initial (feed) composition where CH4/CO2 = 1, in the absence of Cs, the equilibrium H2/CO < 1. In the presence of Cs, however, the equilibrium H2/CO ≥ 1. As shown in Table 1, allowing Cs results in much less equilibrium CH4 and CO. There is roughly about the same amount of H2. In the example shown, Cs is the largest amount species after H2.
Table 1.
Impact of Cs on equilibrium; T = 923 K, P = 3 atm,initial CH4/CO2 = 1.
| Species | Feed (mole fractions) |
Equilibrium (w/o Cs) (mole fractions) |
Equilibrium (w/Cs) (mole fractions) |
|---|---|---|---|
| CH4 | 0.0720 | 0.0227 | 0.0010 |
| CO2 | 0.0720 | 0.0160 | 0.0284 |
| CO | – | 0.0930 | 0.0253 |
| H2 | – | 0.0796 | 0.0802 |
| H2O | – | 0.0067 | 0.0440 |
| He | 0.8560 | 0.7820 | 0.7497 |
| Cs | NA | NA | 0.0714 |
| SUM | 1.0000 | 1.0000 | 1.0000 |
| H2/CO | n/a | 0.856 | 3.17 |
Global kinetic model
The experimental results presented later are based on data obtained from an integral (i.e., conversions >10%) reactor. Therefore, any proposed kinetic model must be integrated along the entire catalyst bed so to be able to compare the predicted and experimental species concentrations at the bed outlet. The reactions and rate expressions forming the global kinetic model are presented in Table 2.
Table 2.
Global kinetic DR model with secondary RWGS and MD reactions, where ki = Aiexp[−Ei/(RT)] where T(K)
| Reaction i | Rate expression ri |
Approach to equil. ηi |
|---|---|---|
| Dry Reforming CH4 + CO2 = 2CO + 2H2 |
||
| Reverse Water Gas Shift CO Kp2 2 + H2 = CO + H2O |
||
| Methane Decomposition CH Kp3 4 = Cs + 2H2 |
DR, dry reforming; RWGS, reverse water gas shift.
This scheme is inspired by a similar set of three reversible reactions used to explain the direct catalytic conversion of CH4 to benzene (Li et al., 2002; Corredor et al., 2016) in a process called methane dehydroaromatization. In these references, two CH4 form C2H4 in the first reaction. In the second reaction, three C2H4 form benzene, the desired product. Finally, benzene and two C2H4 form naphthalene, an unavoidable byproduct.
The choice of DR (reaction 1) is obvious. Reverse water gas shift (RWGS, reaction 2) is known to occur during both DR and steam reforming (Wei and Iglesia, 2004). Reactions 1 and 2 together predict H2/CO < 1. However, as will be seen below, there are several instances of observed H2/CO > 1. This might be explained by either the Boudouard reaction (2CO=Cs + CO2, where Cs = solid carbon), or CH4 decomposition (MD, written as CH4 = Cs + 2H2). The equilibrium constant for MD increases at higher temperatures, while that for Boudouard decreases. It is felt that MD is more likely in this study. The MD is also consistent with the claim (Wei and Iglesia, 2004) that DR occurs through a catalytic decomposition of CH4 to adsorbed C and H atoms.
The equilibrium constants Kpi in Table 2, as functions of temperature, are obtained from an online database calculator (Bale and Belisle, 2005). Resulting Kpi, as functions of temperature (700–1,000 K), are presented in parametric form in Table 3. The kinetic parameters Ai and Ei are determined from analysis of the experimental data, as described in the next section. For Reactions 1 and 3, the first-order dependencies on CH4 are inspired by Wei and Iglesia (2004). This reference also indicated a zero-order dependency on CO2. However, the regression analysis done in this study on the data for the Pt–Pd/CNT catalyst yielded generally better results with a firstorder dependence on CO2. The first-order dependence on CO2 in Reaction 2 is inspired by Foppa et al. (2016).
Table 3.
Parameters for Kpi, based on Bale and Belisle (2005) calculator, where ln(Kpi) = a*106/T2 + b*103/T + c where T (K).
| Reaction i | Parameter a | Parameter b | Parameter c |
|---|---|---|---|
| 1 | 0 | −31.234 | 34.093 |
| 2 | −0.4303 | −3.3447 | 3.3995 |
| 3 | 0 | −10.534 | 12.851 |
The DR experiments in the current study were simulated with a packed bed reactor (PBR) model as described in Table 4. The goal of the simulation was to obtain Arrhenius parameter pairs (Ai, Ei). The species balances were integrated with an original Matlab program. All available experimental mole fraction and flow rate data at a given temperature were supplied to the program. The integration was repeated within a regression loop that optimized the three rate constants ki at that temperature. This integration/regression procedure was performed for each temperature. When done, the rate constants ki were correlated (Figure 1) for the Arrhenius parameters for each reaction (Table 5).
Table 4.
Key equations of PBR simulation of three-reaction global model.
| PBR balances species j |
Net rates rj | Mole fractions yj |
Partial pressures |
|---|---|---|---|
|
|
|||
| Total molar rate includes inert gas |
P = total pressure |
||
PBR, packed bed reactor
Figure 1.
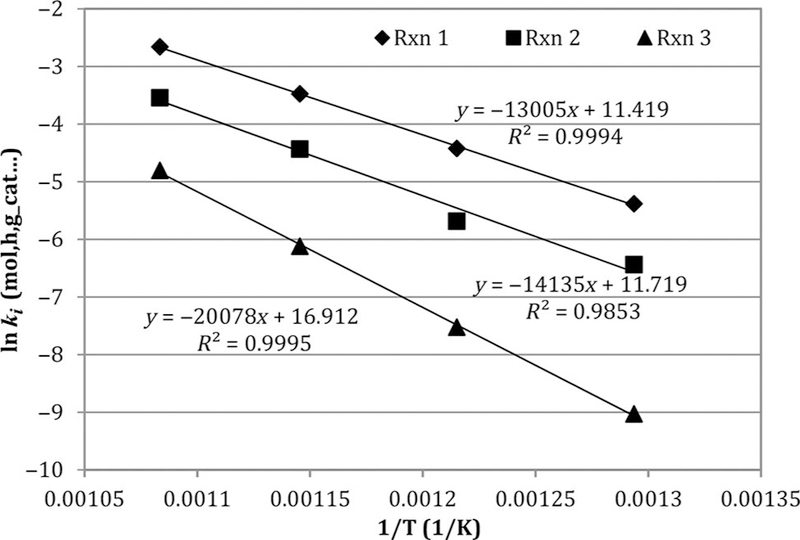
Arrhenius plots of forward rate constants ki from Table 2, based on regression of integrated species balances from Table 4 against experimental DR data. Note: DR, dry reforming.
Table 5.
| Reaction i | Parameter Ai (mol, h, g_cat, atm) |
Parameter Ei(cal/mole) |
|---|---|---|
| 1 | 9.104E4 | 25,840 |
| 2 | 1.229E5 | 28,090 |
| 3 | 2.212E7 | 39,890 |
Figure 1 presents the Arrhenius plots of the global rate constants ki obtained from the Matlab regressions of the DR data collected in this study. Arrhenius parameters are presented in Table 5. The Arrhenius fits are quite linear over the temperature range (773–923 K). Not surprisingly, the CH4 decomposition has the largest barrier among the three reactions.
In section below, the experimental results are presented together with corresponding equilibrium and global model values. These are all from the reactor outlet as functions of temperature, feed CH4/CO2, and flow rate. Before these, however, it is worth showing the global model-predicted species profiles along the reactor. Figure 2 shows these smooth, monotonic profiles for 923 K, 3 atm, feed flow = 66 sccm, and feed CH4/CO2 = 1. The experimental outlet points are also shown. Reactants CO2 and CH4 decrease together, while H2 and CO rise steadily, though with H2/CO < 1. A significant portion of the H in the feed CH4 is converted to H2O.
Figure 2.
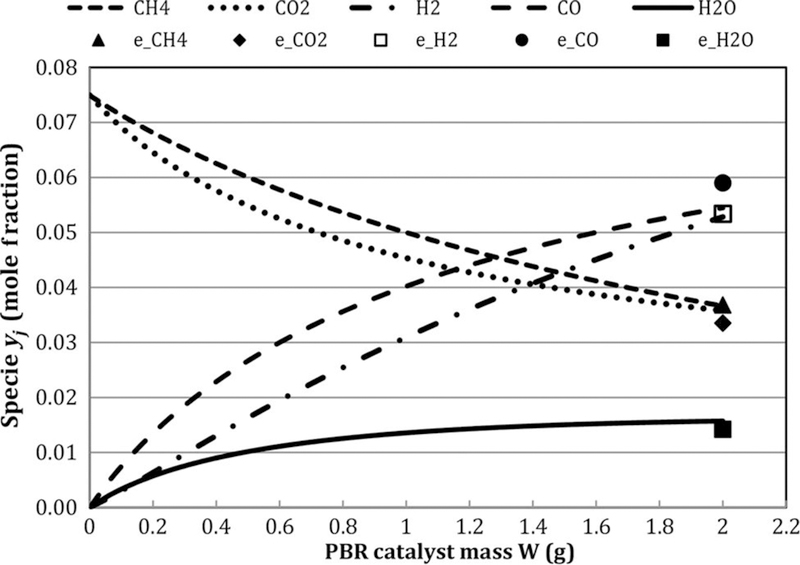
Global model-predicted species PBR profiles for case:T = 923 K, feed CH4/CO2 = 1, GHSV = 1.7 L/h- gcat; exp. Outlet data (e_*) also shown. Note: GHSV, gas hourly space velocity; PBR, packed bed reactor.
The advantage of the global three-reaction model is its relative simplicity and ease-of-use for engineering calculations, as illustrated in Figure 2. In addition, since all three reactions are reversible, insight can be gained by considering the approaches to equilibrium ηi, including how these vary along the PBR. Figure 3 illustrates these for the case used in Figure 2. It shows that DR and methane decomposition (MD) are far away from equilibrium even at the end of reactor. But RWGS moves rapidly toward equilibrium. This is consistent with analysis of others that, during CH4 reforming, the shift chemistry is effectively at equilibrium (Wei and Iglesia, 2004).
Figure 3.
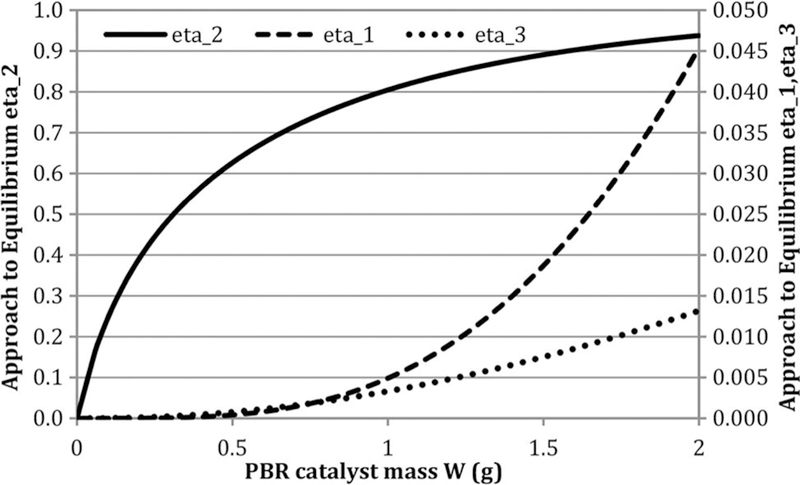
Approaches to equilibrium (ηi) for case: T = 923 K, feed CH4/CO2 = 1, GHSV = 1.7 L/h- gcat. Note: GHSV, gas hourly space velocity; PBR, packed bed reactor.
Results and discussion
We begin with species concentrations measured at the reactor outlet, together with the three-reaction global model predictions, at functions of temperature and feed molar CH4/CO2 ratio. These results are followed by sample reactant conversions and H2/CO ratio. These are accompanied by the global model predictions and equilibrium values.
Species concentrations at reactor outlet
Figure 4 presents the outlet mole fractions at different feed CH4/CO2 at constant feed rate and temperature 823 K. Figure 5 presents the compositions at CH4/CO2 = 1.5 at constant feed rate. The mole fractions of CO, H2, and H2O are not strongly affected by CH4/CO2. However, the trends are stronger at the higher temperature. All the agreements are reasonable, so the global model is effective.
Figure 4.
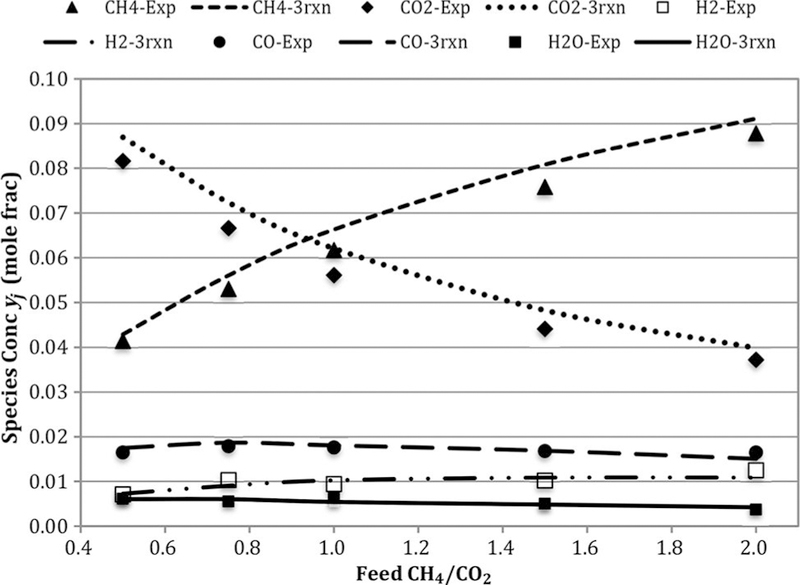
Comparison of experimental and three-reaction model-based outlet concentrations for cases: 823 K and GHSV = 1.7 L/h- gcat. Note: GHSV, gas hourly space velocity.
Figure 5.
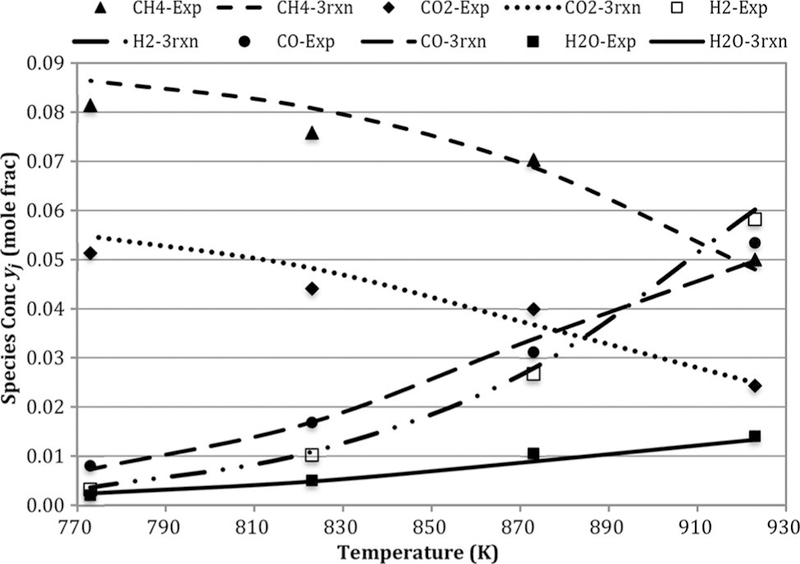
Comparison of experimental and three-reaction model-based outlet concentrations for cases: CH4/CO2 = 1.5 and GHSV = 1.7 L/h- gcat. Note: GHSV, gas hourly space velocity.
Methane and carbon dioxide conversions
Ideally, conversions would be calculated from measured compositions and known total molar rates. Since the feed gas was highly diluted by He (∼85%), change of total moles was fairly small. However, careful examination of the GC data show that the sums of the effluent CH4, CO2, and CO mole fractions are consistently lower than the sums of the CO2 and CH4 feed mole fractions by up to 12%, depending on temperature and feed CH4/CO2 ratio. If the ideal DR reaction stoichiometry is assumed, roughly half of these shortfalls can be accounted for by the increase in total moles due to reaction. The remainder is likely due to minor carbon deposits.
These effects suggest that fractional CH4 and CO2 conversions calculated directly from measured inlet and outlet mole fractions could be overstated by as much as 18 and 9%, respectively, due to the total mole increase. All H2O concentrations were estimated by the O atom differences from measured inlet and effluent CO and CO2. Since CH4 was the only H atom source, after H2O was estimated with the O atom balance, the H2 content balance. Where feasible, selected H2 contents were verified by the TCD peak. It is noted that small errors in the calculated H2 and H2O mole fractions result from using the CO, CO2, and CH4 outlet mole fractions directly, as with the conversions. No O2 was detected by the TCD during any runs.
Figure 6 shows experimental, three-reaction model, and equilibrium conversions as functions of temperature at the highest (2.0) and lowest (0.5) feed CH4/CO2 ratio runs. All conversions are simply based on inlet and outlet mole fractions. Both CH4 and CO2 equilibrium conversions far exceeded observed values, and were fairly insensitive to temperature. Methane equilibrium conversions exceed those of CO2, and very close to 100%. Trends for the other temperatures tested were similar and fell in between the high and low values. The three-reaction global model predictions for conversions are excellent. Similar patterns are seen in Figure 7 as functions of feed CH4/CO2. At 923 K, the observed CO2 conversions are much closer to equilibrium values.
Figure 6.
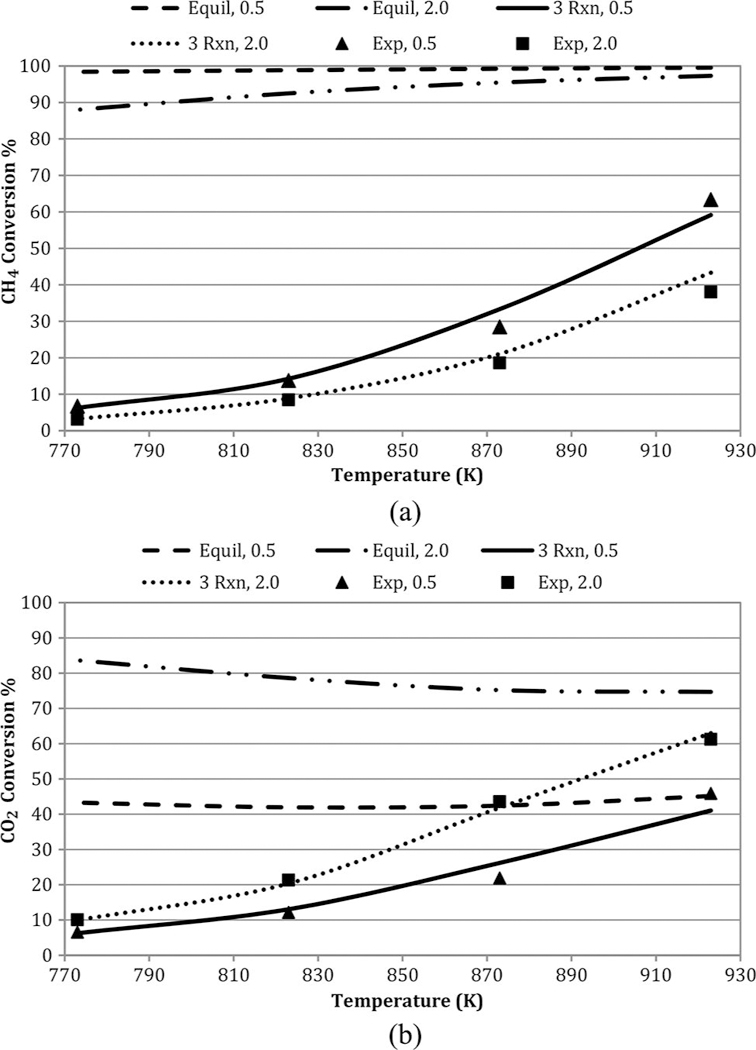
Influence of temperature on (a) CH4 and (b) CO2 conversions at GHSV = 1.7 L/h- gcat; feed CH4/CO2 = 0.5 and 2.0. Note: GHSV, gas hourly space velocity.
Figure 7.
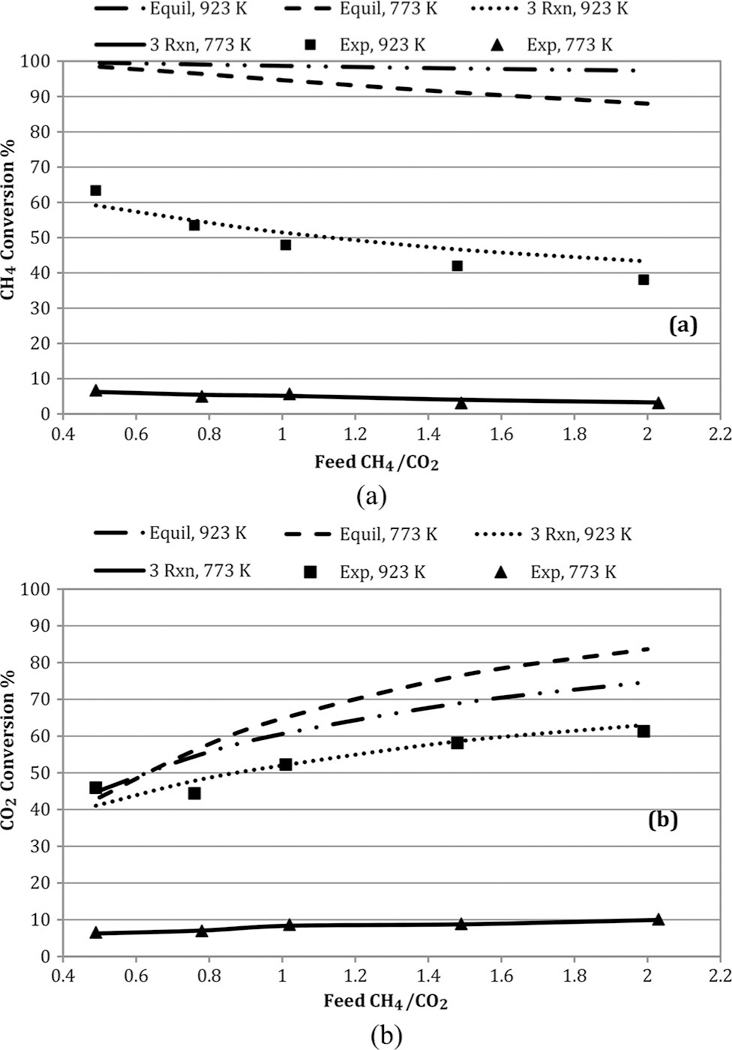
Impact of feed CH4/CO2 on (a) CH4 and (b) CO2 conversions at GHSV = 1.7 L/h- gcat. Note: GHSV, gas hourly space velocity.
Syngas molar ratio H2/CO
The product mole fraction ratio H2/CO is an important measure of reforming catalyst effectiveness since many industrial processes prefer high syngas H2/CO ratios (Bartholomew and Farrauto, 2005). Figure 8 shows that higher temperatures and feed CH4/CO2 favor higher H2/CO. The three-reaction global model does a good job modeling the observed ratios. At both 773 and 923 K, the equilibrium ratios far exceed the observed values.
Figure 8.
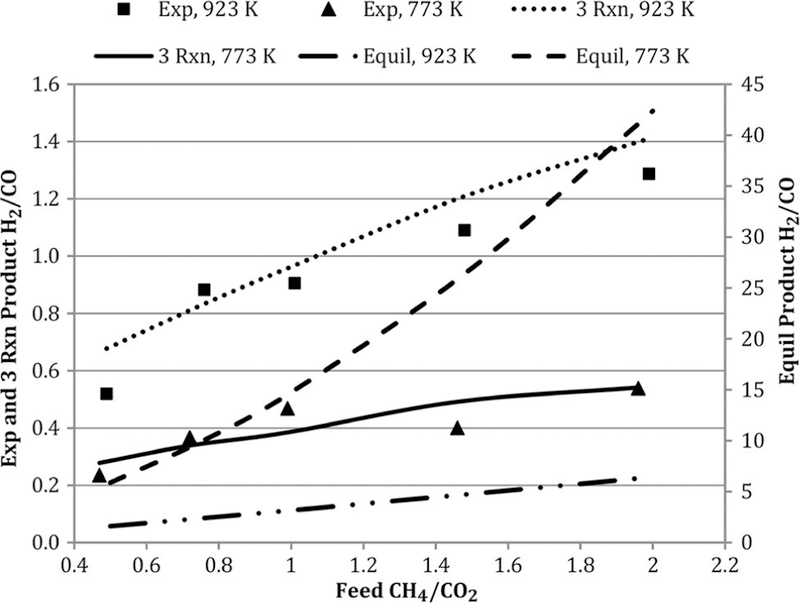
Effect of temperature and feed molar ratio on H2/CO at GHSV = 1.7 L/h- gcat. Note: GHSV, gas hourly space velocity.
The stoichiometric H2/CO for the ideal DR reaction is 1.0. At the 773 K, the observed H2/CO at feed CH4/CO2 = 1 is <1. This is attributed to the RWGS reaction, which is more thermodynamically favored at these relatively low temperatures (Quiroga and Luna, 2007). At 923 K, the experimental and three-reaction model ratios >1.0 are consistent with Cs formation.
Conclusion
A bimetallic catalyst supported on CNT was used for the dry reforming (DR) of CH4 to synthesis gas using CO2. The catalyst, containing equal amounts (by weight) of Pd and Pt, was prepared by a microwave-induced reaction. The DR studies were done in an isothermal PBR. The CNT catalyst containing Pd/Pt showed excellent DR activity, both in terms of reactant conversions and product H2/CO, at temperatures lower than typically required for conventional DR catalysts. A threereaction (reversible) global model consisting of DR, RWGS, and MD adequately describes the observed experimental results. This model is valid for this catalyst over a 773–923 K range, with linear Arrhenius temperature dependencies on the forward rate constants. The results show that, under the conditions of this study, the DR and MD reactions are far from equilibrium (net forward), while the RWGS is close to equilibrium.
Acknowledgments
Funding
This work was supported by the National Institute of Environmental Health Sciences (NIEHS) under Grant No. R01ES023209. Any opinions, findings, and conclusions or recommendations expressed in this material are those of the author(s) and do not necessarily reflect the views of the NIEHS. The authors also appreciate support from their respective departments, as well as a Faculty Instrument Usage Grant from the NJIT Material Characterization Laboratory.
References
- Alvarez-Galvan MC, Mota N, Ojeda M, Rojas S, Navarro RM, and Fierro JLG (2011). Direct methane conversion routes to chemicals and fuels, Catal. Today,171, 15–23 [Google Scholar]
- Arai H, and Machida M (1996). Thermal stabilization of catalyst supports and their application to high-temperature catalytic combustion, Appl. Catal. A Gen, 138, 161–176. [Google Scholar]
- Bale C, and Belisle E (2005). Reaction http://www.crct.polymtl.ca/reacweb.htm.
- Bartholomew CH, and Farrauto RJ (2005). Industrial Catalysis Processes, John Wiley & Sons, Hoboken, New Jersey. [Google Scholar]
- Boothroyd IM, Almond S, Qassim SM, Worrall F, and Davies RJ (2016). Fugitive emissions of methane from abandoned, decommissioned oil and gas wells, Sci. Total Environ, 547, 461–496. [DOI] [PubMed] [Google Scholar]
- Caprariis B, Filippis P, Palma V, Petrullo A, Ricca A, Ruocco C, and Scarsella M (2016). Rh, Ru and Pt ternary perovskites type oxides BaZr(1-x)MexO3 for methane dry reforming, Appl. Catal. A Gen, 517, 47–55. [Google Scholar]
- Carstens JN, and Bell AT (1996). Methane activation and conversion to higher hydrocarbons on supported ruthenium, J. Catal, 161, 423–429. [Google Scholar]
- Che GL, Lakshmi BB, Fisher ER, and Martin CR (1998). Carbon nanotubule membranes for electrochemical energy storage and production, Nature, 393, 346–349. [Google Scholar]
- Chemkin-Pro, 2013. Version 15131 Reaction Design,San Diego: http://www.ansys.com/products/fluids/ansyschemkin-pro. [Google Scholar]
- Chen Y, Iqbal Z, and Mitra S (2007). Microwave-induced controlled purification of single-walled carbon nanotubes without sidewall functionalization, Adv. Funct. Mater, 17, 3946–3951. [Google Scholar]
- Chen Y, and Mitra S (2008). Fast microwave-assisted purification, functionalization and dispersion of multi-walled carbon nanotubes, J. Nanosci. Nanotechnol, 11, 5770–5775. [DOI] [PubMed] [Google Scholar]
- Chen Y, Zhang X, and Mitra S (2010). Solvent dispersible nanoplatinum–carbon nanotube hybrids for application in homogeneous catalysis, Chem. Commun, 46, 1652–1654. [DOI] [PubMed] [Google Scholar]
- Correa-Duarte MA, Sobal N, Liz-Marzan LM, and Giersig M (2004). Linear assemblies of silica-coated gold nanoparticles using carbon nanotubes as templates, Adv. Mater, 16, 2179–2184. [Google Scholar]
- Corredor E, Chitta P, and Deo M (2016). Membrane reactor system model for gas conversion to benzene, Fuel,179, 202–209. [Google Scholar]
- Donphai W, Faungnawakij K, Chareonpanich M, and Limtrakul J (2014). Effect of Ni-CNTs/mesocellular silica composite catalysts on carbon dioxide reforming of methane, Appl. Catal. A Gen, 475, 16–26. [Google Scholar]
- Drif A, Bion N, Brahmi R, Ojala S, Pirault-Roy L, Turpeinen E, Seelam PK, Keiski RL, and Epron F (2015). Study of the dry reforming of methane and ethanol using Rh catalysts supported on doped alumina, Appl. Catal. A Gen, 504, 576–584. [Google Scholar]
- Elsayed NH, Roberts NRM, Joseph B, and Kuhn JN (2015). Low temperature dry reforming of methane over Pt–Ni–Mg/ceria–zirconia catalysts, Appl. Catal. B Environ, 179, 213–219. [Google Scholar]
- Foppa L, Silaghi M, Larmier K, and Comas-Vives A(2016). Intrinsic reactivity of Ni, Pd and Pt surfaces in dry reforming and competitive reactions: Insights from first principles calculations and microkinetic modeling simulations, J. Catal, 343, 196–207. [Google Scholar]
- Hull RV, Li L, Xing YC, and Chusuei CC (2006). Pt nanoparticle binding on functionalized multiwalled carbon nanotubes, Chem. Mater, 18, 1780–1788. [Google Scholar]
- Jing Q (2005). Study of Catalysis Conversion of Methane,Zhengzhou University Press, Zhengzhou, China. [Google Scholar]
- Kaneeda M, Iizuka H, Hiratsuka T, Shinotsuka N, and Arai M (2009). Improvement of thermal stability of NOoxidation Pt/Al2O3 catalyst by addition of Pd, Appl. Catal.B Environ, 90, 564–569. [Google Scholar]
- Khani Y, Shariatinia Z, and Bahadoran F (2016). High catalytic activity and stability of ZnLaAlO4 supported Ni,Pt and Ru nanocatalysts applied in the dry, steam and combined dry-steam reforming of methane. Chem. Eng.J, 299, 353–366. [Google Scholar]
- Khavarian M, Chai SP, and Mohamed AR (2014). Direct use of as-synthesized multi-walled carbon nanotubes for carbon dioxide reforming of methane for producing synthesis gas, Chem. Eng. J, 257, 200–208. [Google Scholar]
- Kim J, Kim E, Han J, and Han HS (2013). Pt/Pd bimetallic catalyst with improved activity and durability for lean-burn CNG engines, SAE Int. J. Fuels Lubricants, 6, 651–656. [Google Scholar]
- Kumar LV, Ntim SA, Sae-Khow O, Janardhana C, Lakshminaryayanan V, and Mitra S (2012). Electrocatalytic activity of multiwall carbon nanotube-metal (Pt or Pd) nanohybrid materials synthesized using microwave-induced reactions and their possible use in fuel cells, Electrochim. Acta, 83, 40–46. [DOI] [PMC free article] [PubMed] [Google Scholar]
- Li L, Borry RW, and Iglesia E (2002). Design and optimization of catalysts and membrane reactors for the non-oxidative conversion of methane, Chem. Eng. Sci, 57, 4595–4604. [Google Scholar]
- Li X (2005). Diversification and localization of energy systems for sustainable development and energy security, Energy Policy, 33, 2237–2243. [Google Scholar]
- Liu Z, Lin X, Lee JY, Zhang W, Han M, and Gan LM (2002). Preparation and characterization of platinum-based electrocatalysts on multiwalled carbon nanotubes for proton exchange membrane fuel cells, Langmuir, 18,4054–4060. [Google Scholar]
- Ma Q, Wang D, Wu M, Zhao T, Yoneyama Y, and Tsubaki N (2013). Effect of catalytic site position: Nickel nanocatalyst selectively loaded inside or outside carbon nanotubes for methane dry reforming, Fuel, 108, 430–438. [Google Scholar]
- Ntim SA, and Mitra S (2011). Removal of trace arsenic to meet drinking water standards using iron oxide coated multiwall carbon nanotubes, J. Chem. Eng. Data, 56,2077–2083. [DOI] [PMC free article] [PubMed] [Google Scholar]
- Pakhare D, and Spivey J (2014). A review of dry (CO2)reforming of methane over noble metal catalysts, Chem. Soc. Rev, 43, 7813–7837. [DOI] [PubMed] [Google Scholar]
- Qu Y, Sutherland AM, and Guo T (2008). Carbon dioxide reforming of methane by Ni/Co nanoparticle catalysts immobilized on single-walled carbon nanotubes, Energy Fuels, 22, 2183–2187. [Google Scholar]
- Ramamurthy SS, Chen Y, Kalyan MK, Rao GN,Chelli J, and Mitra S (2011). Carbon nanotube-zirconium dioxide hybrid for defluoridation of water, J. Nanosci. Nanotechnol, 11, 3552–3559. [DOI] [PubMed] [Google Scholar]
- Reynolds WC (1986). The Element Potential Method for Chemical Equilibrium Analysis: Implementation in the Interactive Program STANJAN, Department of Mechanical Engineering, Stanford University. [Google Scholar]
- Shan Y, and Gao L (2005). Synthesis and characterization of phase controllable ZrO2–Carbon nanotube nanocomposites,Nanotechnology, 16, 625–630. [Google Scholar]
- Skoglundh M, Lowendahl L, and Otterated JE (1991).Combinations of platinum and palladium on alumina supports as oxidation catalysts, Appl. Catal, 77, 9–20. [Google Scholar]
- Tomishige K, Asadullah M, and Kunimori K (2004). Syngas production by biomass gasification using Rh/CeO2/SiO2 catalysts and fluidized bed reactor, Catal. Today, 89, 389–403. [Google Scholar]
- Usman M, and Daud WM (2015). A dry reforming of methane: Influence of process parameters—A review, Renewable Sustainable Energy Rev, 45, 710–744. [Google Scholar]
- Wei J, and Iglesia E (2004). Mechanism and site requirements for activation and chemical conversion of methane on supported Pt clusters and turnover rate comparisons among noble metals, J. Phys. Chem. B, 108,4094–4103. [Google Scholar]
- Wong AP, Kyriakidoua EA, Toops TJ, and Regalbuto JR (2016). The catalytic behavior of precisely synthesized Pt–Pd bimetallic catalysts for use as diesel oxidation catalysts, Catal. Today, 267, 145–156. [Google Scholar]
- Wu T, Zhang Q, Cai W, Zhang P, Song X, Sun Z, and Gao L (2015). Phyllosilicate evolved hierarchical Ni- and Cu–Ni/SiO2 nanocomposites for methane dry reforming catalysis, Appl. Catal. A Gen, 503, 94–102. [Google Scholar]
- Yamagishi T, Furikado I, Ito S, Miyao T, Naito S, Tomishige K, and Kunimori K (2006). Catalytic performance and characterization of RhVO4/SiO2 for hydroformylation and CO hydrogenation, J. Mol. Catal. A Chem, 244, 201–212. [Google Scholar]
- Zhang J, and Li F (2005). Coke-resistant Ni@SiO2 catalyst for dry reforming of methane, Appl. Catal. B Environ,176–177, 513–521. [Google Scholar]
- Zhu Y, and Barat R (2014). Partial oxidation of methane over a ruthenium phthalocyanine catalyst, Chem. Eng. Sci, 116, 71–76. [Google Scholar]


