Abstract
The G-protein complex is a cytoplasmic on-off molecular switch that is set by plasma membrane receptors that activate upon binding of its cognate extracellular agonist. In animals, the default setting is the “off” resting state, while in plants, the default state is constitutively “on” but repressed by a plasma membrane receptor-like protein. De-repression appears to involve specific phosphorylation of key elements of the G-protein complex and possibly target proteins that are positioned downstream of this complex. To address this possibility, we quantified protein abundance and phosphorylation state in wild type and G-protein deficient Arabidopsis roots in the unstimulated resting state. A total of 3,246 phosphorylated and 8,141 non-modified protein groups were identified. We found that 428 phosphorylation sites decreased and 509 sites increased in abundance in the G-protein quadrupole mutant lacking an operable G-protein-complex. Kinases with known roles in G-protein signaling including MAP KINASE 6 and FERONIA were differentially phosphorylated along with many other proteins now implicated in the control of G-protein signaling. Taken together, these datasets will enable the discovery of novel proteins and biological processes dependent on G-protein signaling.
In animals, the majority of extracellular signals, such as photons, small molecules, odorants, peptides and signaling proteins are discriminated by 7-transmembrane G-protein coupled receptors (GPCR) located on the plasma membrane [1]. Upon binding, the resulting “activated” GPCR becomes phosphorylated by kinases, typically GPCR kinases (GRK) and thus by forming a uniquely-altered state may recruit a cytoplasmic phosphosite-binding adaptor protein called β-arrestin [2]. The interaction between β-arrestin and the phosphorylated GPCR sets in motion a number of cell processes such as triggering a MAP kinase phosphorylation cascade [3]. Another pathway from activated GPCR to the initiation of cellular processes occurs by coupling to a cytoplasmic heterotrimeric G-protein complex. This complex is comprised of a guanine nucleotide-binding Gα subunit and a Gβγ obligate dimer [4]. The GPCR activates the complex by catalyzing the dissociation of GDP to allow for GTP binding which in turn, dissociates leaving both the G subunit and the G dimer to activate target proteins. The intrinsic GTP hydrolysis activity of the G subunit returns the complex back to the resting heterotrimeric state ready for re-activation within this G cycle. This GTPase reaction is sometimes accelerated by a cytoplasmic Regulator of G Signaling (RGS) protein [5].
In plants, regulation of the G cycle is dramatically different. The Gα subunit, despite having a nearly identical structure as the vertebrate G subunit [6,7], is active state in the absence of a GPCR. Modulation of the G cycle occurs by a receptor-like RGS protein; the prototype being Arabidopsis RGS1 (AtRGS1) [8]. AtRGS1 endocytosis [9] requires phosphorylation by members of the WITH NO LYSINE (WNK) kinase family [10] at serines in its C-terminal tail [11]. Other serines on RGS proteins are either predicted or shown to be phosphorylated [12] suggesting a phospho-barcode is utilized to direct different AtRGS1 functions.
Besides AtRGS1, there are other components of the Arabidopsis G-protein complex [13]: one canonical Gα subunit (AtGPA1), one Gβ subunit, three Gγ subunits with one being atypical having a transmembrane domain [14], and three atypical Gα subunits [15]. These EXTRA-LARGE G subunits (XLG) have homology to the canonical G subunits but critical structure for nucleotide binding is absent suggesting that these G-proteins act independently of GTP [16]. Nonetheless, these atypical G subunits bind the Gβγ dimer and loss of the Arabidopsis Gβ subunit AGB1 in an agb1 null mutant abolishes function of both the canonical and atypical G subunit-dependent functions [15,17].
XLG2 is phosphorylated on the N-terminal half by a cytoplasmic kinase, BIK1 [18] and may modulate a cellular process in innate immunity. The canonical Gα subunit AtGPA1 is phosphorylated by a receptor kinase that operates in the innate immunity pathway [19]. A phosphomimetic AtGPA1 mutant switches the behavior of AtRGS1 on this substrate in a novel mechanism called “substrate phosphoswitching”. Thus, it is abundantly clear that several key elements of the plant G cycle are phosphorylated suggesting that feed backs and feed forward controls utilize reversible phosphorylation. The extent of this G-protein dependent phosphorylation is unknown as are the kinases involved and their substrates.
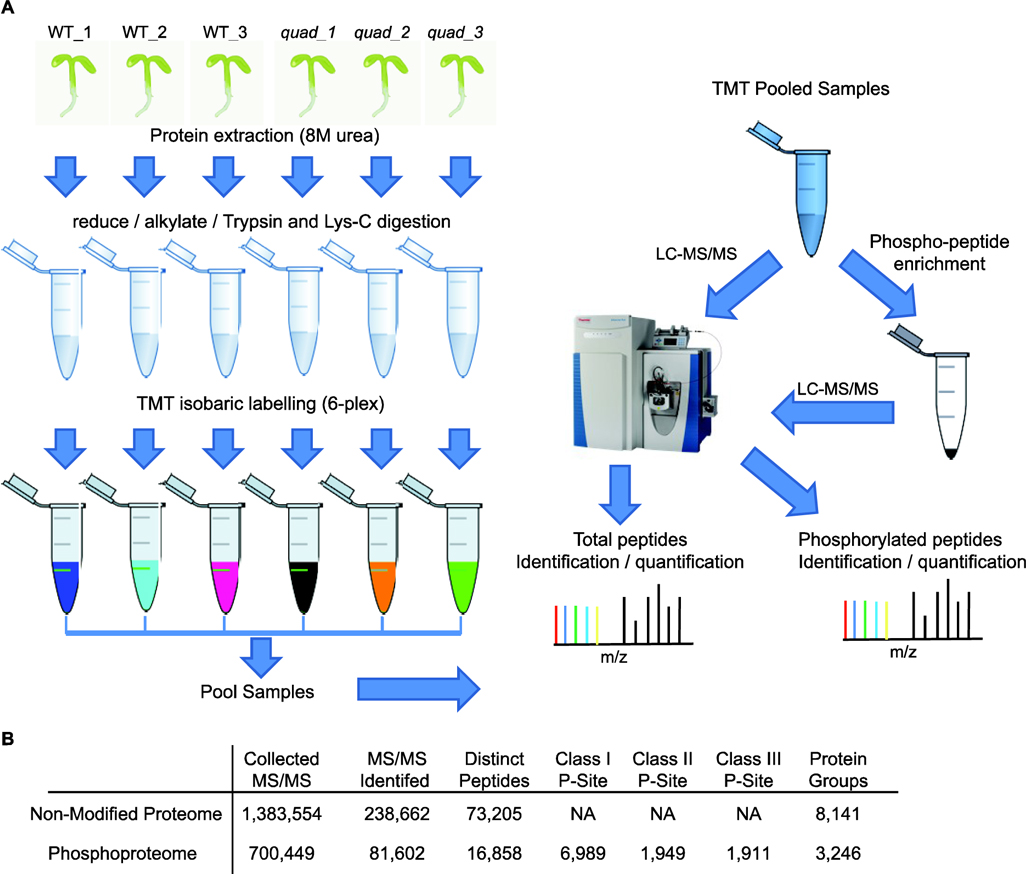
In this study, we performed quantitative proteomics to uncover changes in protein abundance and phosphorylation state that result from altered G-protein signaling. For this we examined wild-type (WT) as well as quadruple mutant plants deficient in Gα, Gβ, and two out of the three Gγ subunits, in Arabidopsis [20]. Specifically, we grew WT Columbia (Col-0) and gpa1–4, agb1–2, agg1–1, and agg2–1 quadruple mutant (designated quad hereafter) plants on agar plates [20]. After 12 days we harvested root tissue from three independent biological replicates, per genotype, for proteomic analyses (See Supporting Methods for details). We extracted proteins using urea and processed them into peptides via in solution digestion [21,22]. One hundred and thirty µg of peptides, for each biological replicate, was then labeled with six-plex Tandem Mass Tags (TMT) [23,24]. TMT-labeled samples were pooled and 30 µg were used directly to quantify protein abundance (i.e. non-modified proteome) by 2D-LC-MS/MS. The remaining 750 µg of pooled TMT labeled peptides was subjected to phosphopeptide enrichment using Titansphere Phos-TiO2 beads prior to 2D-LC-MS/MS analysis. 2D-LC/MS/MS was performed using online strong cation exchange (SCX) as the first dimension and low pH reverse-phase as the second dimension to deliver peptides to a Q Exactive Plus mass spectrometer [22,25]. Finally, we used MaxQuant [26] to identify peptides, localize phosphorylation sites, and quantify protein and phosphorylation abundance (Figure 1A).
Figure 1.

Quantitative proteomics of a G-protein deficient quadrupole mutant. A) Workflow overview where protein from three biological replicates of WT and three biological replicates of quad mutant plants is isolated and digested into peptides prior to isobaric labeling with TMT. The pooled TMT samples are then either directly analyzed by 2D-LC-MS/MS to quantify protein abundance or used for phosphopeptide enrichment with Titansphere Phos-TiO2 beads prior to analysis. B) Summary of the number of identified MS/MS, distinct peptides, protein groups, and phosphorylation sites in this study.
We identified 8,141 protein groups (i.e. proteins) from the non-modified proteome analysis. For further quantitative analyses, we focused on the 6,632 protein groups that had TMT intensity values greater than zero (Figure 1B and Supplemental Table 1). Additionally, from the phosphopeptide enriched material we quantified the level of 6,989 Class I (localization probability ≥ 0.75), 1,949 Class II (0.75 > localization probability ≥ 0.5), and 1,911 class III (localization probability < 0.5) phosphorylation sites arising from 3,246 phosphoproteins (Figure 1B and Supplemental Table 2). Examination of the identified phosphoproteins revealed 415 proteins are not present in the PhosPhAt database (Supplemental Table 2), which curates known Arabidopsis phosphoproteins [27]. For further analyses, we focused on the Class I and Class II phosphorylation sites. Finally, we examined reproducibility of the biological replicate analyses and found high Pearson correlation values (r > 0.97) for all replicates (Supplemental Figures 1 and 2).
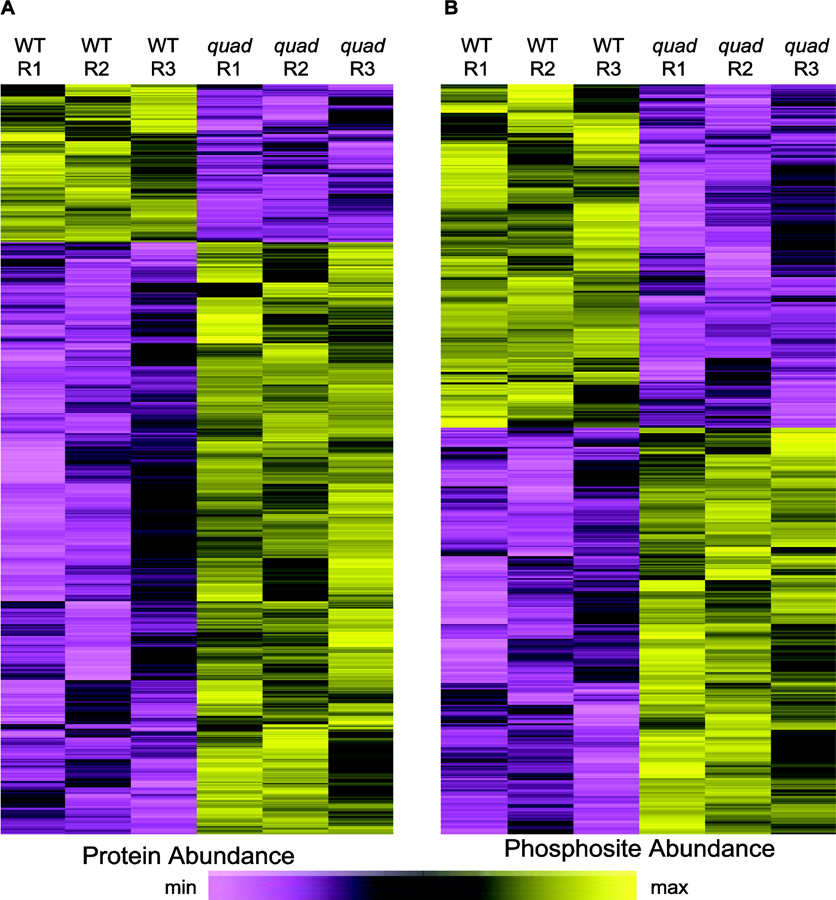
Next, we identified proteins and phosphorylation sites that were altered in abundance in the quad mutant plants. For these statistical analyses we used the software package Perseus [28,29] to calculate two-sample t-tests and perform permutation-based false discovery rate (FDR) correction. We designated proteins/phosphorylation sites as differentially accumulating if they had a P-value ≤ 0.05 and a q-value ≤ 0.1 (i.e. FDR-adjusted P-value). This revealed 177 proteins that decreased and 670 that increased in abundance in the quad mutant relative to WT plants (Figure 2A, Supplemental Figure 3 and Supplemental Table 1). Furthermore, 428 phosphorylation sites decreased and 509 sites increased in abundance in the quad mutant (Figure 2B, Supplemental Figure 3 and Supplemental Table 2). Taken together these results demonstrate extensive alteration of phosphoproteome composition in G-protein signaling deficient plants.
Figure 2.

Plants deficient in G-protein signaling exhibit extensive alteration in protein and phosphorylation levels. Hierarchical clustering of 847 differentially accumulating proteins (A) and 937 phosphorylation sites (B) in quad mutant plants.
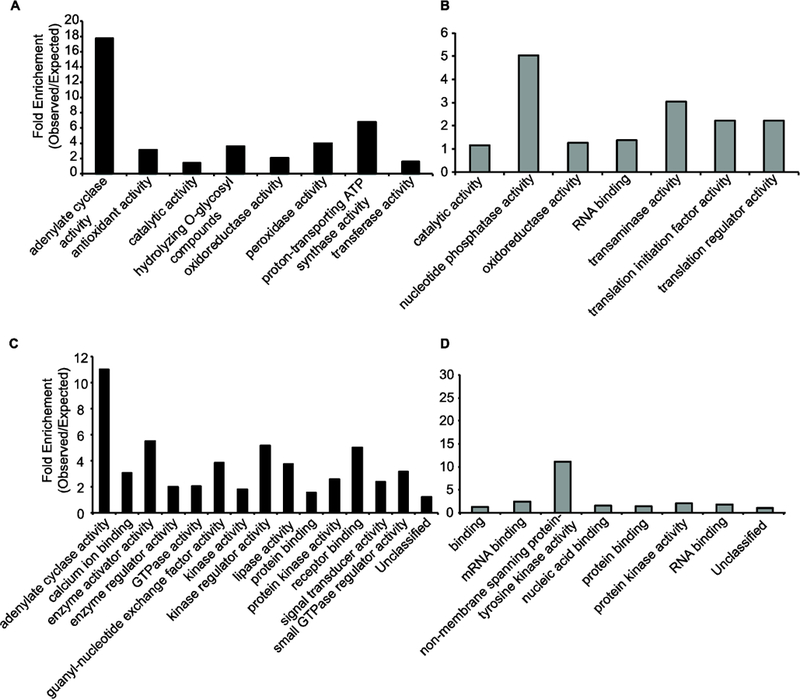
To gain insight into the biological processes that are impacted by altered G-protein signaling in the quad mutants we performed gene ontology (GO) enrichment analyses. For this we used Panther to examine enrichment of both full GO and GO-SLIM annotation sets [30] (Figure 3 and Supplemental Tables 3&4). Consistent with a deficiency in G-protein signaling in the quad mutants numerous GO terms related to G-proteins were overrepresented in proteins exhibiting decreased phosphorylation levels (Figure 3 and Supplemental Table 4). Additionally, GO terms related to biological processes known to be impacted by G-protein signaling such as hexose biosynthesis, cell wall, and, gibberellin [13] are overrepresented among proteins that were decreased in abundance in the quad mutant (Supplemental Table 3).
Figure 3.

Gene Ontology enrichment analyses of G-protein deficient plants. Fold-enrichment of GO-SLIM Molecular Function terms for proteins that decrease (A), proteins that increase (B), phosphorylation sites that decrease (C), or sites that increase (D) in quad mutants. Graphed data are all GO-SLIM Molecular Function terms that exhibit statically significant enrichment (P-value ≤ 0.05).
Finally, we examined the list of differentially phosphorylated proteins in the quad mutant to determine if any are known interactors of GPA1, AGB1, AGG1, and/or AGG2 based on previous reports [31–34]. This analysis revealed 24 known interactors that are differentially phosphorylated in the quad mutant (Supplemental Table 2). For example, XLG2 and XLG3 exhibit decreased phosphorylation in quad plants. Additionally, multiple interacting kinases, with known roles in G-protein signaling, including MAP KINASE 6 (MPK6) [35] and FERONIA (FER) [34,36], are differentially phosphorylated. Furthermore, NON-PHOTOTROPIC HYPOCOTYL 3 (NPH3), which interacts with AGB1 and the blue light photoreceptor NPH1 to link G-protein and phototropic responses [37], is dephosphorylated in the quad mutant.
In summary, we have performed in depth protein abundance and phosphorylation state profiling of G-protein signaling deficient plants. The observations highlighted above suggest that these datasets will enable the discovery of novel proteins and biological processes dependent on G-protein signaling.
Supplementary Material
Acknowledgments
We thank Christian Montes-Serey for the proteomics workflow figure. This work was supported by NIH (1R01GM120316–01A1), NSF (1759023), and by the ISU Plant Sciences Institute awarded to Justin W. Walley and NIGMS (R01GM065989) and NSF (MCB-0718202) awarded to Alan. M. Jones.
Abbreviations
- (AGB1)
ARABIDOPSIS G-PROTEIN BETA SUBUNIT
- (BIK1)
BOTRYTIS-INDUCED KINASE1
- (XLS)
EXTRA-LARGE G
- (FER)
FERONIA
- (GPCR)
G-protein coupled receptors
- (GRK)
G-protein coupled receptor kinases
- (GPA1)
G-PROTEIN ALPHA SUBUNIT 1
- (AGG)
G-PROTEIN GAMMA SUBUNIT
- (GO)
Gene Ontology
- (GDP)
Guanosine diphosphate
- (GTP)
Guanosine triphosphate
- (MAP)
Mitogen-activated protein
- (MPK6)
MAP KINASE 6
- (NPH3)
NON-PHOTOTROPIC HYPOCOTYL 3
- (RGS)
Regulator of G Signaling
- (TMT)
Tandem Mass Tags
- (WT)
Wild Type
- (WNK)
WITH NO LYSINE
Footnotes
Data Availability
Raw data files and MaxQuant Search results have been deposited in the Mass Spectrometry Interactive Virtual Environment (MassIVE) repository:
https://massive.ucsd.edu/ProteoSAFe/static/massive.jsphttps://massive.ucsd.edu/ProteoSAFe/static/massive.jspwith dataset identifier: MSV000082838.
The authors declare no conflict of interest.
References
- [1].Eichel K, von Zastrow M, Trends Pharmacol. Sci 2018, 39, 200. [DOI] [PMC free article] [PubMed] [Google Scholar]
- [2].Chen Q, Iverson TM, Gurevich VV, Trends Biochem. Sci 2018, 43, 412. [DOI] [PMC free article] [PubMed] [Google Scholar]
- [3].Carmona-Rosas G, Alcántara-Hernández R, Hernández-Espinosa DA, Eur. J. Cell Biol 2018, 97, 349. [DOI] [PubMed] [Google Scholar]
- [4].Urano D, Chen J-G, Botella JR, Jones AM, Open Biol 2013, 3, 120186. [DOI] [PMC free article] [PubMed] [Google Scholar]
- [5].Sprang SR, Biopolymers 2016, 105, 449. [DOI] [PMC free article] [PubMed] [Google Scholar]
- [6].Jones JC, Duffy JW, Machius M, Temple BRS, Dohlman HG, Jones AM, Sci. Signal 2011, 4, ra8. [DOI] [PMC free article] [PubMed] [Google Scholar]
- [7].Jones JC, Jones AM, Temple BRS, Dohlman HG, Proc. Natl. Acad. Sci 2012, 109, 7275. [DOI] [PMC free article] [PubMed] [Google Scholar]
- [8].Chen J-G, Willard FS, Huang J, Liang J, Chasse SA, Jones AM, Siderovski DP, Science (80-. ) 2003, 301, 1728. [DOI] [PubMed] [Google Scholar]
- [9].Fu Y, Lim S, Urano D, Tunc-Ozdemir M, Phan NG, Elston TC, Jones AM, Cell 2014, 156, 1084. [DOI] [PMC free article] [PubMed] [Google Scholar]
- [10].Cao-Pham AH, Urano D, Ross-Elliott TJ, Jones AM, New Phytol 2018, 10.1111/NPH.15276. [DOI] [PubMed]
- [11].Urano D, Phan N, Jones JC, Yang J, Huang J, Grigston J, Taylor JP, Jones AM, Nat. Cell Biol 2012, 14, 1079. [DOI] [PMC free article] [PubMed] [Google Scholar]
- [12].Tunc-Ozdemir M, Li B, Jaiswal DK, Urano D, Jones AM, Torres MP, Front. Plant Sci 2017, 8, 1456. [DOI] [PMC free article] [PubMed] [Google Scholar]
- [13].Urano D, Jones AM, Annu. Rev. Plant Biol 2014, 65, 365. [DOI] [PMC free article] [PubMed] [Google Scholar]
- [14].Wolfenstetter S, Chakravorty D, Kula R, Urano D, Trusov Y, Sheahan MB, McCurdy DW, Assmann SM, Jones AM, Botella JR, Plant J 2015, 81, 388. [DOI] [PMC free article] [PubMed] [Google Scholar]
- [15].Urano D, Maruta N, Trusov Y, Stoian R, Wu Q, Liang Y, Jaiswal DK, Thung L, Jackson D, Botella JR, Jones AM, Sci. Signal 2016, 9, ra93. [DOI] [PubMed] [Google Scholar]
- [16].Temple BRS, Jones AM, Annu. Rev. Plant Biol 2007, 58, 249. [DOI] [PubMed] [Google Scholar]
- [17].Chakravorty D, Gookin TE, Milner MJ, Yu Y, Assmann SM, Plant Physiol 2015, 169, 512. [DOI] [PMC free article] [PubMed] [Google Scholar]
- [18].Liang X, Ding P, Lian K, Wang J, Ma M, Li L, Li L, Li M, Zhang X, Chen S, Zhang Y, Zhou J-M, Elife 2016, 5, e13568. [DOI] [PMC free article] [PubMed] [Google Scholar]
- [19].Li B, Tunc-Ozdemir M, Urano D, Jia H, Werth EG, Mowrey DD, Hicks LM, V Dokholyan N, Torres MP, Jones AM, J. Biol. Chem 2018, 293, 4752. [DOI] [PMC free article] [PubMed] [Google Scholar]
- [20].Chen J-G, Gao Y, Jones AM, PLANT Physiol 2006, 141, 887. [DOI] [PMC free article] [PubMed] [Google Scholar]
- [21].Song G, McReynolds MR, Walley JW, in Methods Mol. Biol. Plant Genomics, 2017, pp. 123–133. [DOI] [PubMed]
- [22].Song G, Hsu PY, Walley JW, Proteomics 2018, 18, 1800220. [DOI] [PMC free article] [PubMed] [Google Scholar]
- [23].Thompson A, Schäfer J, Kuhn K, Kienle S, Schwarz J, Schmidt G, Neumann T, Hamon C, Anal. Chem 2003, 75, 1895. [DOI] [PubMed] [Google Scholar]
- [24].Dayon L, Hainard A, Licker V, Turck N, Kuhn K, Hochstrasser Denis F. ‖ and Burkhard Pierre R., Sanchez J-C, 2008, DOI 10.1021/AC702422X. [DOI] [PubMed]
- [25].Walley JW, Shen Z, McReynolds MR, Schmelz EA, Briggs SP, Proc. Natl. Acad. Sci 2018, 115, 210. [DOI] [PMC free article] [PubMed] [Google Scholar]
- [26].Tyanova S, Temu T, Cox J, Nat. Protoc 2016, 11, 2301. [DOI] [PubMed] [Google Scholar]
- [27].Heazlewood JL, Durek P, Hummel J, Selbig J, Weckwerth W, Walther D, Schulze WX, Nucleic Acids Res 2007, 36, D1015. [DOI] [PMC free article] [PubMed] [Google Scholar]
- [28].Tyanova S, Temu T, Sinitcyn P, Carlson A, Hein MY, Geiger T, Mann M, Cox J, Nat. Methods 2016, 13, 731. [DOI] [PubMed] [Google Scholar]
- [29].Tyanova S, Cox J, Humana Press, New York, NY, 2018, pp. 133–148. [Google Scholar]
- [30].Mi H, Muruganujan A, Thomas PD, Nucleic Acids Res 2012, 41, D377. [DOI] [PMC free article] [PubMed] [Google Scholar]
- [31].Klopffleisch K, Phan N, Augustin K, Bayne RS, Booker KS, Botella JR, Carpita NC, Carr T, Chen J-G, Cooke TR, Frick-Cheng A, Friedman EJ, Fulk B, Hahn MG, Jiang K, Jorda L, Kruppe L, Liu C, Lorek J, McCann MC, Molina A, Moriyama EN, Mukhtar MS, Mudgil Y, Pattathil S, Schwarz J, Seta S, Tan M, Temp U, Trusov Y, Urano D, Welter B, Yang J, Panstruga R, Uhrig JF, Jones AM, Mol Syst Biol 2011, 7, DOI http://www.nature.com/msb/journal/v7/n1/suppinfo/msb201166_S1.html. [DOI] [PMC free article] [PubMed] [Google Scholar]
- [32].Jaiswal DK, Werth EG, McConnell EW, Hicks LM, Jones AM, Curr. Plant Biol 2016, 5, 25. [Google Scholar]
- [33].Szklarczyk D, Morris JH, Cook H, Kuhn M, Wyder S, Simonovic M, Santos A, Doncheva NT, Roth A, Bork P, Jensen LJ, von Mering C, Nucleic Acids Res 2017, 45, D362. [DOI] [PMC free article] [PubMed] [Google Scholar]
- [34].Yu Y, Chakravorty D, Assmann SM, Plant Physiol 2018, 176, 2426. [DOI] [PMC free article] [PubMed] [Google Scholar]
- [35].Xu D, Chen M, Ma Y, Xu Z, Li L, Chen Y, Ma Y, PLoS One 2015, 10, e0116385. [DOI] [PMC free article] [PubMed] [Google Scholar]
- [36].Guo H, Nolan TM, Song G, Liu S, Xie Z, Chen J, Schnable PS, Walley JW, Yin Y, Curr. Biol 2018, DOI 10.1016/J.CUB.2018.07.078. [DOI] [PubMed]
- [37].Kansup J, Tsugama D, Liu S, Takano T, Biochem. Biophys. Res. Commun 2014, 445, 54. [DOI] [PubMed] [Google Scholar]
Associated Data
This section collects any data citations, data availability statements, or supplementary materials included in this article.


