Abstract
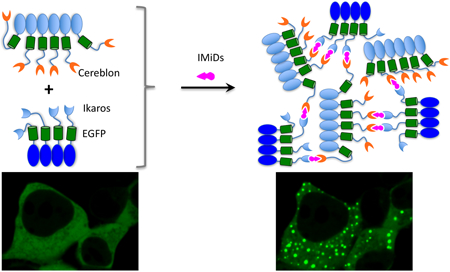
Protein-protein interactions (PPIs) mediate signal transduction in cells. Small molecules that regulate PPIs are important tools for biology and biomedicine. Dynamic imaging of small molecule-induced PPIs characterizes and verifies these molecules in living cells. It is thus important to develop cellular assays for dynamic visualization of small molecule-induced protein-protein association and dissociation in living cells. Here we have applied fluorophore phase transition-based principle and designed a PPI assay named SPPIER (separation of phases-based protein interaction reporter). SPPIER utilizes the green fluorescent protein (GFP) and is thus genetically encoded. Upon small molecule-induced PPI, SPPIER rapidly forms highly fluorescent GFP droplets in living cells. SPPIER detects immunomodulatory drugs (IMiDs)-induced PPI between cereblon and the transcription factor Ikaros. It also detects IMiDs analog (e.g. CC-885)-induced PPI between cereblon and GSPT1. Furthermore, SPPIER can visualize bifunctional molecules (e.g. PROTAC)-induced PPI between an E3 ubiqutin ligase and a target protein. Lastly, SPPIER can be modified to image small molecule-induced protein-protein dissociation, such as nutlin-induced dissociation between HDM2 and p53. The intensive brightness and rapid kinetics of SPPIER enable robust and dynamic visualization of PPIs in living cells.
Graphical Abstract

INTRODUCTION
Small molecules that modulate protein-protein interactions (PPI) are important tools for biological investigation and therapeutic intervention 1. For example, the immunomodulatory drugs (IMiDs) bind to the E3 ligase cereblon and induce interaction between cereblon and the transcription factor Ikaros, leading to ubiquitination and degradation of the transcription factor 2. The cereblon-based degradation of Ikaros accounts for the clinical efficacy of IMiDs such as lenalidomide against multiple myeloma 3-5. Another example is nutlin, which binds to the E3 ligase HDM2 and disrupts its interaction with the transcription factor p53, resulting in stabilization of p53, leading to cell cycle arrest and apoptosis of cancer cells 6. It is thus important to develop cellular assays for imaging small molecule-induced protein-protein association as well as dissociation in living cells.
An ideal assay to detect small molecule-induced PPI should have large fluorescence change, high brightness, rapid and reversible kinetics, and be applicable to live cells so that the PPI is detected in the context of living cells. Here we decided to apply GFP phase transition-based principle and design a cellular assay (named SPPIER for separation of phases-based protein interaction reporter) for detecting small molecule-induced PPI.GFP has been widely used as a fluorescent tag in live cells, and has revolutionized molecular and cell biology, because its fluorescence is genetically encoded and requires no cofactors except molecular oxygen 7,8.
SPPIER is an addition to many other genetically encoded PPI detection methods, including bimolecular fluorescence complementation (BiFC) 9,10, fluorescence resonance energy transfer (FRET) 11, and dimerization dependent fluorescent proteins (ddFP) 12,13. All these assays have their own advantages and limitations. For example, while the fluorophore phase transition-based assay achieves high brightness and large fluorescence change, they lack spatial resolution and the introduced oligomeric tags might perturb protein function. On the other hand, BiFC, FRET and ddFP achieve better spatial resolution in detecting PPIs but their signal over noise is smaller than SPPIER. Based on their advantages and limitations, these assays can fulfill different needs or purposes in detecting various PPIs.
For example, many of the genetically encoded PPI assays such as FRET has been used in high content screening (HCS) 14, but their application has been limited in HCS due to small signal over noise. On the other hand, our fluorophore phase transition-based assay will be advantageous for HCS because of its large fluorescence change, high brightness and easily recognizable signal pattern.
EXPERIMENTAL SECTION
Plasmid construction.
All plasmid constructs were created by standard molecular biology techniques and confirmed by exhaustively sequencing the cloned fragments. To create E3 ubiqutin ligase (e.g. CRBN, VHL)-EGFP-HOTag3 fusions, the target protein was first cloned into pcDNA3 containing EGFP. HOTag3 was then cloned into the pcDNA3 E3 ligase-EGFP construct, resulting in pcDNA3 E3 ligase-EGFP-HOTag3. Similar procedures were carried out to produce pcDNA3 target protein (e.g. BRD4(1), IKZF1ZF2)-EGFP-HOTag6. To create the inducible SPPIER, FKBP12-EGFP-HOTag3 and Frb-p53TAD-HOTag6 were created in a similar procedure; Hdm2p53BD-IFP2 fusion was created by linking the DNA sequence of Hdm2p53BD and IFP2, which was subsequently cloned into a pcDNA3 vector.
Cell culture.
The HEK293T/17 cells were passaged in Dulbecco’s Modified Eagle medium (DMEM) supplemented with 10% Fetal Bovine Serum (FBS), non-essential amino acids, penicillin (100 units/mL) and streptomycin (100 μg/mL). All culture supplies were obtained from the UCSF Cell Culture Facility.
Live cell imaging.
HEK293T/17 cells were transiently transfected with the plasmid using calcium phosphate transfection reagent or lipofectamine. Cells were grown in 35 mm glass bottom microwell (14 mm) dishes (MatTek Corporation). Transfection was performed when cells were cultured to ~50% confluence. For each transfection, 4.3 μg of plasmid DNA was mixed with 71 μL of 1X Hanks’ Balanced Salts buffer (HBS) and 4.3 μL of 2.5M CaCl2. Cells were imaged 24 hours after transient transfection. Time-lapse imaging was performed with the aid of an environmental control unit incubation chamber (InVivo Scientific), which was maintained at 37 °C and 5% CO2. Fluorescence images were acquired with an exposure time of 50 ms for EGFP, 200 ms for IFP2. Chemical reagents, including IMiDs (Lenalidomide) and derivatives (CC-885), rapamycin, Nutlin-3a, and various bifunctional molecules (ARV-825, dBET1, ARV-771), were carefully added to the cells in the incubation chamber when the time-lapse imaging was started. Image acquisition was controlled by the NIS-Elements Ar Microscope Imaging Software (Nikon). Images were processed using NIS-Elements and ImageJ (NIH).
Image analysis.
For analysis of the SPPIER signal, images were processed in imageJ. The sum of droplets pixel fluorescence intensity and the cells pixel intensity were scored using Analyze Particle function in imageJ.
RESULTS AND DISCUSSION
Designing a cellular assay for detecting small molecule-induced PPI
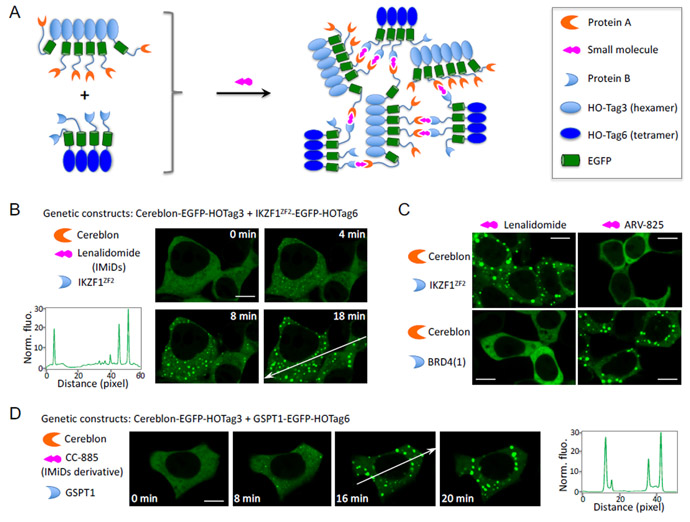
Our assay is based on multivalent PPI-induced protein phase transition, which leads to formation of highly concentrated protein droplets 15,16. Here, to introduce multivalency, we utilizedde novo designed coiled coil as homo-oligomeric tag (HO-Tag). To obtain fluorescence, we incorporated the enhanced GFP (EGFP) into the reporter because its use in living cells has been validated in many contexts. In particular, to design a PPI assay for detecting small molecule-induced interaction between protein A and protein B, we genetically fused a short coiled coil-based HO-Tag3 (hexamer, 30-amino acid [aa]) to protein A; and another coiled coil-based HO-Tag6 (tetramer, 33aa, Supplementary Fig. 1) 17,18, to protein B (Figure 1A). Upon small molecule-induced PPI between proteins A and B, each hexameric protein A-EGFP-HOTag3 recruits six protein B-EGFP-HOTag6. Then each tetrameric protein B-EGFP-HOTag6 recruits four protein A-EGFP-HOTag3, and so on. Eventually the HO-Tag-introduced multivalency and the proteins A/B’s interaction lead to EGFP phase separation, forming highly green fluorescent EGFP droplets. We named this PPI assay SPPIER for separation of phases-based protein interaction reporter. SPPIER is similar to a previous assay named Fluoppi 19. While Fluoppi uses tetrameric fluorescent proteins, SPPIER is not limited to oligomeric fluorescent proteins.
Figure 1. Fluorophore phase separation-based assay for imaging IMiD and its derivative-induced protein-protein interactions in living cells.
(A). Schematic diagram showing the design of the cellular assay.
(B). Fluorescence images showing detection of IMiDs (lenalidomide)-induced interaction between the E3 ligase cereblon and the transcription factor Ikaros. Fluorescence histogram of the line across the cells is shown on the right. HEK293 cells transiently expressed CRBN-EGFP-HOTag3 and IKZF1ZF2-EGFP-HOTag6. 1μ lenalidomide was added to the cells.
(C). Specificity of SPPIER. HEK293 cells transiently expressed CRBN-EGFP-HOTag3 and BRD4(1)-EGFP-HOTag6, or CRBN-EGFP-HOTag3 and IKZF1ZF2-EGFP-HOTag6. 1μM lenalidomide or 1μm ARV-825 was added to the cells.
(D). Fluorescence images showing detection of an IMiDs derivative, CC-885, induced interaction between the E3 ligase cereblon and GSPT1. Fluorescence histogram of the line across the cells is shown on the right. HEK293 cells transiently expressed CRBN-EGFP-HOTag3 and GSPT1-EGFP-HOTag6. 1μM CC-885 was added to the cells.
Scale bar: 10 μm.
SPPIER visualizes IMiDs-induced interaction between cereblon and Ikaros
IMiDs, such as lenalidomide, are small molecules that induce PPI between the E3 ubiquitin ligase cereblon and the transcription factor Ikaros 3,20. To show whether SPPIER can detect IMiDs-induced PPI, we genetically fused HO-Tag3 and EGFP to cereblon, and HO-Tag6 to the zinc finger domain 2 (ZF2) of Ikaros (IKZF1ZF2). Coexpression of CRBN-EGFP-HOTag3 and IKZF1ZF2-EGFP-HOTag6 in the human embryonic kidney 293 (HEK293) cells revealed homogenous fluorescence (Figure 1B). Addition of lenalidomide led to EGFP droplet formation within a few minutes (Supplementary Video 1), indicating that SPPIER can detect IMiDs-induced PPI.
We next examined specificity of SPPIER. While lenalidomide induces interaction between cereblon and Ikaros, another small molecule named ARV-825 induces interaction between cereblon and BRD4(1) (see below). First, we co-expressed CRBN-EGFP-HOTag3 and IKZF1ZF2-EGFP-HOTag6 in the HEK293 cells. Addition of lenalidomide led to droplet formation (Figure 1C). In contrast, addition of ARV-825 did not result in any droplet formation. Next, we co-expressed CRBN-EGFP-HOTag3 and BRD4(1)-EGFP-HOTag6 in HEK293 cells. While lenalidomide did not induce any droplet formation, ARV-825 induced EGFP droplet formation. This data demonstrates that SPPIER achieves specificity in PPI detection.
SPPIER visualizes IMiDs analog-induced interaction between cereblon and GSPT1
Because of successful applications of SPPIER in imaging of IMiDs-induced PPIs, we next decided to examine if SPPIER can detect small molecules that are derived from IMiDs. Many analogs and derivatives of IMiDs have recently been designed and explored as drug leads against cancer. CC-885, one IMiDs derivative, has shown to induce interaction between CRBN and GSPT1 21. To examine whether SPPIER can detect CC-885 induced PPI, we genetically fused HO-Tag6 to GSPT1 and co-expressed GSPT1-EGFP-HOTag6 and CRBN-EGFP-HOTag3 in HEK293 cells. Time-lapse imaging revealed that the co-expressed fusion proteins were homogeneously fluorescent (Figure 1D). Addition of CC-885 led to intensely bright and punctal green fluorescence (Supplementary Video 2). Thus, SPPIER also detects CC-885 induced PPI. The result suggests that SPPIER can be a powerful assay to screen IMiDs analogs and derivatives targeting specific proteins in live cells.
SPPIER visualizes bifunctional molecules-induced PPI
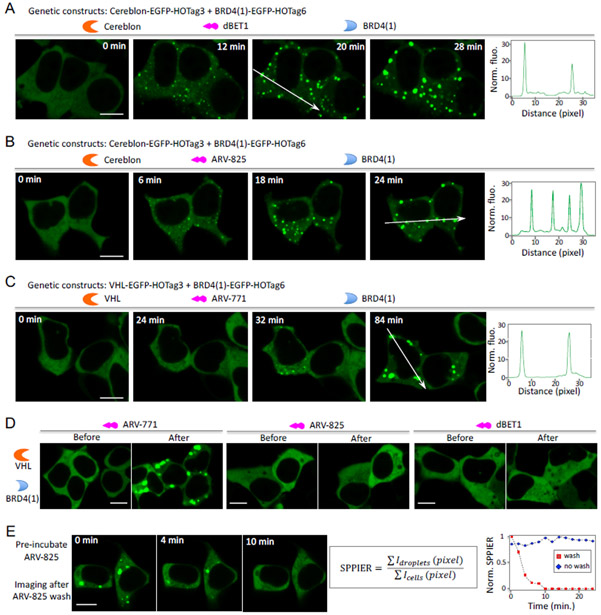
To further demonstrate SPPIER, we decided to detect a bifunctional molecule (named dBET1)-induced PPI between cereblon and BRD4(1) (i.e. BRD4 bromodomain 1). dBET1 was designed by linking cereblon (CRBN)-binding IMiD and BRD4-binding ligand JQ1, and it was shown to induce BET protein degradation and delay leukemia progression in mice 22. Using the Alphascreen assay, dBET1 was previously shown to induce the interaction between CRBN and BRD4(1). To design and demonstrate SPPIER for detecting dBET1-induced PPI in living cells, we genetically fused HO-Tag3 to CRBN and HO-Tag6 to BRD4(1). Co-expression of the two fusion proteins revealed homogeneous fluorescence in HEK293 cells (Figure 2A). Addition of dBET1 to the cells led to fast formation of EGFP droplets within a few minutes, indicated by the punctal green fluorescence. The intensive brightness (10×) and simple signal pattern allowed straightforward and robust detection of the dBET1-induced interaction. Our data thus demonstrates that SPPIER enables robust detection of dBET1-induced PPI in living cells.
Figure 2. SPPIER detects bifunctional molecules-induced protein-protein interaction in living cells.
(A) Detection of dBET1 (5 μM)-induced interaction between the E3 ligase cereblon (CRBN) and BRD4(1). Fluorescence histogram of the line across the cells is shown on the right. HEK293 cells transiently expressed CRBN-EGFP-HOTag3 and BRD4(1)-EGFP-HOTag6. (B) Detection of a ARV-825 (O.1 μM)-induced interaction between the E3 ligase cereblon (CRBN) and BRD4(1). (C) Detection of ARV-771 (1 μM)-induced interaction between the E3 ligase VHL and BRD4. HEK293 cells transiently expressed VHL-EGFP-HOTag3 and BRD4(1)-EGFP-HOTag6. (D) Specificity of SPPIER. HEK293 cells transiently expressed VHL-EGFP-HOTag3 and BRD4(1)-EGFP-HOTag6. 1 μM ARV-771, or 1 μM ARV-825, or 5μM dBET1 was added to the cells. Images were taken before and (2hrs) after addition of the bifunctional molecule. (E) SPPIER is reversible. Cells were pre-incubated with ARV-825. Scale bar: 10 μm.
Next, we decided to show whether SPPIER can detect another bifunctional molecule (named ARV-825)-induced PPI. ARV-825 was previously designed by chemically linking pomalidomide (a cereblon (CRBN)-binding IMiD) and OTX015 (a BRD4- binding ligand) 23. We co-expressed the two fusion proteins (CRBN-EGFP-HOTag3, and BRD4(1)-EGFP-HOTag6) in HEK293 cells. Addition of ARV-825 to the cells led to formation of EGFP droplets with intensive brightness and simple signal pattern (Figure 2B), which indicates that SPPIER can detect ARV825-induced interaction between CRBN and BRD4(1).
We also examined whether SPPIER could be used to detect a bifunctional molecule (named ARV-771)-induced PPIs between the E3 ubiquitin ligase VHL (von Hippel-Lindau tumor suppressor protein) and BRD4(1) 24 ARV-771 was synthesized by linking a BET inhibitor and a VHL ligand, and it was shown to induce BET protein degradation and tumor regression in mice. To detect ARV771-induced PPI, we genetically fused HO-Tag3 and EGFP to VHL. Co-expression of VHL-EGFP-HOTag3 and BRD4(1)-EGFP-HOTag6 in HEK293 cells revealed homogenous fluorescence in the absence of ARV-771, suggesting no interaction between VHL and BRD4(1) (Figure 2C). Addition of ARV-771 led to EGFP droplet formation (Figure 2C), indicating that ARV-771 did induce the PPI between VHL and BRD4(1). We also examined specificity of SPPIER in detecting bifunctional molecules-induced interaction. We added the three bifunctional molecules to cells expressing VHL-EGFP-HOTag3 and BRD4(1)-EGFP-HOTag6. While ARV-771 induced EGFP droplet formation, the other two molecules did not (Figure 2D). Therefore, our data demonstrates that SPPIER can robustly and specifically detect bifunctional molecules-induced PPIs in living cells.
SPPIER is reversible upon removal of the PPI-inducible small molecules
Lastly, to demonstrate that SPPIER is reversible, i.e. the EGFP droplets are dependent on the small molecule-induced PPI, we examined whether the EGFP droplets dissemble when ARV-825 is removed. We pre-incubated the cells with ARV-825 to induce EGFP phase separation, then washed the molecule and conducted time-lapse imaging. The punctal green fluorescence became homogeneous within 10 minutes, indicating that the EGFP droplets indeed dissembled quickly upon removal of the molecule (Figure 2E). As a control, without removing ARV-825, the droplets were not disassembled over time and instead they coalesced into larger ones (Supplementary Video 3). To quantify the data, we defined “SPPIER signal” as sum of fluorescent droplets’ pixel intensity divided by sum of cells’ pixel intensity. Analysis of the time-lapse imaging data indicated that the SPPIER signal decreased upon removal of the molecule, whereas the signal was stable over time when the small molecule was not washed (Figure 2E). Our data thus demonstrates that SPPIER can reversibly monitor small molecule-induced PPIs in living cells. Additionally, we also applied SPPIER signal and quantified other time-lapse imaging data (Supplementary Fig. 2). Furthermore, we showed that higher concentration of ARV825 led to higher SPPIER signal (Supplementary Fig. 3), indicating that SPPIER is dependent on the ligand concentration. Our data suggests that the EGFP droplets are formed via small molecule-induced multivalent PPI.
Inducible SPPIER visualizes small molecule-induced protein-protein dissociation
After demonstration of SPPIER in detecting small molecule-induced protein-protein association, we moved further to show if SPPIER can detect small molecule-induced protein-protein dissociation. One of the well-established examples for small moleculebased disruption of PPIs is Nutin-induced dissociation of HDM2 and p53 6. p53 is a tumor suppressor and master regulator of diverse cellular processes 25. It interacts with the E3 ligase HDM2, resulting in ubiquitination and degradation. HDM2 is often overexpressed in many human cancers. Nutlin-3a disrupts the interaction between p53 and HDM2, and thus stabilizes p53, leading to p53-dependent apoptosis.
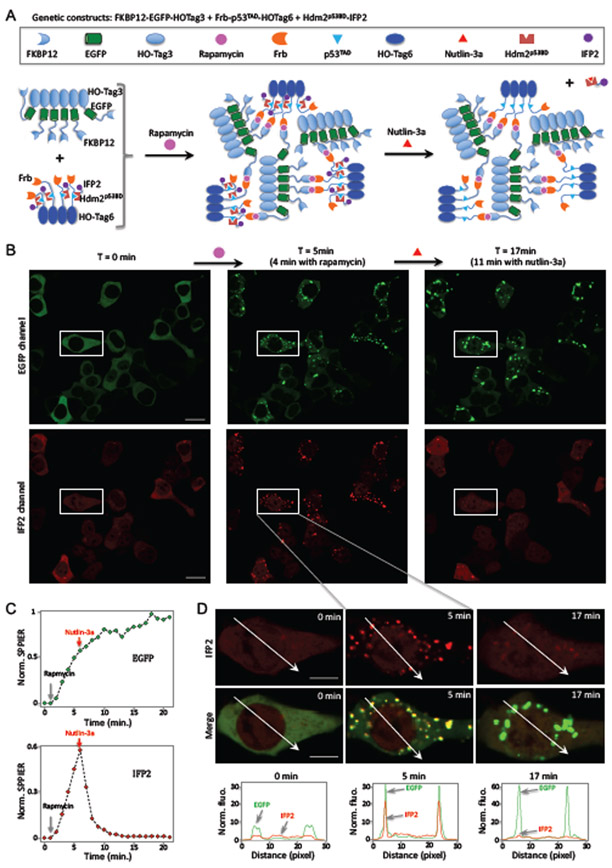
To demonstrate SPPIER in Nutlin-induced dissociation of HDM2/p53 complex, we designed an inducible SPPIER system (Figure 3A). In particular, we genetically fused HO-Tag6 to the transactivation domain (TAD) of p53 and Frb (Frb-p53TAD-HOTag6); HO-Tag3 to EGFP and FKBP12 (FKBP12-EGFP-HOTag3); IFP2 (an improved infrared fluorescent protein 26) to the p53 binding domain (p53BD) of HDM2 (HDM2p53BD-IFP2). Co-expression of these three fusion constructs in the HEK293 cells led to homogeneous green and infrared fluorescence (Figure 3B). Addition of rapamycin, which induces interaction between FKBP12 and Frb, resulted in rapid formation of green and infrared fluorescent droplets within a few minutes (Figure 3B – D, Supplementary Video 4-5). Following this, we added Nutlin-3a, which led to rapid disassembly of the infrared fluorescent droplets with half-time ~ 2 min (Figure 3C). On the other hand, the green fluorescent droplets were not affected by Nutlin-3a. This data demonstrates that SPPIER detects Nutlin-3a induced dissociation of p53 and HDM2. As a control, addition of DMSO instead of Nutlin-3a did not disassemble infrared fluorescent droplets (Supplementary Fig. 4).
Figure 3. Inducible SPPIER detects small molecule-induced dissociation of a protein complex in live cells.
(A). Schematic of the design strategy for rapamycin-inducible SPPIER.
(B). Time-lapse fluorescence images of HEK293 cells upon addition of rapamycin (0.1 μM), followed by Nutlin-3a (10 μM). HEK293 cells transiently expressed FKBP12- EGFP-HOTag3, Frb-p53TAD-HOTag6, and HDM2p53BD-IFP2. IFP2 is an improved infrared fluorescent protein (IFP).
(C). Kinetics of the green (top) and infrared (bottom) fluorescent SPPIER signal upon addition of rapamycin and nutlin-3a, corresponding to (B).
(D). Time-lapse fluorescence images corresponding to the zoom-in area shown in (B). Fluorescence histogram of the line across the cells is shown at the bottom.
Scale bar: B, 20 μm; D, 10 μm.
CONCLUSIONS
We have developed a fluorophore phase transition-based PPI assay, SPPIER. It achieves large fluorescence change, high brightness, fast and reversible kinetics in live cells. It robustly and specifically detects small molecule-induced PPIs in living cells. We have further developed inducible SPPIER and demonstrated that it can detect small molecule-induced dissociation of PPIs, suggesting that SPPIER may be used to screen for potent PPI inhibitors.
Supplementary Material
Supporting Information
The supporting information is available free of charge on the ACS publications website.
Figure S1. Amino acid sequence of HO-Tag3 and HO-Tag6. Figure S2. Quantification of SPPIER signal related to time-lapse imaging data in Figures 1 and 2.
Figure S3. SPPIER signal dependence on ligand concentration.
Figure S4. Kinetics of the green (A) and infrared (B) fluorescent SPPIER signal upon addition of rapamycin (0.1 μM) followed by DMSO.
ACKNOWLEDGMENTS
This work was supported by NIH Director’s New Innovator Award (1DP2GM105446).
Footnotes
COMPETING FINANCIAL INTERESTS
X.S. and C-I.C. have filed a patent application covering this work.
REFERENCES
- (1).Burslem GM; Crews CM Chem Rev 2017, 117 (17), 11269–11301. [DOI] [PubMed] [Google Scholar]
- (2).Fischer ES; Böhm K; Lydeard JR; Yang H; Stadler MB; Cavadini S; Nagel J; Serluca F; Acker V; Lingaraju GM; Tichkule RB; Schebesta M; Forrester WC; Schirle M; Hassiepen U; Ottl J; Hild M; Beckwith REJ; Harper JW; Jenkins JL; Thoma NH Nature 2014, 512 (7512), 49–53. [DOI] [PMC free article] [PubMed] [Google Scholar]
- (3).Krönke J; Udeshi ND; Narla A; Grauman P; Hurst SN; McConkey M; Svinkina T; Heckl D; Comer E; Li X; Ciarlo C; Hartman E; Munshi N; Schenone M; Schreiber SL; Carr SA; Ebert BL Science 2014, 343 (6168), 301–305. [DOI] [PMC free article] [PubMed] [Google Scholar]
- (4).Lu G; Middleton RE; Sun H; Naniong M; Ott CJ; Mitsiades CS; Wong K-K; Bradner JE; Kaelin WG Science 2014, 343 (6168), 305–309. [DOI] [PMC free article] [PubMed] [Google Scholar]
- (5).Ito T; Ando H; Suzuki T; Ogura T; Hotta K; Imamura Y; Yamaguchi Y; Handa H Science 2010, 327 (5971), 1345–1350. [DOI] [PubMed] [Google Scholar]
- (6).Vassilev LT; Vu BT; Graves B; Carvajal D; Podlaski F; Filipovic Z; Kong N; Kammlott U; Lukacs C; Klein C; Fotouhi N; Liu EA Science 2004, 303 (5659), 844–848. [DOI] [PubMed] [Google Scholar]
- (7).Tsien RY Angew Chem Int Ed Engl 2009, 48 (31), 5612–5626. [DOI] [PubMed] [Google Scholar]
- (8).Tsien RY Annu Rev Biochem 1998, 67, 509–544. [DOI] [PubMed] [Google Scholar]
- (9).Kerppola TK Annual review of biophysics 2008, 37 (1), 465–487. [DOI] [PMC free article] [PubMed] [Google Scholar]
- (10).Kerppola TK Cold Spring Harbor Protocols 2013, 2013 (8), pdb.prot076497–pdb.prot076497. [DOI] [PubMed] [Google Scholar]
- (11).Kiyokawa E; Aoki K; Nakamura T; Matsuda M Annu Rev Pharmacol Toxicol 2011, 51 (1), 337–358. [DOI] [PubMed] [Google Scholar]
- (12).Ding Y; Li J; Enterina JR; Shen Y; Zhang I; Tewson PH; Mo GCH; Zhang J; Quinn AM; Hughes TE; Maysinger D; Alford SC; Zhang Y; Campbell RE Nat Methods 2015, 12 (3), 195–198. [DOI] [PMC free article] [PubMed] [Google Scholar]
- (13).Alford SC; Ding Y; Simmen T; Campbell RE ACS Synth. Biol 2012, 1 (12), 569–575. [DOI] [PMC free article] [PubMed] [Google Scholar]
- (14).Janzen WP Chem Biol 2014, 21 (9), 1162–1170. [DOI] [PubMed] [Google Scholar]
- (15).Zhang Q; Huang H; Zhang L; Wu R; Chung C-I; Zhang S-Q; Torra J; Schepis A; Coughlin SR; Kornberg TB; Shu X Mol Cell 2018, 69 (2), 334–345.e335. [DOI] [PMC free article] [PubMed] [Google Scholar]
- (16).Li P; Banjade S; Cheng H-C; Kim S; Chen B; Guo L; Llaguno M; Hollingsworth JV; King DS; Banani SF; Russo PS; Jiang Q-X; Nixon BT; Rosen MK Nature 2012, 483 (7389), 336–340. [DOI] [PMC free article] [PubMed] [Google Scholar]
- (17).Thomson AR; Wood CW; Burton AJ; Bartlett GJ; Sessions RB; Brady RL; Woolfson DN Science 2014, 346 (6208), 485–488. [DOI] [PubMed] [Google Scholar]
- (18).Grigoryan G; Kim YH; Acharya R; Axelrod K; Jain RM; Willis L; Drndic M; Kikkawa JM; DeGrado WF Science 2011, 332 (6033), 1071–1076. [DOI] [PMC free article] [PubMed] [Google Scholar]
- (19).Watanabe T; Seki T; Fukano T; Sakaue-Sawano A; Karasawa S; Kubota M; Kurokawa H; Inoue K; Akatsuka J; Miyawaki A Sci. Rep 2017, 1–13. [DOI] [PMC free article] [PubMed] [Google Scholar]
- (20).Petzold G; Fischer ES; Thomä NH Nature 2016, 532 (7597), 127–130. [DOI] [PubMed] [Google Scholar]
- (21).Matyskiela ME; Ito T; Pagarigan B; Lu C-C; Miller K; Fang W; Wang N-Y; Nguyen D; Houston J; Carmel G; Tran T; Riley M; Nosaka L; Lander GC; Gaidarova S; Xu S; Ruchelman AL; Handa H; Carmichael J; Daniel TO; Cathers BE; Lopez-Girona A; Lu G; Chamberlain PP Nature 2016, 535 (7611), 252–257. [DOI] [PubMed] [Google Scholar]
- (22).Winter GE; Buckley DL; Paulk J; Roberts JM; Souza A; Dhe-Paganon S; Bradner JE Science 2015, 348 (6241), 1376–1381. [DOI] [PMC free article] [PubMed] [Google Scholar]
- (23).Lu J; Qian Y; Altieri M; Dong H; Wang J; Raina K; Hines J; Winkler JD; Crew AP; Coleman K; Crews CM Chem Biol 2015, 22 (6), 755–763. [DOI] [PMC free article] [PubMed] [Google Scholar]
- (24).Raina K; Lu J; Qian Y; Altieri M; Gordon D; Rossi AMK; Wang J; Chen X; Dong H; Siu K; Winkler JD; Crew AP; Crews CM; Coleman KG Proceedings of the National Academy of Sciences 2016, 113 (26), 7124–7129. [DOI] [PMC free article] [PubMed] [Google Scholar]
- (25).Joerger AC; Fersht AR Annu Rev Biochem 2016, 85 (1), 375–404. [DOI] [PubMed] [Google Scholar]
- (26).Yu D; Gustafson WC; Han C; Lafaye C; Noirclerc-Savoye M; Ge W-P; Thayer DA; Huang H; Kornberg TB; Royant A; Jan LY; Jan Y-N; Weiss WA; Shu X Nature Communications 2014, 5. [DOI] [PMC free article] [PubMed] [Google Scholar]
Associated Data
This section collects any data citations, data availability statements, or supplementary materials included in this article.
Supplementary Materials
Supporting Information
The supporting information is available free of charge on the ACS publications website.
Figure S1. Amino acid sequence of HO-Tag3 and HO-Tag6. Figure S2. Quantification of SPPIER signal related to time-lapse imaging data in Figures 1 and 2.
Figure S3. SPPIER signal dependence on ligand concentration.
Figure S4. Kinetics of the green (A) and infrared (B) fluorescent SPPIER signal upon addition of rapamycin (0.1 μM) followed by DMSO.


