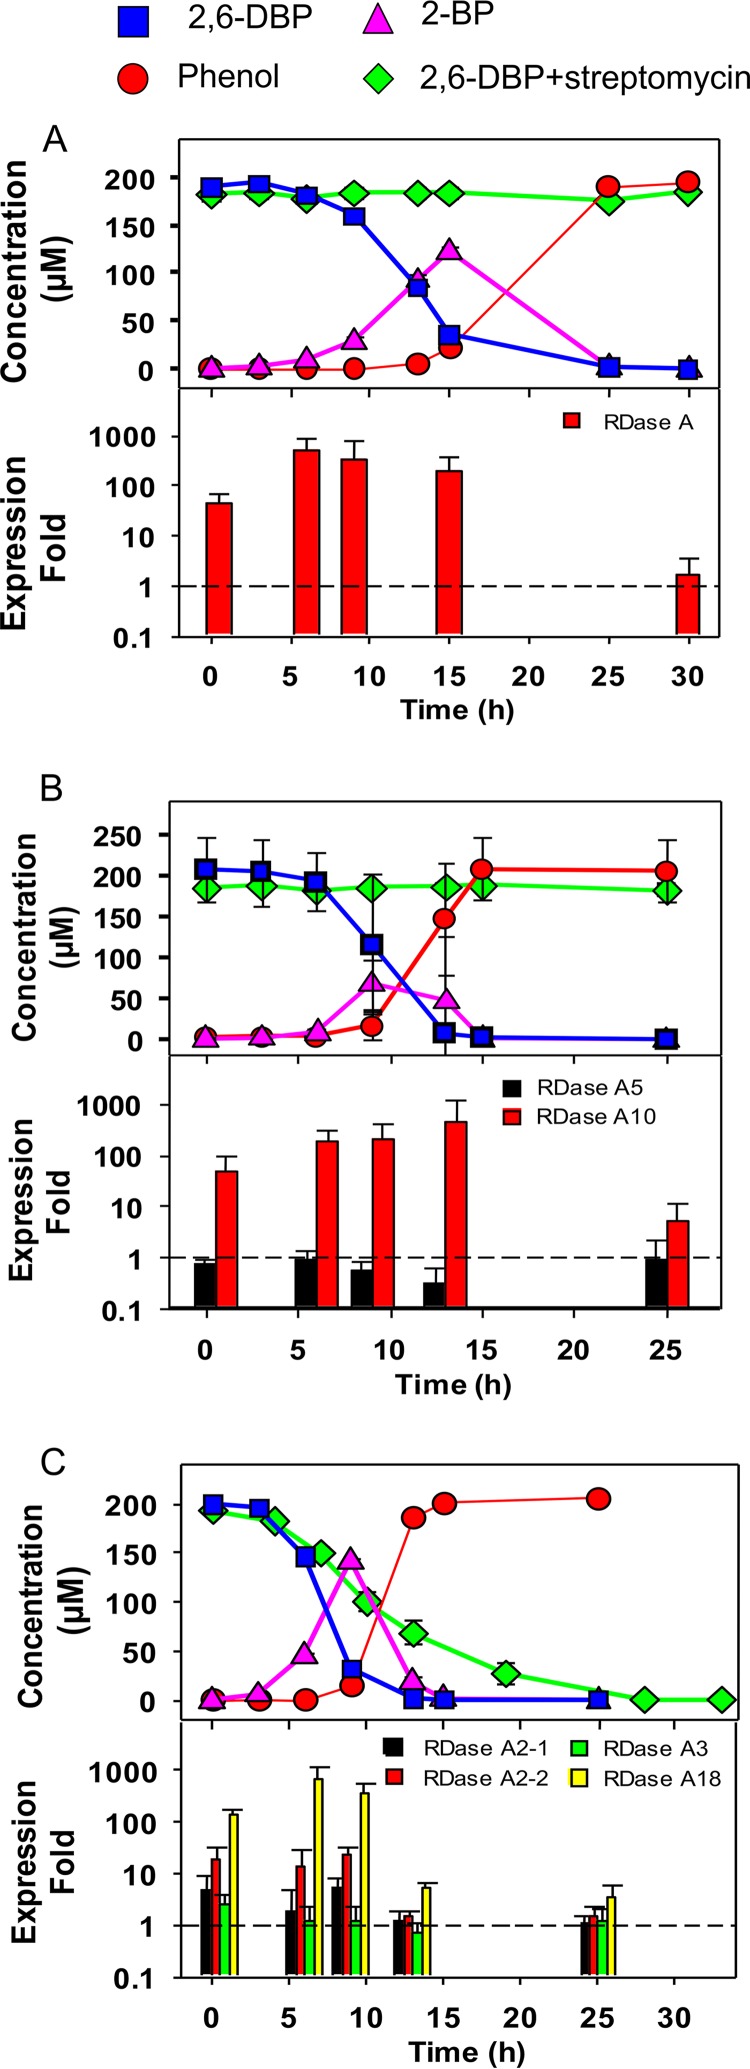
FIG 3.
Debromination activity in 2,6-dibromophenol-induced cultures (upper panel) and the expression of RDase A genes (lower panel) of H. marinisediminis (A), D. kysingii (B), and D. bizertensis (C) over time. The upper panel for each strain shows the concentration of 2,6-DBP and its debromination products, 2-BP and phenol, without or with 1 mg/ml streptomycin. Error bars when larger than the symbols indicate the means and standard deviations from biological triplicates. The lower panel for each strain indicates the relative expression of RDase A genes induced by 2,6-DBP, which was normalized to the expression of the 16S rRNA gene. The y axis indicates the expression fold of 2,6-DBP-induced cultures compared to untreated controls. Error bars represent the standard deviations from three biological triplicates, each with RT-PCRs performed in duplicate.

