Figure 3.
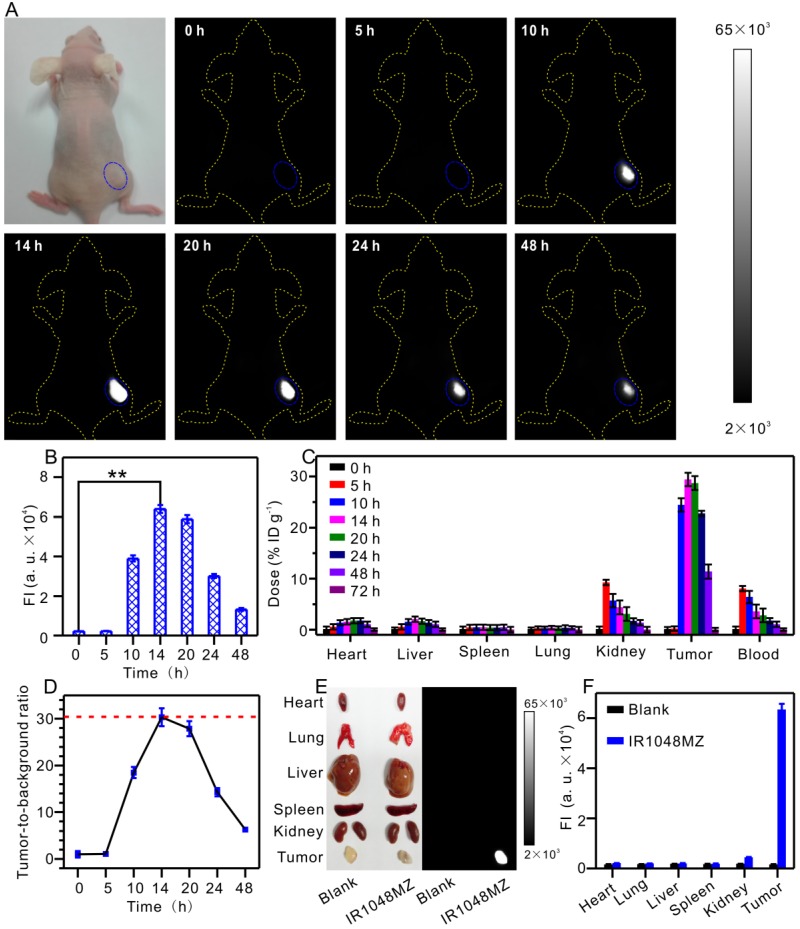
NIR II fluorescence imaging of tumor hypoxia in vivo after intravenous injection of 200 μL 40 μg/mL IR1048-MZ. All the NIR II images were acquired with a NIR II imaging system with 980 nm excitation and 1000 nm longpass emission filter. (A) NIR II fluorescence imaging of tumors (blue circles) in living mice at different time intervals and (B) quantified fluorescence intensities. (C) Probe content in the heart, liver, spleen, lung, kidney, tumor and blood of the mice at various time points after intravenous injection. The results are presented as the percentage of injected dose per gram of dissected tissue and averaged over five mice per group (mean ± s.d.). (D) The tumor-to-background ratio plotted as a function of time after intravenous injection for NIR II images. (E) Ex vivo NIR II fluorescence imaging of dissected tumors and organs from mice in different groups at 14 h post-injection and (F) quantified fluorescence intensities.

